QUARTERLY COMMENTARY MARCH 2017 - INCLUDES: QUARTER ONE 2017 - Perpetua Investment Managers
←
→
Page content transcription
If your browser does not render page correctly, please read the page content below

MARCH 2017

QUARTERLY
COMMENTARY

INCLUDES:
SUMMARY OF         MARKET AND           INVESTMENT
PORTFOLIO          PERFORMANCE REVIEW   COMMENTARY
PERFORMANCE AND
POSITIONING        PROXY VOTING
                   SUMMARY FOR THE
                   QUARTER

QUARTER ONE 2017
QUARTERLY COMMENTARY REPORT
                                                PERPETUA INSTITUTIONAL EQUITY | MARCH 2017

         FUND RETURNS

                                                                               Since
                                          March 2017     Quarter to Date   Measurement*
                                                                            (Annualised)
         Perpetua Institutional Equity      -0.5%            -0.6%             8.6%

         SWIX (J403) Weighted All Share     2.2%              3.3%            11.8%
         *Measurement date: 01/11/2012

         SECTOR RETURNS

         Sector Name                                         Code            Q1 2017

         All Share                                            J203             3.8%
         SWIX                                                 J403             3.3%
         Value                                                J330             1.2%
         SA Industrials                                       J257             6.6%
         Resources                                            J258             2.7%
         Financials                                           J580             -1.1%
         Gold Mining                                          J150             2.4%
         Platinum & Precious Mining                           J153             7.9%
         Top 40                                               J200             3.9%
         Mid Cap                                              J201             1.1%
         Small Cap                                            J202             4.6%

         ASSET CLASS RETURNS & KEY INDICATORS

         Sector Name
                                            Code           Spot Price        Q1 2017

         Cash                               STEFI               -              1.9%
         All Bond Index                     ALBTR               -              2.5%
         SA Listed Property                  J253               -              1.4%
         USDZAR                              Spot            13.41             2.1%
         Oil Price                         US$/bbl           52.83             7.7%
         Gold                              US$/oz           1249.20            8.9%
         Platinum                          US$/oz            950.35            -7.5%

Page 2
QUARTERLY COMMENTARY REPORT
PERPETUA INSTITUTIONAL EQUITY | MARCH 2017
CONTRIBUTORS TO AND DETRACTORS FROM PERFORMANCE
Q1 2017
SHARE ATTRIBUTION EFFECT
1.0%
0.5%
0.0%
-0.5%
-1.0%
-1.5%
-2.0%
Chemicals
Media
Industrial Metals
Banks
Mining
Beverages
Forestry & Paper
Household Goods
Real Estate
Automobiles & Parts
Life Insurance
Software & Computer Services
General Financial
General Retailers
Mobile Telecommunications
Travel & Leisure
Food & Drug Retailers
Construction & Materials
Health Care Equipment & Services
SHARE ATTRIBUTION EFFECT
Absolute Return
Top contributors Top detractors
BTI 0.9% -0.8% BGA
TRE 0.6% -0.6% NTC
PPC 0.3% -0.4% SUI
0.0% 0.2% 0.4% 0.6% 0.8% 1.0% 1.2% -1.0% -0.8% -0.6% -0.4% -0.2% 0.0%
Relative Return vs Benchmark
Top contributors Top detractors
TRE -1.9% NPN (U/W)
0.5%
(O/W)
SNH -0.7% BGA (O/W)
0.5%
(U/W) -0.5% NTC (O/W)
PPC
0.3%
(O/W)
0.0% 0.2% 0.4% 0.6% -2.5% -2.0% -1.5% -1.0% -0.5% 0.0%
Page 3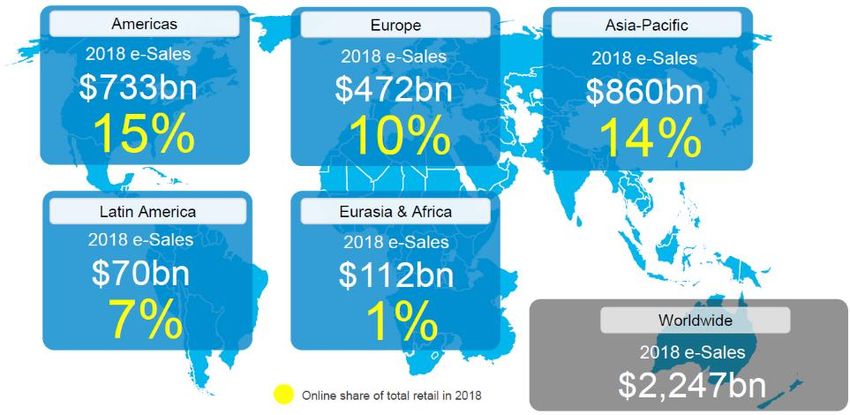
QUARTERLY COMMENTARY REPORT
                                                                    PERPETUA INSTITUTIONAL EQUITY | MARCH 2017

         SECTOR POSITIONING                                        TOP 10 HOLDINGS

                                                          SWIX     Name                             % of Fund
                                                Fund
                                                         (J403)
                                                                   MTN                                 8.0%
         RESOURCES                              23.1% 15.0%
                                                                   Sasol                               7.5%
         Precious Metals                         7.7%     2.9%
                                                                   BAT                                 6.6%
         Diversified Mining                      7.8%     5.3%
                                                                   Woolies                             4.9%
         General Resource⁰                       7.6%     6.8%
                                                                   Old Mutual                          4.6%
         ⁰General Resource includes: Integrated Oil & Gas,
         Speciality Chemicals, Forestry, Paper
                                                                   Standard Bank                       4.4%

                                                                   Barclays Africa                     4.2%
         FINANCIALS                             24.6% 27.4%
                                                                   BHPBilliton                         3.9%
         Banks                                  11.9%     9.3%
                                                                   Anglo-Ashanti                       3.2%
         Life Insurance                          7.9%     5.5%
                                                                   Firstrand                           3.2%
         Property                                2.1%     7.8%

         General Financial*                      2.7%     4.8%

         *General Financial includes: Equity Investment Trusts,
         Speciality Finance, ST Insurers

         INDUSTRIALS                            52.4% 57.5%

         Telecommunications                      8.6%     6.0%

         Retailers                               9.4%     9.1%

         Consumer Goods                          8.1%     9.0%

         Health Care                             8.9%     4.3%

         General Industrial†                    17.4% 29.1%

         †General Industrial includes: Construction, Containers
         and Packaging, Diversified Industrials, Transportation,
         Gambling, Business Support Services, Leisure, Tech

         Total                                  100%      100%

Page 4
QUARTERLY COMMENTARY
                                                                         PERPETUA INSTITUTIONAL EQUITY | MARCH 2017

    QUARTER 1 2017

                                     THIS QUARTER’S COMMENTARY

                                     Delphine Govender
                                     Chief Investment Officer

    The first quarter of 2017 brought with it the usual volatility both in terms of economic, investment and political climate that
    we have come to expect over the past 18 months. It is telling that as investors, and citizens we have come to accept this
    as a fact of life! It is worth pointing out that South Africans are not alone here – across the globe the only constant has
    become the expectation of significant uncertainty.

    The most notable event for South Africans happened on the very last day of the first quarter, 31 March, when South
    African President Zuma announced significant cabinet changes – most critically the firing of the Finance Minister, Pravin
    Gordhan and Deputy Minister of Finance, Mcebisi Jonas. Soon thereafter 2 credit ratings agencies downgraded South
    Africa’s long-term foreign currency risk rating to sub-investment grade, citing increasing state contingent liabilities and
    higher political risk and instability as part of the reason for the downgrades. When ratings agencies cut their ratings on
    the sovereign debt of a country they lower their ratings on the banks in the country at the same time – and this is what
    happened.

    Our portfolio returns lagged this month in absolute and relative terms – for the first time after 4 consecutive quarters. Our
    exposure to banking shares specifically detracted from returns given the events that transpired during the quarter.

    In our commentary this quarter, Bongiwe Beja, client services manager provides the usual performance and market
    review as well as summary of our proxy voting for the quarter (also always available on our website).

    From an investment commentary, portfolio manager Patrick Ntshalintshali opens with our thoughts about the credit
    downgrade and the impact this has on our portfolios and portfolio positioning– given this is topical.

    From a fundamentally-focused standpoint, portfolio manager, Lonwabo Maqubela together with analyst, Mahomed
    Ibrahim have done some interesting research into earnings of South African companies over the long and medium term.
    This is an important component of the expected returns for equities.

    This quarter, sectorally, we have focused on the life insurance sector - where we are finding quite compelling value.
    Lonwabo, Mahomed and analyst, Glen Heinrich have provided our readers with our perspective on how we at Perpetua
    value insurance companies and why we see mispricing in selected counters.

    Analyst, Phomolo Rabana attended the Consumer Analysts Group of Europe (CAGE) conference in London during the
    quarter. At this event he listened to several global consumer companies and his article shares some of the key themes
    emanating from the event.

    The telecommunications industry remains one of the most dynamic in our country and global landscape. Analyst, Bjorn
    Samuels takes a deeper dive at some of the key local trends we need to be aware of as investors and consumers.

    Finally, our closing piece is about one of the newer investments into our portfolio over the past year (while certainly not a
    new company), namely Woolworths. Analyst, Kanyisa Ntontela has put together a summary of elements of our
    investment case and why we have now chosen to invest in the share.

    We hope this commentary gives you a varied and interesting viewpoint about some of Perpetua’s thinking. Please do feel
    free to contact us should you have comments or questions. Our central investment identity as a firm is that of being a
    disciplined value-oriented investor. This identity is our mantle and also our immoveable reference point and during times
    of volatility and uncertainty, it is both comforting and grounding to have such a steadfast and enduring approach.

Page 5
QUARTERLY COMMENTARY
                                                                          PERPETUA INSTITUTIONAL EQUITY | MARCH 2017

                                     OVERVIEW OF MARKET AND SECTOR PERFORMANCE
                                      Bongiwe Beja, Client Services Manager

                                      Despite major political uncertainty in the country that reared its head at the final week of
                                      the quarter, local equity indices ended the month higher with the SWIX and ALSI ending
                                      up 2.2% and 2.7% respectively. Strong returns came from Non-Resource hedges given
                                      the weaker rand by the end of the month. SA Bonds were most impacted by the cabinet
                                      reshuffle announced on the 31st March and lagged equity returns for the month with the
                                      ALBI ending only 0.4% higher while cash delivering its customary monthly return of
                                      0.6%.

                                      For the quarter, local equities have outperformed bonds with the ALSI ending 3.8%
                                      higher vs the ALBI which gained 2.5%.

                                      The asset class and key sector returns for March and Q1 2017 appear below:

                                                             MARCH 2017

         4.2%

                 3.3%     3.2%
                                    2.9%
                                              2.7%
                                                       2.2%
                                                                 1.7%
                                                                           1.5%

                                                                                     0.6%
                                                                                               0.4%     0.2%

                                                                                                                  -0.1%
                                                                                                                            -0.7%
      SA       Top 40    JSE         SA     ALSI     SWIX      JSE Value Capped   CASH      ALBI      Small Cap Mid Cap      SA
   Industrials          Growth    Resources                               SWIX                                            Financials

                                                            QUARTER 1 2017

         6.6%

                 5.0%
                          4.6%
                                    3.9%      3.8%
                                                       3.3%
                                                                 2.7%      2.5%      2.4%
                                                                                               1.9%
                                                                                                        1.2%      1.1%

                                                                                                                            -1.1%
      SA        JSE     Small Cap Top 40   ALSI      SWIX         SA     ALBI     Capped    CASH      JSE Value Mid Cap      SA
   Industrials Growth                                          Resources           SWIX                                   Financials
Page 6
QUARTERLY COMMENTARY
                                                                       PERPETUA INSTITUTIONAL EQUITY | MARCH 2017

   OVERVIEW OF MARKET AND SECTOR PERFORMANCE

   SA Financials were the worst performing sector for the month and ended the month 0.7% lower. This was mainly due to
   the negative performance from sub sectors such as Real Estate Development and Services (down 1.8%), General
   Financials (down 1.5%) and Banks (down 1.4%) Positive returns came from Non-life insurance, mainly Santam (up
   7.3%) and Equity Investments (up 6.0%).

   SA Industrials remained the best performing sector in the quarter and delivered a positive return of 6.6%, followed by
   growth oriented shares and the SA Resources sector which ended the quarter with positive returns of 5.0% and 2.7%
   respectively. Value oriented shares ended the quarter slightly higher with positive returns of 1.2% and SA Financials
   continued to struggle and posted negative returns of 1.1%.

   Equity trading across the sectors in the month of March saw outflows in the Industrials and Resources sectors to the
   value of R14.7 billion and R4.0 billion respectively. The largest foreign selling took place in the index heavy weight
   stock, Naspers (-R4.2 billion for the month and -R10.4 billion for the quarter). Within Resources, foreigners sold off
   Sasol (-R1.3 billion) and Platinum (-R0.3 billion) but continued to be net buyers of Coal stocks (+R1.3 billion). Whilst
   Financials had inflows of R2.0 billion, foreign investors activity within Banks was such that they switched out of Barclays
   (-R2.4 billion) and into Nedbank and FirstRand to the value of R1.4 billion and R0.6 billion respectively.

   Over the quarter, foreigners have been net sellers of SA equities (+R41.0 billion) with the biggest foreign selling
   occurring at in Naspers, Sasol, MTN, Shoprite, Barclays, Bidvest and Mr. Price. Foreigners have bought Exxaro,
   Nedbank, Foschini, Mondi and Discovery stocks significantly over the quarter. The net foreign activity by sector in
   relation to performance for the quarter is shown in the graph below.

                      Figure 1: Net foreign equity transactions vs sector performance: Q1 2017

   Source: FactSet, SBG Securities analysis

Page 7
QUARTERLY COMMENTARY
                                                                      PERPETUA INSTITUTIONAL EQUITY | MARCH 2017

   PORTFOLIO PERFORMANCE FOR THE MONTH AND QUARTER

   For the equities within the Perpetua client portfolios, the non-holding of Naspers was main the detractor of relative
   performance over the month and quarter. Our positioning in select outperforming large and mid-cap shares however have
   resulted in the equities in the fund being ahead of the key equity index benchmarks over a 6 month and 12 month rolling
   period. .
   .

   The key positive contributors to absolute and relative equity returns over the quarter were:
   • The non-holding of Steinhoff (down 9.4%).
   • The exposure to performing stocks such as Trencor (up 39.6%), PPC (up 17.7%) and British American Tobacco (up
      15.7%).

   The key detractors to absolute and relative equity returns over the quarter were:
   • The underweight exposure in Media, in particular our non-holding of Naspers (up 14.9%).
   • The overweight exposure to Banks particularly Barclays Africa Group (down 17.3%) and Standard Bank (down 2.4%).
   • The exposure to underperforming stocks such as Netcare (down 17.8%) and Sun International (down 12.6%)

   Balanced fund performance

   The domestic equities in the Perpetua Balanced Funds detracted from the performance for the month and quarter.
   Considering the recent political events in the country and the weakening rand, the local bonds in the portfolio
   outperformed the ALBI over the quarter.

   In the global balanced portfolios, the global equities in the Perpetua Balanced offering despite having outperformed in the
   month of March, lagged the MSCI All World Index over the quarter. This was mainly due to our exposure to Michael Kors,
   Qualcomm and Gilead.

    QUARTER 1 2017: PROXY VOTING SUMMARY

    “Shareholder activism is not a privilege - it is a right and a responsibility. When we invest in a company, we own
      part of that company and we are partly responsible for how that company progresses. If we believe there is
        something going wrong with the company, then we, as shareholders, must become active and vocal.”
                                                                                                          – Mark Mobius

    Over the quarter, we voted against 14.3% of the 91 resolutions proposed.

    Table 1: Perpetua Proxy Voting for Q1 2017

     FOR                    AGAINST                ABSTAIN                TOTAL
     78                     13                     0                      91

    Most notable resolutions we voted against related to Alexander Forbes (AFH) and Steinhoff International (SNH).

    In the case of AFH, we voted against all four interrelated resolutions proposed as the discount at which the shares were
    going to be issued was in our view too large. Added to this, no rationale was provided by management why the discount was
    so large/the basis of how they arrived at the discount.

    With regard to SNH, we voted against four of the thirteen resolutions proposed as we believed they were not in
    shareholders’ best interests, and exposed shareholders to further dilution as management would be able to limit/exclude
    pre-emption rights.

Page 8
QUARTERLY COMMENTARY
                                                                        PERPETUA INSTITUTIONAL EQUITY | MARCH 2017

    INVESTMENT COMMENTARY

                                      SOVEREIGN CREDIT DOWNGRADE, RISK OF
                                      POLICY SHIFTS AND THEIR POSSIBLE IMPACT ON
                                      OUR PORTFOLIO POSITIONING

                                      Patrick Ntshalintshali, Portfolio Manager

    Background and introduction

    Since the beginning of 2016, there has been an increased expectancy and risk in the market around the possibility of
    sovereign credit ratings downgrade, particularly for the reviews which occurred in June 2016 and in December 2016. This
    was triggered primarily following the “Nenegate” saga when the President of South Africa surprisingly removed the
    Minister of Finance, N. Nene which sparked widespread concern over the country’s stability especially following a sharp
    weakening in the currency and a sharp spike in bond yields.

    However, as 2016 unfolded South Africa managed to survive both sovereign credit ratings reviews in the 2016 year
    without being downgraded to non-investment grade status.

    On the 30th March 2017, President Zuma announced a government cabinet reshuffle which included the firing of a highly
    competent Finance Minister Pravin Gordhan and his deputy Mcebisi Jonas.

    Immediately after this announcement S&P Global Ratings downgraded South Africa's foreign currency sovereign credit
    rating to “BB+” (sub-investment grade or commonly called “junk status”.) They also lowered the long term local currency
    rating to “BBB-” and noted the outlook for both these ratings as negative, which might imply further downgrade at their
    next review.

    Shortly thereafter, Fitch Ratings followed by downgrading South Africa's unsecured foreign-currency and local-currency
    bonds to non-investment grade. Fitch said that its ratings on "South Africa's senior unsecured foreign- and local-currency
    bonds have been downgraded to 'BB+' from 'BBB-'.

    Moody’s, which has the country’s rating two notches above junk status, also indicated they have placed South Africa’s
    credit rating on review for a downgrade. Their final decision will be announced in June 2017.

    The chart below is a rating guide for long and short-term debt by major rating agencies

                                        Figure 1: Rating guide for long and short term debt

         Source: : Moody’s, S&P and
Page 9   Fitch rating agencies
QUARTERLY COMMENTARY
                                                                        PERPETUA INSTITUTIONAL EQUITY | MARCH 2017

    Given the environment we were operating in during 2016, it is worth noting that for the most part of last year, financial
    markets have been pricing a junk status rating (as being implied by credit default swaps spreads) on our debt instruments
    already. It is the timing of the S&P Global’s decision, which came early, that shocked investors the most.

    Stated reasons for the downgrades and reviews

    Both Standard & Poors and Fitch Global cited their concerns that the recent change in government leadership would
    result in policy uncertainty as main reason for the downgrades. They also mentioned that the President’s decision has put
    at risk the country’s fiscal and growth outcomes. Again, the negative outlook reflects a view that political risks will remain
    elevated this year, and policy shifts are likely.

    In Moody’s case, they said that: “Changes within a government do not generally signal material changes in a country’s
    credit profile. However, the timing and scope of the reshuffle raises questions over the signal they send regarding the
    prospects for ongoing reforms‚ the underlying strength of South Africa’s institutional framework‚ and the fragile recovery
    in the country’s economic and fiscal position.” There is now a big chance that Moody’s will also downgrade by one notch.

    How realistic is the expectation/risk of a potential policy shift?

    During the State of the Nation address there was strong call by President Zuma and some of this cabinet members for
    the re-prioritisation of inclusive economic growth initiatives. Most importantly, the increase the impetus for government to
    remove bottlenecks that are preventing the full implementation of the “radical economic transformation” policy. This is an
    agreed ANC policy plan that was in their 2014 national election manifesto, as quote below.

          “The NEC lekgotla accepted that the election victory is a mandate for the ANC to implement the radical
                        economic transformation as decided by the 53rd national conference,”
                                                                                                    Gwede Mantashe

       Asked if the ANC had worked out the specifics of this radical economic transformation, Mantashe replied it was a
      “South African sickness” to spend time on “conceptual clarity. “You can only talk of radical transformation if
                                     you implement radical programmes,” he said.
                                                                                              Daily Maverick – 09 June 2014

    However, this policy action hasn’t gained much traction in the government decision-making machinery to the ANC’s
    frustration. The lack of detail and specifics continues to be a bugbear.

    Recently newly appointed Minister of Finance, Malusi Gigaba has in his maiden address to the media re-affirmed the
    government’s and his Finance departments commitment to seriously driving the implementation of this policy. However,
    again we didn’t hear specific detail on exactly what is entailed in the radical economic transformation policy.

    This has spooked the financial markets. We believe this narrative (and different interpretations) have created confusions
    and speculations more so in a context of its potential impact to the current strict fiscal disciplines and structural
    reforms that are being implemented already. The key concern is whether a stance of radical economic transformation
    would result in a material policy shift. The Finance Ministry refused to share much detail promising to do so at a later
    stage, and that created some form of an overhang.

    We are left with no choice but to wait for more detail before formulating firm views on the potential impacts of radical
    economic transformation on the macro-economic fundamentals. Hopefully this would take place soon.

    What then does a credit downgrade mean for the country and investments?

    In summary, the implications of a credit downgrade in the country would be as follows:
           • South Africa will have to borrow at a higher cost, due to the higher assessed default risk.
           • There would be a diminished ability to invest in productive resources.
           • There would be likely further pressure on the South African currency which has second round inflation effects
               on the economy.
           • Ratings below BBB- (S&P) & Baa3 (Moody’s) would result in SA exiting the World Government Bond Index
               negatively affecting investment flows
Page 10
QUARTERLY COMMENTARY
PERPETUA INSTITUTIONAL EQUITY | MARCH 2017
Perpetua’s portfolio positioning in light of a credit ratings downgrade
As we have previously explained our client portfolios currently have a notable exposure to Banks and Apparel retailers. A
sovereign credit rating downgrade would have a negative impact on these two sectors in the short-term due to their
exposure to:
1. Higher funding costs and possibly tighter credit environment. We have factored this scenario in our forecast
assumptions and valuation.
2. Exposure to interest rates
3. Relatively higher holding by foreign investors who might decide to dump the shares
4. Other indirect implications such as currency depreciation, delayed capital investments, restrictive fiscal policy, etc.
Our current monetary policy view is that:
• SA Interest rates have peaked, as cost push inflation pressures are in the base now with some relief from declining
food inflation and strong Rand now being factored in;
• Interest rate reducing cycle would re-commence in the second half of this year.
A credit downgrade will have a slight damper to this more stable macro outlook in the short term, and this might also
delay the interest rate cutting cycle to next year. Hopefully, as promised by the new Finance Minister, there won’t be
policy shifts that would put growth and fiscal outcomes at risk per the concerns raised by rating agencies.
Our fundamental base case assumptions and forecasts, particularly for Banks and General Retail stocks, are
conservative at the time of investment. They do not factor in a massive SA economic uplift outlook for the next few years.
It is mostly the company specific factors such strategic initiatives, management actions, attractive financial
metrics and cheap valuations that inform our portfolio position in selective Banks and General Retail shares. At
their current market prices, they discount (and are extrapolating) a deteriorating economic environment in South
Africa already.
To mitigate against relative positioning risks in the portfolio, we have a large underweight position in the expensive
Property and Food & Drug Retail sectors. These two sectors are discounting a very positive outlook for the local economy
which we don’t foresee for a while.
CONCLUSION
As a bottom-up, fundamentally driven investment manager, at Perpetua we do not predicate the heart of our investment
decisions on a specific macro or investing environment. While we are aware of the factors affecting the investment
environment we are deploying clients’ funds in, we focus our attention more on elements we believe we have a greater
ability to assess and provide insight on, such as the fundamental construct of a business; the underlying strategy and
business proposition; and importantly a fair valuation. Accordingly, while we remain mindful and knowledgeable on
aspects which affect the investing environment such as the sovereign credit ratings downgrade, we do not premise our
investment decisions on a specific directional outcome on a single factor such as this.
Page 11QUARTERLY COMMENTARY
PERPETUA INSTITUTIONAL EQUITY | MARCH 2017
PUTTING EARNINGS INTO PERSPECTIVE
Lonwabo Maqubela, Portfolio Manager
Mahomed Ibrahim, Analyst
Earnings in perspective
A key part of our jobs as value investors is estimating what a share is worth. This in turn is dependent on earnings or
profits of companies. We therefore spend most of our time focusing on earnings, understanding how companies have
generated them over time and how this is likely to change in future.
In this article, we will look broadly at South African company earnings, including:
• Where earnings have come from recently
• How this compares to a longer term history
• Where we expect earnings to come from in future
Earnings over the past five years
This table shows the top and bottom six sectors by growth in earnings over the past five years:
Table 1: Top and bottom sectors by earnings growth p.a. over the past 5 years
TOP BOTTOM
Clothing retailing 14.8 Telecoms -2.8
Paper 12.7 Industrials -35.0
Banking 12.5 Diversified mining -39.7
Food products 11.6 Construction -43.9
Healthcare 10.9 Coal mining -49.1
Food & Drug retailing 9.1 Precious metal mining -159.0
Source: Bloomberg, Perpetua Research
Earnings in consumer-led sectors such as retailing, food products, property and banking have grown substantially while
broader industrials and mining have shrunk. This ties up with what we see in the economy. It therefore makes sense that
they also appear in the table below showing sales growth over this period:
Table 2: Top and bottom sectors by sales growth p.a. over the past 5 years
TOP BOTTOM
Asset Management 20.8 Industrials 4.5
Property 20.8 Gold mining 4.3
Healthcare 17.4 Telecoms 3.3
Clothing retailer 16.5 Paper 2.6
Food & Drug retailing 12.8 Furniture retailing 0.8
Food products 10.7 Diversified mining -6.2
Source: Bloomberg, Perpetua Research
Page 12QUARTERLY COMMENTARY
PERPETUA INSTITUTIONAL EQUITY | MARCH 2017
For the losers, while poor growth in mining can be explained by weak commodity prices, slow industrial growth is
concerning for our economy. The strong consumer growth has not led to growth in industrials – manufacturing has largely
left South Africa.
Interesting paradoxes are that the paper sector has grown its earnings despite poor sales growth (due to a recovery in
profit margins), while healthcare has not grown its earnings as strongly as it has sales. This shows the importance of
looking beyond sales growth when looking at earnings.
Earning over the long-term:
Taking a step back and looking at the long-term picture of earnings helps put these recent changes in perspective.
The charts below show the long-term earnings for sectors which have underperformed recently and others where we are
finding value:
Figure 1: Long term earnings for sectors which have recently underperformed
There are some interesting observations from these charts:
• Earnings of South African miners are at two-decade lows
• Earnings of life insurers have not grown over the long term
• MTN’s US$1.3bn Nigerian fine has depressed earnings of the Telecoms, Media and IT sector
• Healthcare - traditionally an earnings compounder- has experienced pressure recently.
In our bottom-up analysis at a stock level, we expect that in aggregate over our investment horizon, the earnings from
these sectors will recover. Although the near-term catalysts for this are not clear, valuations are reflecting this.
Page 13QUARTERLY COMMENTARY
PERPETUA INSTITUTIONAL EQUITY | MARCH 2017
These charts show the sectors which have done well:
Figure 2: Long term earnings for sectors which have recently outperformed
Note that:
• Although banks are very exposed to economic growth, they are better businesses than commonly thought. They tend
to grow their earnings over time. The cycles tend to be short and sharp. However, earnings have not grown beyond
their 2008 peak.
• Apparel retailers have had a fantastic period of growth for close to 15 years now. This has been spurred by several
tailwinds such as social grants; growth in the middle class; credit proliferation and more recently acquisitions. Their
high earnings base is concerning.
• Property companies had strong growth from the 2003 base- fuelled by low rates, strong retail sales (which accounts
for half of the sector’s value) ,growing property prices & M&A. Given the extent of space growth and the low growth
economy, this will be difficult to sustain.
• Food and drug retail have also shown excellent growth post 2001.
Where do we expect earnings in future?
By looking at both recent growth and earnings over the long term, the picture for future growth from economic growth is
not promising. Consumer-led growth is unsustainable and our industrial base seems structurally weak. From a long-term
perspective, real earnings in SA have grown at 3% faster than GDP.
While we are cautious for the market as a whole, we are able to find companies whose earnings we expect to grow.
Looking at our company forecasts, the top 20 that are expected to grow the fastest over the next five years have an
average annualised growth rate of 19.3% or around 13% real. This is shown in the table below. We have not disclosed
the actual company names given the proprietary nature of our research, but we have identified what we believe are the
main reasons for their earnings growth:
Page 14QUARTERLY COMMENTARY
PERPETUA INSTITUTIONAL EQUITY | MARCH 2017
Table 3: Earnings growth for Perpetua’s top 20 company forecasts
Earning
Company Reasons for earnings growth
growth p.a.
1 32.5% Mean reversion
2 29.0% Mean reversion
3 19.2% Mean reversion
4 18.0% Mean reversion
5 16.6% Mean reversion
6 12.8% Mean reversion
7 36.0% Organic revenue growth
8 31.6% Organic revenue growth
9 22.1% Organic revenue growth
10 14.4% Organic revenue growth
11 13.7% Acquired revenue growth
12 12.4% Organic revenue growth
13 12.3% Organic revenue growth
14 23.5% Margin expansion
15 19.1% Margin expansion
16 18.2% Margin expansion
18 16.9% Margin expansion
17 14.0% Margin expansion
19 13.8% Margin expansion
20 12.6% Margin expansion
Source: Perpetua Research
The reasons for growth are equally split between mean reversion or recovery, growth in sales and profit margin
improvement.
In turn the mean-reverting companies will recover from an improvement in cyclical factors. The organic growth group
reflect market share gains; geographic expansion and product extensions. There are some that also have a structural
underpin to growth. The margin expansion companies have management teams which are executing on plans to improve
margins and where we think the likelihood of them achieving this is high.
We note that even among the top 20 there is a big difference between the top half and bottom half of the table.
Additionally, there is no single sector that dominates the earnings growth. Given the outlook, we think stock-picking is
going to become even more important over the next five years and are therefore accordingly confident in our ability to add
value to clients’ portfolios during this time.
Page 15QUARTERLY COMMENTARY
PERPETUA INSTITUTIONAL EQUITY | MARCH 2017
LIFE INSURANCE COMPANIES
Lonwabo Maqubela, Portfolio Manager
Glen Heinrich, Analyst
Mahomed Ibrahim, Analyst
Valuing life companies
We are finding value in the Life Insurance sector.
We could write a thesis on understanding life insurers and their accounting practices given elements of their complexity.
Yet, the market tends to over-simplify them and looks at reported earnings and embedded value. Both approaches have
flaws. In this note we set out some of the accounting anomalies and show what current share prices imply for Life
Insurers.
Reported earnings are a poor reflection of value created
There are three key reasons why we caution against relying on reported earnings as a basis for the value created in the
business.
1. Wide range of key assumptions
Life Insurers sell a product that will be consumed over a 30 to 50-year period. To price the product with a view to making
a profit, life insurers need to make a range of assumptions. These include:
• How long policyholders will live to figure out when claims will be paid?
• How many policyholders are likely to cancel their policies?
• The investment return which they will earn on premiums.
• An appropriate discount rate to value future cash flows.
• The expected inflation in administration costs.
2. Choice of accounting policies
Accounting policies add uncertainty to the reported earnings. For example:
• Life companies have the choice to recognise the profit or loss from assumption changes immediately; or over a period
of time.
• Selling a new policy is costly for a life company. Commissions are paid to brokers and there is a great deal of
administration involved in this. This is similar to mining where a considerable sum of capital is spent building a new
mine which will generate profits well into the future. However, in the case of a Life insurer, they have the choice to
either recognise these costs immediately or over a period of time. For those that expense these costs new business
costs immediately, (e.g. Sanlam) the more successful you are in selling new policies the more it hurts initially,
regardless of how profitable the products will be into the future.
3. Market volatility
Finally, a major part of earnings reported by life companies is the investment return on shareholder capital. This number
can be extremely volatile as a significant part of these funds are invested in equities, international assets, bonds and
property assets. The value of these assets therefore fluctuates with the market.
As a consequence of the esoteric nature of these three elements, profits or earnings for life insurers can be volatile from
year to year. Yet, despite this, life insurers’ share prices tend to follow earnings.
Page 16QUARTERLY COMMENTARY
PERPETUA INSTITUTIONAL EQUITY | MARCH 2017
For example, Liberty’s recent results reflect this quite vividly::
Figure 1: Liberty share price and earnings
After the once-off adjustments we identify below, Liberty’s 2016 underlying earnings had actually declined by only 8% ,
and not the reported 40%. These adjustments were
• a R600m charge after changing assumptions about their policyholders’ life expectancy.
• A R600m loss from poor investment returns
How does Perpetua value life insurers?
Recognising the problems with reported earnings, life insurers disclose the value of their own businesses in a calculation
known as Embedded Value (EV). This is the value today of all their future expected cash flows from policies written and in
force.
While this is better than relying on earnings, we believe this EV calculation also has some short-comings:
• It only takes into account the cash flows from all business which has already been written. In other words, it does not
allow for business which the life insurer will write in future. This is penal for fast-growing insurers such Sanlam and
Discovery.
• Some life insurers use more aggressive assumptions than others. For example, Sanlam has consistently generated
more cash than is suggested by its Embedded Value calculation. Sanlam has enjoyed positive experience variances
to the magnitude of 3% p.a. of the disclosed embedded value. This implies that the embedded value is undervalued by
20-30%.
Page 17QUARTERLY COMMENTARY
PERPETUA INSTITUTIONAL EQUITY | MARCH 2017
Figure 2: Sanlam (SLM) Experience variance as % of Life book
6.0%
5.0%
4.0%
3.0%
2.0%
1.0%
0.0%
01 Dec 07
01 Dec 08
01 Dec 09
01 Dec 10
01 Dec 11
01 Dec 12
01 Dec 13
01 Dec 14
01 Dec 15
01 Dec 16
01 Jun 08
01 Jun 09
01 Jun 10
01 Jun 11
01 Jun 12
01 Jun 13
01 Jun 14
01 Jun 15
01 Jun 16
Source: Perpetua research
• Others, for example Discovery use very generous assumptions. For example Discovery’s actuaries assume that its
clients will live longer and will be more loyal than the average client. As a result Discovery’s assumed profitability for
new business is considerably higher than the industry, even when adjusted for product mix
Figure 3: Assumed profitability of new business
NE W BUS I NE S S MARG I NS
7.0%
6.6%
6.4%
6.3%
5.9%
3.2%
3.2%
3.2%
3.1%
2.6%
2.2%
2.1%
2.0%
1.9%
1.9%
1.8%
1.8%
1.8%
1.4%
1.2%
2011 2012 2013 2014 2015
LBH Sanlam MMI DSY
At Perpetua, in valuing life insurers, we choose to use the companies’ Embedded Value calculations as a base and then
adjust these for what we have determined are their “shortcomings” as evident in the disclosures. In particular, we place
emphasis on the cash generated using these disclosures.
Page 18QUARTERLY COMMENTARY
PERPETUA INSTITUTIONAL EQUITY | MARCH 2017
Valuations of life companies today
Because of the market’s obsession with reported earnings, using our method above we are now finding value in the
several companies in the JSE’s life insurance sector. To illustrate how cheap some of these companies are, it is useful to
determine what the market is willing to pay for them – specifically the life assurance component of the business.
In the table below, we strip out our value of these insurers’ non-life businesses and the capital they hold. We then
computed the implied multiple on the cash flows of the life portion of their businesses:
or example, Liberty’s recent results reflect this quite vividly::
Table 1: Implied multiple paid on life cashflowv
(ZAR'm). MMI SLM OML LBH DSY
Market capitalisation less capital & Non-
18,924 48,557 10,800 16,754 46,767
life businesses
Life insurance cashflow 2,617 4,345 3,206 3,757 2,910
Implied multiple on life cashflow 7.2 11.2 3.4 4.5 16.1
Dividend yield 7.1% 4.2% 3.1% 6.9% 1.4%
Source: Perpetua research
While we acknowledge that certain of these companies (specifically LBH and MMI) have low prospects for future growth
and should therefore justifiably trade on lower multiples, however even considering this, these shares are still cheap.
Furthermore, these are supported by high and sustainable dividend yields.
Following Brexit and the sell off in UK listed companies, Old Mutual also stands out as being particularly cheaply valued.
In our estimation we believe investors are effectively not being asked to pay for the life business which is especially
punitive given that we expect the company’s current restructuring plans to directly unlock this value.
Discovery, on the other hand, lies at the more expensive end of this spectrum. In this instance we feel the market is
willing to give the company immediate and considerable upfront benefit for its unique business model and higher new
business growth. However, in our calculations even with far more aggressive assumptions to account for Discovery’s
higher rate of growth versus its peers, we believe the market is being overly optimistic evidenced by the significantly
higher implied valuation.
CONCLUSION
The inherent reporting complexity and the low growth prospects of selected SA listed life
insurers has deterred investor interest. This is amplified when stockmarkets are patchy and the
market gearing return factor is more opaque as is the case at present.
As evident from the valuations, we believe a combination of this factors has resulted in
attractive valuations for most of the companies in the life insurance sector. The current
valuations for Old Mutual and Liberty Holdings we believe are particularly attractive given our
estimations for the sustainable cash flow from these businesses. Accordingly these two
counters are currently holdings in the portfolios. We believe patient investors will be rewarded
time while still earning attractive yields while waiting for the value unlock.
Page 19QUARTERLY COMMENTARY
PERPETUA INSTITUTIONAL EQUITY | MARCH 2017
CONSUMER ANALYST GROUP OF EUROPE
CONFERENCE 2017: KEY TRENDS
Phomolo Rabana, Analyst
Introduction
As the world continues to evolve, so do consumer preferences.
I attended the CAGE conference which took place from 20 – 22 March in London. It certainly helped to highlight how
changing consumer needs are causing organisations to adapt their business models in order to remain relevant.
Over the three days, more than 20 consumer- related companies presented on their growth strategies and operational
capabilities. Although each presentation was specific to the company presenting, two broad themes came up repeatedly:
Ecommerce, and Health & Wellbeing.
Background to CAGE
CAGE is an independent non-profit investment industry association. Their flagship event is this annual investor
conference held in Europe. At the conference, company representatives, typically CEOs and CFOs, from consumer
staples, luxury goods, food retail and foodservice sectors, discuss their companies in front of buy-side and sell-side
analysts. The sessions are interactive with analysts able to ask management further questions during ‘break-out’
sessions, which take place in smaller rooms.
Key themes
Although these themes are not new, what was more apparent was how the thinking around them continues to evolve
from a ‘nice to have’ to an operational imperative. Part of the change has clearly been consumer driven, however, it has
also been company driven as the impact of these consumer shifts have started to affect their ‘bottom-line’, and also
created new market opportunities.
1. Ecommerce
Figure 1: Ecommerce Share of Formal Retail Sales by 2018
Note: In GMV Terms, Amazon, eBay, Alibaba, JD.com, Rakuten well over $1trn
Source: Kantar Retail
Page 20QUARTERLY COMMENTARY
PERPETUA INSTITUTIONAL EQUITY | MARCH 2017
Online retail sales penetration continues to increase, with the Americas, Asia-Pacific, and Europe leading the way. By
2018, online retail sales penetration is expected to account for 15%, 14%, and 10% of total retail sales, in the Americas,
Asia-Pacific, and Europe, respectively (Figure 1). However, all three regions have somewhat different areas of strength,
which is a function of spatial distribtuion, and the companies which have been at the forefront of driving online sales in
their respective markets. For instance, eMarketplace is particullary strong in Asia Pacific, whereas, eGrocery is stronger
in Europe.
In America, Amazon, and the strong growth in Amazon Prime is revolutionising how consumers shop. Amazon Prime is a
membership programme that gives customers access to free shipping, streaming videos, music, e-books, in addition to
other Amazon services and deals. The annual membership fee is $99.
So far what is apparent is that once consumers join Amazon Prime, their shopping behaviour structurally changes.
Consequently, retailers and marketers are a lot more focused on understanding the shopping behaviour of Amazon Prime
members, as they now account for 37% of American households (Figure 2).
Figure 2: % of US Households that are Amazon Prime Members
(Amazon among all primary household shoppers)
2. Health and wellbeing
Globally, the Health and Wellbeing market is expected to be worth $1trn by 2017 (Euromonitor). This global mega trend is
driving the growth in:
• Active Lifestyles,
• Easy convenient, and on-the-go snacks, and
• Clean labelling.
As consumers live more active lifestyles, fitness centres, and nutritional solutions focused on protein enrichment,
nutritional functionality1, and convenience (i.e. ready-to-eat snacks, protein shakes), all stand to benefit.
1 Foods that go beyond basic nutrition, promote optimal health, and help reduce risk of disease.
Page 21QUARTERLY COMMENTARY
PERPETUA INSTITUTIONAL EQUITY | MARCH 2017
Figure 3: Share of Stomach of Snacks (2002-2021)
Global retail sales
Source: : Euromonitor International
Consequently, food producers and the foodservice sector have focused on expanding into healthier snacks, either
organically by for instance launching sugar free variants of their products or acquisitively i.e. Danone acquiring
WhiteWave (produces plant-based foods, beverages, and organic produce).
The continued change in consumer preferences is expected to result in healthier snacks such as yoghurts, and savoury
items accounting for a greater ‘share of stomach’ relative to chocolate and other sugar dominated confectionary items
(Figure 3).
Clean labelling continues to grow as consumers demand greater product content transparency. They not only want
product ingredients to be appropriately displayed on items, they want to know that the products they are consuming
contain only natural ingredients (i.e. natural flavourings, preservatives, fragrances), with no ‘E-numbers’ (typically refers to
artificial food additives), and that those natural ingredients are sustainably sourced.
Consequently, as demand for natural ingredients increases, so does their price. Price spikes in natural ingredients, can
now have a material impact on a company’s cost base, and on its ability to produce the end-product in sufficient quantity.
As a result, food companies are investing a lot more into their supply chain, and this at times even involves entering into
partnerships with farmers in order to ensure the natural ingredients they require are produced in sufficient quantities on an
ongoing basis.
Furthermore, in order to meet consumer preferences, some companies no longer give their livestock antibiotics, and have
removed GMO products from their portfolio. Consequently, as emphasis continues to shift more towards the nutritional
and health aspects of the food we consume, a company’s control over its entire value chain, starting from farm level, is
increasingly being viewed as a source of competitive advantage, and is key in ensuring food sustainability.
Page 22QUARTERLY COMMENTARY
PERPETUA INSTITUTIONAL EQUITY | MARCH 2017
CONCLUSION
The continued growth in Ecommerce and the ‘Health and Wellbeing’ trend plays to the core competencies of many of the
companies that presented at the CAGE conference. As a result, this does present potential investment opportunities.
However, benefiting from a structural tailwind is of itself not sufficient to qualify a company as a good investment. At
Perpetua Investment Managers, this ultimately comes back to the price we are asked to pay for companies that have
exposure to these tailwind. As a result, some of these companies do present better investment opportunities than others.
We have currently focused our research efforts to determine these.
Price is perhaps the single most important criterion in sound investment decision making
Seth Klarman
Page 23QUARTERLY COMMENTARY
PERPETUA INSTITUTIONAL EQUITY | MARCH 2017
TRENDS IN THE LOCAL TELECOMMUNICATIONS
INDUSTRY
Bjorn Samuels, Analyst
Despite exhibiting developed market characteristics in terms of market saturation, the South African telecommunications
industry has typically lagged developed countries in terms of infrastructure and technology and as a result tends to be a
trend follower.
Below I highlight some of the key trends which will shape the future of South African telecoms and while most of these
trends have been in the global spotlight for several years now, increasingly we are beginning to see a more imminent
attempt to integrate or adopt these trends by the local telco incumbents:
1. Fibre
Fibre has been around in South Africa since the mid-80s and only recently gained public attention as fibre providers
expanded its application for commercial use (FTTH and FTTB)1. Aside from the fact that existing copper infrastructure
was purpose-built for voice communication, it has proven its ability to facilitate data communication as exhibited by ADSL
and VDSL2 .
The benefits of fibre optic far supersede the softer issues of higher capital expenditure requirements, possible
inefficiencies due to duplication (caused by a fragmented market) and a compromise on underground infrastructure due
to dug-up pavements across most South African metros.
Benefits:
• Increased bandwidth potential: fibre allows for faster down and up-load speeds as well as lower latency (data transfer
delay).
• Longer distance: the signal for copper degrades as the signal is carried from the central office or exchange, as
depicted in figure 1. Signal through fibre can travel further and is often used for long haul transmission (+50km)
• Long life cycle: Fibre has a 25-30 year life span.
• More reliable: Fibre is more reliable as it is less impacted by weather conditions, water damage and temperature
fluctuation.
• Low risk of theft: Fibre unlike copper is not a commodity and does not have an actively traded market and therefore is
less susceptible to cable theft.
Opportunities:
• Insatiable backhaul demand: Historically the main purpose of fibre has been to facilitate the backhaul portion of
mobile and other networks3. I expect that backhaul will still be one of the main uses of fibre in the future. As mobile
data networks evolve there is an increasing need for densification in order to reduce network contention and improve
speed. As a result a move to 4G and 5G would require at least 4 and 10 times more base stations respectively and by
default would require more fibre optic backhaul.
• Low fixed broadband penetration: South Africa has an approximate 3.2% fixed broad band penetration rate. While
most broadband activity is conducted via mobile networks we anticipate a need for individuals offload data needs on a
fixed network due to its stability; greater capacity (bigger data packages) and relatively lower cost (fixed has a
cheaper price per MB). We anticipate that increased fixed broadband penetration will benefit fibre optic providers
most.
• Consolidation: South Africa has a fragmented fibre market which has a mix of pure-play incumbents (Dark Fibre
Africa, Vumatel, Metro Fibre, etc.) and hybrid incumbents (Vodacom, MTN, etc.). Global trends show us that more
mature markets only have capacity for approximately 4-5 fibre players and as a result we foresee the fibre market
consolidating over the next several years.
1 Fibreto the home (FTTH) and Fibre to the business (FTTB)
2 Asymmetrical digital subscriber line (ADSL) and very high bit rate digital subscriber line (VDSL) refer to bandwidth connection via copper line.
3 Backhaul portion of a network connects sub-networks (MNO base stations, bank branches, etc.) to a core network (a big MNO exchange, bank
head office, etc.)QUARTERLY COMMENTARY
PERPETUA INSTITUTIONAL EQUITY | MARCH 2017
We are very optimistic about the future for local fibre providers and believe ultimate winners in the South African market
will be Openserve (a wholly-owned subsidiary of Telkom Ltd.), Dark Fibre Africa (50.9% owned by Remgro Ltd.) and
Neotel (a wholly-owned subsidiary of Liquid Telecoms Pty Ltd.).
Figure 1: Download speed profile of copper vs. Fibre optic
Source: Perpetua research
2. Customer retention and customer up-sell
Two quarters have passed since the release of the National Integrated ICT Policy White Paper (White Paper) by the
Department of Telecommunication and Postal Services. The White Paper certainly makes reference to a major
transformation of the telecommunications industry in South Africa by proposing shared spectrum and infrastructure. While
uncertainty looms around which proposals in the White Paper will likely be imposed, the proposal of net neutrality has
been embraced by most mobile network operators (MNOs).
Net neutrality seeks to end infrastructure competition in favour of service-based competition. From our interaction with the
management teams of various MNOs recently, we have seen a big emphasis on reduced churn (customer retention) and
existing customer up-sell especially with regards to high value customers.
Market giants (Vodacom and MTN) have come to the realisation that infrastructure will no longer be a sustainable
competitive advantage in the future South African mobile landscape and have placed a big focus on improved customer
satisfaction and retention.
At the recent bi-annual Technology, Media and Telecommunications conference hosted by UBS the Chief Consumer
Officer of MTN South Africa, Larry Annetts highlighted the strength of MTN within the pre-paid market but showcased its
weakness within the post-paid market.
Page 25QUARTERLY COMMENTARY
PERPETUA INSTITUTIONAL EQUITY | MARCH 2017
Figure 2: The 80/20 rule at MTN Based on the “80/20 rule”4 depicted in figure 2, Annetts emphasized
the need to attract and retain high value customers as a means to gain
post-paid market share. Customer retention and up-sell strategies for
MTN SA include: reduced query response time; introduction of month-
to-month contracts and early upgrade rules for high value customers.
Other MNOs have also employed various retention and up-selling
strategies.
Telkom Mobile has introduced customer service incentives whereby
employees can boost monthly salaries by up to 12% by meeting
certain customer service targets. Cell C has introduced various
partnerships with over-the-top service providers (data-free Facebook;
Whatsapp data bundle, etc.) and Vodacom has introduced “Vodacom
Red” packages which offer an enhanced service level to customers
who are willing to pay premium on standard post-paid plans (additional
Source: UBS 2017 TMT presentation by MTN services include: call centre priority, shorter in-store queues, loan cell
phones, exclusive voice and data packages, etc.)
By improving focus on customer retention and customer-upsell, we believe that all MNOs can benefit from reduced churn
and higher ARPUs5.
3. Internet of Things
The Internet of Things (IoT) is the internetworking of physical devices, vehicles, buildings and other items which are
embedded with electronics, sensors, software and network connectivity that enable these objects to collect and exchange
data.
The concept of IoT has been around for several years now and there are many practical examples - the most notable and
commercialised example is that of the Amazon Dash Button which is available for multiple FMCG items (toothpaste,
washing powder, soft drinks, etc.). Figure 3 provides a visual representation of the process behind the Dash - ultimately
once the button is pressed items are automatically added to your Amazon shopping basket and shipped to your address.
Figure 3: How Amazon Dash Button works
Source: Amazon Web Services web site
The global IoT market is expected to be between 20 and 50 million devices by 2020. IoT is the next potential growth lever
for local MNOs, Figure 4 shows that South Africa is expected to have between 170 and 420 million devices by 2020.
4A generalisation that approximately 20% of customers make up 80% of revenues.
5 ARPU - Average Revenue Per User
Page 26QUARTERLY COMMENTARY
PERPETUA INSTITUTIONAL EQUITY | MARCH 2017
Figure 4: Forecasted IoT device growth (in millions)
Source: UBS 2017 TMT presentation by Dark Fibre Africa
The IoT functionality for South African incumbents like MTN and Vodacom currently include machine-to-machine (M2M)
communication sim cards such as those preinstalled in most cars (SOS functionality) and a very basic IoT application
through back up connectivity for telematics providers (car tracker services and fleet management). Over time we believe
that MTN and Vodacom will expand functionality and fully monetize IoT services, but unfortunately will not be the leaders
in the local IoT industry.
SquidNet (a Dark Fibre Africa subsidiary) is in the process of deploying an IoT network in partnership with one of the
world’s largest IoT networks, Sigfox. SquidNet will deploy and operate Sigfox’s network in South Africa over the next 18
months. Squidnet targets applications across all vertical markets including asset tracking, predictive maintenance,
logistics, etc. and plans to do all of this on an open-access basis.
Through Sigfox, SquidNet is able to operate the network on an unlicensed spectrum band (868MHz) known as “Ultra-
narrow band” and has access to IoT devices which are nearly 12 times cheaper than the devices used by most MNOs
(given that these devices work on low radio frequency and do not require SIM card capabilities). We believe that the low
cost offering and open access network of SquidNet will make it a leader in the future South African IoT industry.
CONCLUSION
South Africa is a good 4-5 years behind most major developed markets as far as the adoption of telecommunication and
technological trends are concerned. While the telco incumbents in more developed markets focus on the roll-out of 5G
networks and enhanced content offerings, we look past global trends currently being implemented and anticipate which
local players will benefit the most.
Given the aforementioned trends in the telecommunication industry and where we find value based on current market
valuations, we believe that MTN (given its renewed focus on South Africa in terms of high value customer retention and
improved network infrastructure) and Remgro (given its 50.9% stake in Dark Fibre Africa) are our most attractive telco
industry picks.
Page 27QUARTERLY COMMENTARY
PERPETUA INSTITUTIONAL EQUITY | MARCH 2017
WOOLWORTHS HOLDINGS: OUR INVESTMENT CASE
Kanyisa Ntontela, Analyst
The backdrop
Woolworths is a well-known South African food and clothing retailer. It also has clothing and department store operations
in Australia through the Country Road and David Jones formats.
Woolworths operates in a relatively cyclical industry but its upper income client base gives it an advantage relative to its
peers. The company has delivered 20% CAGR on earnings for the past 15 years, 30+% ROEs and has a management
team which saw an opportunity to expand in speciality food in South Africa and an opportunity for expansion and
diversification into Australia.
Despite the solid operational performance particularly over the past 5-7 years, over the more recent past the Woolworths
share price has underperformed the market quite sharply.
The fall from grace: why is the market punishing the share?
Figure 1: Woolworths: Price vs. EPS Figure 2: Woolworths: PE falling to 15x from 28x peaks
Source: Inet
Historic rating reflects:
1. Resilience of the consumer – consistent revenue growth
2. The success and growth of the SA food business
3. The turn-around in clothing
4. The sale and unlock of the debtors book
5. Success in Australia through recovery and improved performance of Country Road Group
6. Acquisition of an Australian department store (David Jones)
Current rating reflects:
1. Consumers in South Africa and Australia are under pressure
2. Promotional activity will remain in the system in South Africa and Australia for another 12 months
3. Re-investment in price for Woolworths South Africa will result in margin pressure
4. There is competition from internationals and a resuscitation of a sleeping giant (Edcon) which will put further
pressure on the SA clothing & general merchandise
5. Woolworths is yet to deliver on the David Jones synergies that they promised the market at the time of the
acquisitionYou can also read