Assessing the Ecological Impact of Ultramarathon Events in Protected Natural Sites: 'Le Grand Raid Réunion' - MDPI
←
→
Page content transcription
If your browser does not render page correctly, please read the page content below
heritage

Article
Assessing the Ecological Impact of Ultramarathon
Events in Protected Natural Sites:
‘Le Grand Raid Réunion’
Sandra Heck
 Institute of Sport Science, University of Koblenz-Landau, Universitaetsstr. 1, 56070 Koblenz, Germany;
 sandraheck@uni-koblenz.de

 Received: 22 January 2019; Accepted: 14 February 2019; Published: 21 February 2019

 Abstract: Outdoor sport events evidently have an impact on the environment. If they are taking
 place in naturally protected areas this impact is even greater. By taking ’Le Grand Raid Réunion’,
 an international ultramarathon annually organized in the heart of an UNESCO World Natural
 Heritage site, as a case study, this paper concentrates on assessing the ecological impact of an outdoor
 sports event in a protected natural site. On the basis of datasets taken from official logistics lists and
 from a survey conducted among all event participants the analysis embraces ecological and carbon
 event footprinting. Measuring those two indicators allows identifying the specific event-related
 ecological impacts, including diverse variables caused by the athletes, the spectators, and the related
 organizational requirements. The results of the study thereby have the ability to strongly influence
 the future event policy and to function as a model for the assessment of the ecological impact of other
 outdoor sports events.

 Keywords: ecological impact; event management; footprint; UNESCO world heritage; nature sports;
 outdoor sports

1. Introduction
     Almost 5000 athletes running three days long through a naturally protected area:
environmentalists might argue that this is unportable. It happens though each year anew in the
frame of the ultramarathon race ‘Grand Raid’, the most popular sporting event of the French overseas
department of Reunion Island. The ‘Grand Raid’ is also called ‘Diagonale des Fous’ (madmen’s
diagonal) and was inaugurated as early as in 1989, at a time when nature conservation ideas already
existed [1] (pp. 18–32): Greenpeace, for instance, was already founded 18 years earlier, and UNESCO
assigned its first list of world heritage sites at the end of the 1970s [2,3]. Those first initiatives did,
however, not lead to strict consequences in the event management as is increasingly the case nowadays.
In the 21st century, the interest in the wider consequences of sporting events has generally increased.
In 2010, for instance, the United Nations Environment Programme explicitly discussed the impact of
large sporting events [4]. The International Olympic Committee (IOC) has early recognized the signs
of the time and regularly since 1995 has organized the biennial ‘World Conference on Sport and the
Environment’ [5]. No possible host city for the Olympic Games like for other mega sporting events,
too, can nowadays apply without an elaborated concept of sustainable event organization.
     What is true for large international sporting events is not yet the case for smaller contests which
are less in the focus of media attention and pressure but also have fewer financial capacities to adapt
to ecological regulations. Ecological consequences of event organization and certain aims to reduce
them—partly enforced by regional authorities—remain and contribute to a positive image of the
event. Thus, the organizers of ’Le Grand Raid’ include regulations to punish polluting participants

Heritage 2019, 2, 749–760; doi:10.3390/heritage2010048                          www.mdpi.com/journal/heritage
Heritage 2019, 2 750
and explicitly point at their sporting event as ecologically ‘clean’ [6]. Their environmental policy has,
however, not been analysed yet. Whereas it might seem that the importance of studying comparably
smaller events (with a globally seen lower ecological impact) is lower than those which attract an
audience of several million people, one must not forget that events like the ‘Grand Raid’ are generally
followed by the same ecological impacts as big events and might even result in higher per person
impacts. Moreover, parallel to the main race, the ‘Diagonale des Fous’ is run which features a 163 km
length and an elevation gain of 9920 m. In 2013, two smaller mountain races took place which partly
used the same terrain and thereby further increased the impact: ‘Le Trail de Bourbon’ with 93 km and
an elevation gain of 5200 m and ‘La Mascareignes’ with 67 km and an elevation gain of 4000 m. As the
participants in the three sub-races of the ‘Grand Raid’—the name ‘Grand Raid’ includes from here on,
if not expressed differently, all three presented mountain races—run through a National Park which
has had UNESCO World Heritage status since 2010. The sensitivity and thus the threat to nature is
comparatively even greater than for other events. Athletes, spectators, and the related organizational
requirements—rubbish, air pollution, energy and water consumption, etc.—do not remain without
ecological consequences in this vulnerable region.
Therefore, this study concentrates on analysing the ecological impact of the 21st edition of ’Le
Grand Raid’ that took place on 17–20 October 2013. It evaluates the current organization of the event
from an ecological perspective, provides insights into the quality of the current environmental policies
of an outdoor sports event by measuring the ecological and the carbon footprint of the event and points
at possible areas for improvement in the future. By taking ’Le Grand Raid Réunion’ as a case study
furthermore the particular impact of event organizations in protected natural sites is demonstrated.
As a consequence of the contemporary popularity of sustainable event concepts, scholars—mainly
from the fields of ecology, geography, management, and sport science—increasingly deal with
the subject of environmentally-friendly event organization. Several studies have already been
conducted on the organization of major sporting events like the Olympic Games or the Football
World Cup: many concentrate on economic issues [7,8]; some also include ecological impacts [9–11]
and historical elements [12]. Coming back to the regional focus of this study, scholars have already
researched the ‘Grand Raid Réunion’—from a historical, sociological, training, or physiological point
of view [13–21]—but until now none of them explicitly focused on measuring the impact of the
event and thereby evaluating the quality of the current environmental policy. To date also only few
studies on the regional environmental policy of Reunion Island or other Indian Ocean Regions exist,
and they consequently neglect sporting events [22,23]. It is moreover striking that the majority of
studies on Reunion Island, its environment, and its sporting culture are only available in French
language—the book entitled “The Uplands of Reunion Island: Where Tradition Meets the Future”,
edited by Jean-Michel Jauze [18], represents an exception—even though the results of those works
might also be of interest in non-French-speaking countries. It can only be assumed that the geographic
distance and the French (and Creole) language skills needed to conduct a study on-site have hindered
non-French scholars in selecting regional case studies. Thus, this project aims to assess and present the
ecological impact of ‘Le Grand Raid Réunion’ to an international readership, thereby pioneering an
analysis of the region as a suitable research objective in event-related ecological studies.
2. Materials and Methods
2.1. Study Area: Reunion Island
Reunion Island, French overseas department, and southernmost part of Europe, is located in the
Indian Ocean, around 700 km to the east of Madagascar, and embraces around 2507 km2 . The island is
home to many endemic plants and thus especially vulnerable and worthy of protection. The study
area covers large parts of this island as the event which is in the focus of this research crosses the
island from south to north. The heart of the island is a National Park nominated by UNESCO as World
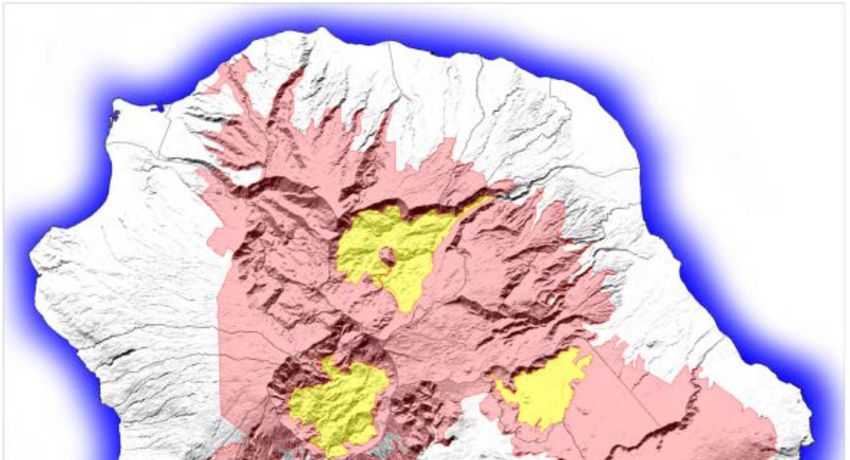
Natural Heritage site in 2010 and concerns more than 40 % of the area [24] (cp. Figure 1).
Heritage 2019, 2                                                                                                              751
      Heritage 2019, 2                                                                                                  751

            Figure 1. Map of the property of Reunion Island inscribed as UNESCO World Heritage in 2010.
      Figure 1. Map
          Source:    of the property of Reunion Island inscribed as UNESCO World Heritage in 2010. Source: [25].
                  [25].

      2.2. Using
2.2. Using       Footprinting
            Footprinting      to Measure
                           to Measure    EcologicalImpact.
                                       Ecological   Impact.
            Everyday life but also events leave a footprint behind them. Thus, human behaviour is resulting
      Everyday life but also events leave a footprint behind them. Thus, human behaviour is resulting
      in a specific ecological footprint which correlates with the specific biocapacity of the region or
in a specific ecological footprint which correlates with the specific biocapacity of the region or
      country. The non-profit organization Global Footprint Network explains that the footprint varies
country.
      “withThe     non-profitand
              consumption         organization      Global Footprint
                                     production efficiency”                  Network explains
                                                                 and the biocapacity                 that themanagement,
                                                                                          “with ecosystem        footprint varies
“withagricultural
        consumption        and    production     efficiency”     and   the   biocapacity     “with   ecosystem
                      practices (such as fertilizer use and irrigation), ecosystem degradation, and weather,        management,
                                                                                                                          and
agricultural
      populationpractices    (such as fertilizer use and irrigation), ecosystem degradation, and weather, and
                     size” [26].
population How size”can[26].
                          effectiveness with respect to an ecologically sustainable event organization be
      measured?
      How            There is not one
             can effectiveness      withclear proven
                                          respect       way.
                                                    to an      Among thesustainable
                                                            ecologically       concepts to event
                                                                                             evaluate  the event impact
                                                                                                   organization            the
                                                                                                                    be measured?
      ecological    footprint   has, however,    emerged      to one   of  the  most  successful
There is not one clear proven way. Among the concepts to evaluate the event impact the ecological  indicators   [27–29].  It is
      internationally    used    by a variety  of  institutions   for  the  evaluation   of  ecological
footprint has, however, emerged to one of the most successful indicators [27–29]. It is internationally   impacts  of human
      activities [30,28] and has already demonstrated to be a “valuable tool from which to assess the
used by a variety of institutions for the evaluation of ecological impacts of human activities [28,30] and
      environmental impacts of major sporting events” [9]. The method “calculates the area, which nature
has already demonstrated to be a “valuable tool from which to assess the environmental impacts of
      would require for renewing the resources and absorbing the wastes which human beings have
majorconsumed
        sporting [...]”
                    events”    [9]. The method
                          (all translations         “calculates
                                             are mine);   [31] andthe canarea,
                                                                            also which
                                                                                 be usednature
                                                                                          as “anwould       require for tool”
                                                                                                   awareness-raising     renewing
the resources
      [9].        and absorbing the wastes which human beings have consumed [...]” (all translations are
mine); [31]   and canfootprinting
           Ecological     also be used  wasas originally
                                              “an awareness-raising
                                                           introduced by Mathistool” [9].
                                                                                      Wackernagel and William Rees in
      Ecological
      1996 as “thefootprinting
                       land and water wasarea
                                            originally    introduced
                                                that is required            by Mathis
                                                                    to support           Wackernagel
                                                                                   indefinitely            and William
                                                                                                 the material    standard Rees
                                                                                                                             of in
      living  of a given   human    population,   using  prevailing     technology”    [32]. Over
1996 as “the land and water area that is required to support indefinitely the material standard of the  years, the definition
livinghas
        of not   significantly
           a given                changed but using
                       human population,         includes    the termtechnology”
                                                         prevailing       ‘consumption’     which
                                                                                         [32]. Over stronger   emphasis
                                                                                                       the years,          the
                                                                                                                    the definition
      human impact. Best Foot Forward (Anthesis Group), for instance, defines an event-related ecological
has not significantly changed but includes the term ‘consumption’ which stronger emphasis the
      footprint as a method that enables to prove the dependence of the event on resources by measuring
human impact. Best Foot Forward (Anthesis Group), for instance, defines an event-related ecological
      “the bioproductive area (land and sea) required to sustainably maintain current consumption” [33].
footprint   as a method that enables to prove the dependence of the event on resources by measuring
      The ecological footprint is measured in global hectares with one global hectare being “equivalent to
“the bioproductive        area (landproductive
      one hectare of biologically       and sea) required
                                                     space with  toworld
                                                                    sustainably
                                                                             averagemaintain      current
                                                                                      productivity”     [34].consumption”
                                                                                                              Globally, there [33].
The ecological footprint is measured in global hectares with one global hectare being “equivalent to
one hectare of biologically productive space with world average productivity” [34]. Globally, there is
an ‘ecological overshoot’, meaning that today the equivalent of 1.5 planets is needed to provide the
Heritage 2019, 2                                                                                      752

used resources and to absorb the produced waste. In other words: For the regeneration of what is used
in a year the Earth today requires one year and six months [35].
      According to the World Wide Fund for Nature (WWF) the available global ecological biocapacity
is currently 1.8 gha per person or 2.0 billion gha in total which contrasts with humanity’s estimated
ecological footprint of 2.7 gha per person or 18.2 billion gha (all based on calculations in 2008) [36].
The per-person demand and the biocapacity for the world between 1961 and 2010 demonstrate that
the global ecological overshoot is continuously increasing since the late 1960s. In the coming years
and decades, this negative trend is supposed to continue. When resources are quicker turned into
waste than waste can be turned back into resources finally the resources on which human life and
biodiversity depend are depleted. This makes footprint calculations an essential part of demonstrating
human impact and working out aspects of possible improvement.
      Besides the ecological footprint, the carbon footprint, the CO2 -emissions resulting from the event,
can also be measured. The carbon footprint is widely used in literature and for instance defined
as “the total set of greenhouse gas (GHG) emissions caused directly or indirectly by an individual,
organization, event or product” [37,38]. So why is it helpful to calculate two different footprints?
      Both the ecological and the carbon footprint deal with resource usage. The ecological footprint
concentrates on resources which are consumed and compares them with the land and water area
needed to replace them [39]. The carbon footprint in contrast centres on the greenhouse gases emitted
into the atmosphere and does not refer to the biocapacity. It is primarily used to increase awareness
of climate change and measured in units of carbon or carbon dioxide equivalents [40,41]. With their
specific foci, both footprints complement one another and help to “illustrate the impact of human
activity on the environment” [42]. They help to understand the ecological impact of events in general
and in relation to specific event factors.

2.3. Assessing the Ecological Impact of Outdoor Events
     For the retrospective measurement of footprints related to companies, products, and services
already standards and guidelines exist but “there is currently no universally agreed approach to
measure the footprint of an event” [42]. When searching a tool to calculate the ‘ecological footprint’
diverse sustainability consultants offer their products. For my purposes, an ex-post event analysis in
the Indian Ocean Region, the Footprint Reporter™ of the Anthesis Group (event version) seemed best
adequate. It is though partly UK-based but allowed a transfer to other regions and has, for instance,
also been involved in the assessment of large sporting events like the Olympic Games in London in
2012 or the bid of Chicago for the 2016 Olympic Games. Both the ecological and the carbon footprint
could be measured while including diverse emission sources and up-to-date factors. It thereby offered
a suitable accounting and reporting tool.
     The analysis focused on emissions sources which were expected to have a high ecological
burden on the event: travel, accommodation, freight transport, energy consumption, accommodation,
merchandising, and catering. The footprint calculation embraced the impact of different groups of
people involved in the race: the runners, the organizers, the volunteers and the spectators. Concerning
the carbon footprint, different emissions-generating activities were investigated depending on the
specific organizational, and operational boundaries. For the use in the Calculator of the Footprint
Reporter™, ecological impacts were generally ‘aggregated into commonly used components’ [43].
Within those common accounting categories, single items were again grouped by type (represented by
icons) which made an assignment easier. Not all of the numerous criteria which were offered could
be used; a choice had to be made. The boundaries were selected so as to include only those elements
over which reliable data existed. Datasets taken from official logistics lists, from a survey conducted
among all participants and from interviews were formatted to allow for integration into the Footprint
Reporter™ tool. There, to each item a specific carbon dioxide or global hectare value was allocated to
allow measuring the footprints.
Heritage 2019, 2                                                                                        753

     As the Footprint Reporter™ is a web-based application, all data could be recorded, saved and
viewed online (after login). The calculations are generally based on conversion factors which are used
to convert physical quantities into footprint values [42] and are frequently updated, for instance when
the Department for Environment, Food and Rural Affairs (DEFRA) publishes new transport und utility
factors [44]. The UK DEFRA factors are particular to the European context, but can also be transferred
to other geographical regions. The results of all presented categories could finally be viewed as ‘EF
(gha)’, the ecological footprint in global hectares, or in ‘CO2 ’ (tonnes), the carbon footprint, either for
the total event or for single of the categories or items.

2.4. Sources of Data
     The calculation of the carbon and ecological footprint required a rich set of high quality
consumption data, possibly with information on the accommodation of the mentioned parties during
the race, assets, travel kilometres, consumables, food and drink, freight transport, and utilities. At the
same time, it proved the complexity of events and of their resulting impacts on nature. As these data
were not automatically widely documented in the case of the ‘Grand Raid’—like it is nowadays the
case for big (sporting) events—and moreover partly incomplete, several requests and expert interviews
with the responsible authorities were necessary. Additionally, empirical data had to be collected
through an online survey diffused among the participants of the three races.
     Among the interviewees were the president of the Association Grand Raid, Robert Chicaud,
and the responsible for the logistics, Jean-Marie Payet. Their answers not only provided data for
the calculations of the ecological and carbon footprint but also gave useful background information.
The online survey was conducted with the help of the software SoSci Survey which was specifically
developed for scientific studies. The advantages and disadvantages of online surveys will not be
widely discussed here [45–47], but with regard to the limited time for the creation and evaluation
of the questionnaire, the choice of an online survey had many advantages, like, for instance, the
possibility to directly upload the results including the labels into the statistic programme SPSS without
the need of encoding each variable individually afterwards. SoSci Survey allowed the creation of
a particular layout, partly requiring some basic knowledge in programming, the conduction of a
pre-test to eliminate basic faults as well as features like response time measuring and multi-language
surveys (in this case French and English). The survey embraced 17 questions on 13 pages (including
the introductory page) resulting in 307 variables. For the evaluation of the data the software IBM SPSS
Statistics 22, one of the leading tools for statistical analyses, was used. The unit of observation to which
the survey was addressed to were all runners who took part in one of the three mountain races in
2013 (N=4718). 1212 (26 %) finally participated in the survey and 972 (21 %) have completed the data
records until the last page (no duplicate records could be found).

3. Results

Event Footprinting: Factor Analyses
     The total carbon dioxide emissions of the event encompass 14,433,233 tonnes, the total ecological
footprint 4,981,782 global hectares. For both the carbon and the ecological footprint, ‘audience travel’
had the greatest impact (64/54.3 %) of all categories (cp. Figures 2 and 3). This was followed by
the category ‘accommodation’ which likewise concerned spectators and additionally runners and
thereafter by ‘staff & performer travel’. The impact of the sections ‘assets’, ‘consumables’, and ‘food and
drink’ respectively remained under 1 %; ‘freight transport’ and ‘utilities’ were respectively accounted
with 0%, as they made less than 0.1 % of the total footprint.
Heritage 2019, 2 754
Heritage 2019, 2 754
Heritage 2019, 2 754
Figure 2. Carbon footprint (in CO2 tonnes) of the total event.
Source: own calculation with the help of the Footprint Reporter™/Anthesis Group).
Figure 2. Carbon footprint (in CO
Figure 2 tonnes)
2. Carbon of the total
footprint event.tonnes)
(in CO2 Source:ofown calculation
the total event. with the help of
the FootprintSource:
Reporter™/Anthesis
own calculationGroup).
with the help of the Footprint Reporter™/Anthesis Group).
Figure 3. Ecological footprint (in global hectares) of the total event.
Source: own calculation with the help of the Footprint Reporter™/Anthesis Group.
Figure 3. Ecological footprint (in global hectares) of the total event.
Figure 3. Ecological footprint (in global hectares) of the total event. Source: own calculation with the
4. Discussion.Source: own calculation with the help of the Footprint Reporter™/Anthesis Group.
help of the Footprint Reporter™/Anthesis Group.
4. Discussion.
4.1. International Comparisons to the Carbon Footprint Results
4. Discussion.
The 14,433,233 tonnes of carbon dioxide which have been directly and indirectly caused by the
4.1. International Comparisons to the Carbon Footprint Results
4.1.organization
International of Comparisons
the ‘GrandtoRaid the Carbon
2013’ Footprint Resultsbut only constitute a negligibly small part of
are impressive
the The 14,433,233
average yearly tonnes
world of2-production
carbon dioxide which have been (million
directly and indirectly caused by the
The 14,433,233 tonnes ofCOcarbon dioxidewhich
whichwas have 31,387
been Mt directly andtonnes)
indirectlyin 2010caused[48]byor the
of the
organization
emissions of of the ‘Grand Raid 2013’ are impressive but only constitute a negligibly small part of
organization of whole FranceRaid
the ‘Grand which were
2013’ are361,273,000
impressivetCO but2 in theconstitute
only same year a[49]. With regard
negligibly smalltopart
Reunion
of
the average yearly world CO -production which was 31,387 Mt (million tonnes) in 2010 [48] or of the
theIsland, the eventworldproduced around 0.331 % of was
the yearly
31,387carbon dioxide emissions (4 [48]
367 000
or oftCO
the2 in
2
average yearly CO2 -production which Mt (million tonnes) in 2010
emissions
2010). At aoffirst
whole France
glance thiswhich
seems were
not 361,273,000
much, also tCO
not in the
2 in same yearto[49].
comparison big With regard to sporting
international Reunion
emissions of whole France which were 361,273,000 tCO2 in the same year [49]. With regard to Reunion
Island, like
events the event produced
theproduced
Olympic around
Games in 0.331
London % of the with
2012 yearly ancarbon dioxide
estimated emissions
actual footprint (4 3673.3 000MtCO
tCO2 2in
Island, the event around 0.331 % of the yearly carbon dioxide emissions (4 367 of 000 tCO 2 in
e
2010). Attonnes
(million a firstofglance
carbon this seems
dioxide not much, [50].
equivalents) also not in comparison to big international sporting
2010). At a first glance this seems not much, also not in comparison to big international sporting events
events like comparing
the Olympic Games
carbonin London of 2012 with an Raid’
estimated actual footprint of 3.3has MtCO 2e
like the When
Olympic Games in theLondon footprint
2012 with an the ‘Grand
estimated to other
actual footprint events,
of 3.3 MtCOit though2 e (million
to be
(million
taken tonnes of carbon dioxide equivalents) [50].
tonnes of into
carbon consideration that the [50].
dioxide equivalents) footprint measurements around big sporting events like the
OlympicWhen comparing
Games allow the carbon footprint of
pre-event-reductions due theto‘Grand
early Raid’ to other events,
recommendations and it though
are generally has to be
When comparing the carbon footprint of the ‘Grand Raid’ to other events, it though has to much
be
taken
wider into consideration that the footprint measurements around big sporting events like the
taken intoand detailed inthat
consideration their
theframe,
footprint conducted
measurementsby bigaround
research bigteams andevents
sporting embracinglike the several
Olympic years
Olympic Games allow pre-event-reductions due to early recommendations
already before the start of the event. For instance, the footprint of the 2012 London Olympic Games and are generally much
wider and detailed
additionally included in impacts
their frame, of theconducted by big merchandise
sale of official research teams andand
foodembracing
franchises several
and manyyears
already before the start of the event. For instance, the footprint of the 2012 London Olympic Games
additionally included impacts of the sale of official merchandise and food franchises and manyHeritage 2019, 2 755
Games allow pre-event-reductions due to early recommendations and are generally much wider and
detailed in their frame, conducted by big research teams and embracing several years already before
the start of the event. For instance, the footprint of the 2012 London Olympic Games additionally
included impacts of the sale of official merchandise and food franchises and many emissions which the
organizers were not directly responsible for [42]. Furthermore, for the ‘Grand Raid’ no construction
of venues and other buildings had to be conducted which positively influenced its CO2 balance in
comparison to the London Olympics where the Olympic Park and Village made with 65% (1219
ktCO2 (kilotons CO2 )) the largest emission sources for which the organizers were directly responsible.
The two sporting events have in common a high impact of spectators’ air travel to watch the event [39].
Another example is the 2014 Soccer World Championships in Brazil which are comparatively expected
to generate over 2.7 MtCO2 e including, similarly to the Olympic Games, the whole time of preparation
and the staging of both the FIFA Confederations Cup and the World Cup [51]. Four years earlier, the
estimated carbon impact of the 2010 FIFA World Cup in South Africa was already estimated to have
the largest emissions of any international sporting event in history with a carbon footprint of 2,753,250
tCO2 e [52,53]. In this case the high result was explained by the long-haul location which is likewise
the case for the ‘Grand Raid’ (even though the number of spectators was much lower).
As every event is different and every footprint calculation has other boundaries, comparisons
remain difficult and therefore rare, if not conducted by the same team using exactly the same frame.
This is likewise true for the results of the ecological footprint where the CO2 emissions are generally
incorporated but expressed in global hectares.
4.2. International Comparisons to the Ecological Footprint Results
The 4,981,782 global hectares calculated for the 2013 edition of the ‘Grand Raid’ are only an
abstract figure at a first glance. Compared, for instance, to the results of the ecological footprint of the
2004 ‘UK’s Football Association (FA) Cup Final’ which resulted in a total footprint of 3083 gha [9,54]
or to the UK Stages of the 2007 ‘Tour de France’ with a footprint of 57,990 gha [55,56] the results can
be slightly easier categorized. However, also here a comparison is complicated and often misleading
because both the ‘FA Cup Final’ and the ‘Tour de France’ study are concentrating on visitors’ footprint
only and moreover on the impact per visitor and day. To be able to compare the results at least
the consumption categories of those two studies need to be equalled with those of the ‘Grand Raid’
analysis, as, for instance, in the ‘FA Cup Final’ research accommodation was not considered but
venue construction was. As the ‘Tour de France’ study, moreover, was conducted six years earlier,
results might differ due to the different years; it can, however, be expected that the struggle towards a
continuous improvement in sustainable event organization and thereby in green marketing has in the
meantime continued for both and even increased with the popularity of greening the events.
In both the ‘Tour de France’ and the ‘Grand Raid’ studies, travel by air (international) had a huge
impact [55]. Whereas the total visitor travel generated an estimated ecological footprint of 43,719 gha
for the Grand Depart of the ‘Tour de France’ (6–8 July 2007), for the ‘Grand Raid’ (17–20 October 2013)
only 2706 gha were calculated (cp. Table 1). These figures are, however, again relative and have to be
interpreted carefully, as they are based on different spectator numbers: Transport for London estimated
2.85 million spectators for those first three days of the ‘Tour de France’, whereas my calculations
assumed that around 15,200 spectators followed the races during the four days. Comparing the
ecological footprint per person, with 0.0153 gha for the ‘Tour de France’ and 0.178 gha for the ‘Grand
Raid’, it is obvious that despite the larger total impact of the ‘Tour de France’, the ‘Grand Raid’ had a
significantly higher impact per person. Calculated as impact per person and day this leads to 0.005 gha
for the ‘Tour de France’ against 0.045 gha for the ‘Grand Raid’.Heritage 2019, 2 756
Table 1. Carbon and ecological footprint by category. Source: own calculation with the help of the
Footprint Reporter™/Anthesis Group.
Category CO2 (tonnes) EF (gha)
Audience travel 9230.877 2705.667
Staff & performer travel 2266.110 666.043
Freight transport 3.899 1.123
Utilities 3.811 1.040
Accommodation 2789.295 1206.664
Consumables 63.662 31.857
Assets 27.343 328.246
Food and drink 48.235 41.142
Total 14433.233 4981.782
4.3. Global Ecological Biocapacity and Ecological Event Footprint per Year
All events generally create a higher impact on the environment than everyday life. Unfortunately,
no data on the ecological footprint of persons living on Reunion Island exists which could be perfectly
compared to the time of the event or even subtracted to find out the additional impact of the event.
Nevertheless, some comparisons to global figures contribute highlighting the influence quantity of
the event. Calculating the per-person-impact of each of the estimated 21,340 persons who have been
accounted in this study—runners, paid staff, volunteers and spectators— results in an ecological
footprint of 0.362 gha/per person for the four event days and 0.905 gha/per person and day.
If the consumption was likewise high during the whole year, this would result in an ecological
footprint of 33.023 gha/per person per year. Confronting this result with the global ecological
biocapacity which is currently around 1.8 gha/per person and year [36], proves that a comparatively
local and small sporting event as the ‘Grand Raid’ already consumes 18 times more global
bioproductive area than is available to sustainably maintain current consumption. This shows that
the level of consumption caused by the event was inequitable in 2013 and thereby contributed to the
global overshoot which signifies that nature’s capital is being spent faster than regenerated.
4.4. Limitations
The Footprint Reporter™ requires (like every method to calculate footprints) a large and reliable
dataset. Obviously, this is a general difficulty which concerns also other studies and necessarily
increases the number of assumptions [57]. It is impossible to gather information about all offered
items of the event-related consumption. Some items are event-specific or region-specific, and in
comparatively small events like the ‘Grand Raid’ one cannot rely on complete data sets. Moreover,
organizers or related institutions are not always motivated to support scientific approaches and thereby
to let somebody look behind the scenes. In this study also the language barrier between French and
English sometimes resulted in difficulties to find the exact corresponding item. It is in any case a
diligent routine piece of work to find out the required total weight of those items about which only the
quantities are available and to calculate the resulting weight by using scales or online figures single by
single. Depending on the size of the research team, it can be recommended to rather focus on certain
aspects of the organization and make sure that for this category all required data are available in a
high quality. If in contrast all concerned parties, staff, spectators, performers, volunteers, are included
in the analyses, defining boundaries is a challenge.
Coming back to the calculation tool, the Footprint Reporter™ contained, despite its general
suitability for international use, single UK-based items which created some transfer problems.
The factors for domestic flights, for instance, are based on assumed distances referring to a UK
convention. Related to the Indian Ocean region where this study took place another problem occurred
as average footprints of residents were not available like it is, for instance, the case in large parts of
the United Kingdom. Therefore, the calculated footprint does not take account of any ‘displacement
effects’ [9] generated by the event and reflected, for instance, in a reduced residents’ consumption
in usual restaurants during the time of the event. Also, no data was available on the average dailyHeritage 2019, 2 757
ecological footprint of Reunionese people or of tourists on the island in general which could have been
subtracted to have the additional impact. Even if it can be assumed that those aspects diminished the
total impact, the presented footprint results are generally still an underestimate. Items on which not
data was available—for instance, the merchandising products or further event-related publications or
printouts—could not be included in the calculations.
As the study of the ecological impact of sporting events is a relatively new field, internationally
agreed standards for the measurement of the carbon and ecological footprint are lacking. This makes
comparisons to related events which could be so enlightening still difficult. Therefore, if the required
financial and institutional means are offered, studies which embrace several event years should be
favoured, as this gives a historical reference and the opportunity for valuable comparisons. If future
research can, besides ecological issues, also deal with social and economic measurements, a complete
analysis of the event’s sustainability is possible.
The findings moreover had practical applications as they point out the ecologically crucial points
in the event planning and thereby provide the organizers with the means to prioritize their future
decisions with regard to their specific ecological impact. It though has to be considered that changes
in the organization of an event have always multiple and not only ecological effects. Throwing an
isolated view on ecology only numerous improvements are possible but with regard to a sustainable
development of the event, the social and the economic dimension of the ‘Grand Raid’ cannot be
neglected either. Considering that still 46% of the annual visitors on Reunion Island stay at their
family or friends [58], the regional tourism deeply benefits from the regular stimulation caused by the
sporting event. This is true for every event somehow but in the Indian Ocean Region tourism marks
an essential pillar for the increase of employment and social development.
It is true that the island knows also other ecological problems which persist during the whole year,
related for instance to the heavy traffic [59]; the ‘Grand Raid’, however, is a single annual happening
which results in a high number of people frequenting natural protected areas in a shorter time and
leaving their specific footprints behind them. Efforts to minimize the ecological impact of the event
could already be identified in 2013. This included the choice of reusable goblets for each runner, the
installation of some ecological toilets, the assignment of an eco-friendly enterprise for the installation
of the firework (using biodegradable products) and the allocation of dishes out of cardboard (not
plastic) at the catering stations. Nevertheless, the remaining ecological impact of the event cannot be
denied. It would be interesting to measure again and compare whether further changes in the event
organization have led to different results in the carbon and/or ecological footprint of the event.
5. Conclusions
One can hardly disagree that the over 20,000 persons which were involved as athletes, staff,
volunteers, and spectators in the ‘Grand Raid Réunion 2013’ resulted in a remarkable ecological impact.
With more than 14,000 tonnes CO2 and almost 5,000 global hectares the ‘Grand Raid 2013’ left an
impressive footprint behind its organization. The results demonstrate that the mountain ultramarathon
‘Grand Raid’ is not automatically a green event because it takes place in nature. The already existing
environmental campaigns should thus be extended to sensitize the runners and the event spectators for
their personal ecological impact. As the ‘Grand Raid Réunion’ is an internationally well-known event
and picks up the people in a true-to life situation, great chances for increasing public awareness exist.
However, changing attitudes is a long process as “most people don’t react well to being lectured and
hectored. Sports has a vital role to play in delivering a softer, more powerful message [60]”. This again
underlines the importance of studies which focus on sport events and their specific social power.
The benefits of an ecological event organization for legacy are difficult to quantify, but due to
the increasing public awareness the importance to show efforts towards a ‘green’ event organization
will probably continue to rise in the following years. This is expected to come along with further
analyses on the ecological impact of international sporting events. It is hoped that the presented studyHeritage 2019, 2 758
contributes to this field of research, encourages scientists to choose other than mega-events only for
footprint calculations and thereby serves for further fruitful comparisons in the future.
Funding: This research was funded by the Ruhr-University Bochum (RUB), Germany, under a Gateway Fellowship
of the Research School plus.
Acknowledgments: Anthesis Group kindly supplied a demonstration version of Footprint Reporter™.
Conflicts of Interest: The author declares no conflict of interest. The founding sponsors had no role in the design
of the study; in the collection, analyses, or interpretation of data; in the writing of the manuscript, or in the
decision to publish the results.
References
1. Heck, S.; Terret, T. Nature Conservation versus Event Organisation: ‘Madmen’s Diagonals’ on Reunion
Island (1989–2014). J. Policy Res. Tour. Leis. Events 2016, 8, 18–32. [CrossRef]
2. Hunter, R. The Greenpeace to Amchitka: An Environmental Odyssey; Arsenal Pulp Press: Vancouver, BC, Canada, 2004.
3. UNESCO/WHC. World Heritage List. 2014. Available online: http://whc.unesco.org/en/list/&search=
history&searchSites=&search_by_country=®ion=&search_yearinscribed=&themes=&criteria_
restrication=&type=&media=&description=&&order=year (accessed on 22 November 2018).
4. Paramasivan, M. How Do We Reduce the Carbon Footprint of Major Sporting Events? International Platform
on Sport & Development. 2012. Available online: http://www.sportanddev.org/?4449/How-do-we-reduce-
the-carbon-footprint-of-major-sporting-events (accessed on 22 November 2018).
5. IOC (International Olympic Committee). The Official Website of the Olympic Movement. 2013. Available
online: http://www.olympic.org/news/10th-ioc-world-conference-on-sport-and-the-environment-kicks-
off-in-sochi/214023 (accessed on 22 November 2018).
6. Association Grand Raid 2013. Umweltschutz und Sauberkeit der Wege. Available online: http://www.
grandraid-reunion.com/spip.php?rubrique325 (accessed on 22 November 2018).
7. Preuss, H. Economics of Staging the Olympics: A Comparison of the Games 1972–2008; Edward Elgar Publishing:
Cheltenham, UK, 2004.
8. Tziralis, G.; Tolis, A.; Tatsiopoulos, I.; Aravossis, K.G. Economic aspects and the sustainability impact of the
Athens 2004 Olympic Games. In Environmental Economics and Investment Assessment; Aravossis, K., Ed.; WIT
Press: Ashurst, Southampton, UK, 2006; pp. 21–34.
9. Collins, A.; Flynn, A. Measuring the environmental sustainability of a major sporting event: A case study of
the FA Cup Final. Tour. Econ. 2008, 14, 751–768. [CrossRef]
10. Dolles, H.; Söderman, S. Addressing ecology and sustainability in mega-sporting events: The 2006 football
World Cup in Germany. J. Manag. Organ. 2010, 16, 587–600. [CrossRef]
11. University of East London, & Thames Gateway Institute for Sustainability. Olympic Games Impact
Study—London 2012. Pre-Games Report. 2010. Available online: http://www.uel.ac.uk/geo-information/
documents/UEL_TGIfS_PreGames_OGI_Release.pdf (accessed on 22 November 2018).
12. Essex, S.; Chalkley, B. Mega-sporting events in urban and regional policy: A history of the Winter Olympics.
Plan. Perspect. 2004, 19, 201–204. [CrossRef]
13. Bessy, O. Le Grand Raid de La Réunion: À Chacun son Extrême et un Emblème Pour Tous; Océan Editions:
Saint-André, La Réunion, 2002.
14. Bessy, O.; Naria, O. La provenance des participants au grand raid de la Réunion. Mappemonde 2004, 74, 1–8.
15. Bosc, C. Proposition d’un Certificat Médical de Non Contre-Indication à la Course de Montagne de type ultra
Trail: Exemple du Grand Raid de l’Ile de la Réunion. Ph.D. Thesis, l’Université de Bordeaux II, Bordeaux,
France, 2010.
16. Bouchet, P.; Gay, J.-C. Les Hauts de la Réunion conquis par les losirs. Mappemonde 1998, 51, 31–37.
17. Combeau-Marie, E.; Bouchet, P. Le Sport à la Réunion, Etats des Lieux et Perspectives: Approche Socio-Historique
du Développement des Infrastructures et de l’offre des Activités Physiques et Sportives; Saint-Denis/La Réunion,
University of Reunion Island, CURAPS: Sainte-Clotilde, La Reunion, 1999.
18. Jauze, J.-M. The Uplands of Reunion Island: Where Tradition Meets the Future; Océan Editions: Saint-André, La
Réunion, 2013.
19. Pousse, M. Le Grand Raid de la Réunion. Vingt ans de Passion. 1993–2012; Orphie: Saint-Denis, La Réunion, 2013.Heritage 2019, 2 759
20. Lacroix, E. Guide D’entraînement à l’ultra-Trail: L’exemple: Le Grand Raid; Orphie: Saint-Denis, La Réunion, 2009.
21. Soulé, B. Les ‘sports extrêmes’: Analyse terminologique d’une caractérisation sportive à succès. Mov. Sport
Sci. 2008, 63, 83–90. [CrossRef]
22. Dalama, M.-G. L’île de la Réunion et le tourisme: d’une île de la désunion à la Réunion des Hauts et Bas.
L’espace Géogr. 2005, 4, 342–349. [CrossRef]
23. Direction régionale de l’environnement de La Réunion. Atlas de l’environnement: Île de La Réunion; Saint-Denis/La
Réunion; Ministère de l’aménagement du territoire et de l’environnement: Alger, Algérie, 2002.
24. Parc national de La Réunion. La Charte du parc National de La Réunion: Les Pitons, Cirques et Remparts au
Centre d’un Projet de Territoire; Charte approuvée par le décret n◦ 2014-49 du 21 janvier 2014. Plaine des
Palmistes/La Réunion; Parc national de La Réunion: La Réunion, France, 2014.
25. UNESCO. Map of Inscribed Property 2010. World Heritage Nomination—IUCN Technical Evaluation. Pitons,
Cirques and Remparts of Reunion Island (France)—Id Nº 1317. 2008. Available online: http://whc.unesco.org/
en/list/1317/documents (accessed on 22 November 2018).
26. Global Footprint Network. Country Trends [without year, a]. Available online: http://www.
footprintnetwork.org/en/index.php/GFN/page/trends (accessed on 22 November 2018).
27. Boruckea, M.; Mooreb, D.; Cranstonb, G.; Graceya, K.; Ihaa, K.; Larsona, J.; Lazarusa, E.; Moralesa, J.C.;
Wackernagel, M.; Gallib, A. Accounting for demand and supply of the biosphere’s regenerative capacity:
The National Footprint Accounts’ underlying methodology and framework. Ecol. Indic. J. 2013, 24, 518–533.
[CrossRef]
28. Giljum, S.; Hammer, M.; Stocker, A.; Lackner, M.; Best, A.; Blobel, D.; Ingwersen, W.; Naumann, S.;
Neubauer, A.; Simmons, C.; et al. Wissenschaftliche Untersuchung und Bewertung des Indikators “Ökologischer
Fußabdruck”; Umweltbundesamt: Dessau-Roßlau, Germany, 2007.
29. Wackernagel, M.; Rees, W. Our Ecological Footprint: Reducing Human Impact on the Earth; New Society
Publishers: Gabriola Island, BC, Canada, 1996.
30. Ayres, R.U. Commentary on the utility of the ecological footprint concept. Ecol. Econ. 2000, 32, 347–350.
31. Schwarz, U. Ökologischer Fußabdruck: Ein Überblick; Greeneace: Esslingen am Neckar, Germany, 2010;
Available online: http://www.greenpeace-esslingen.de/pdfs/footprint_GP-Esslingen.pdf (accessed on 22
November 2018).
32. Chambers, N.; Simmons, C.; Wackernagel, M. Sharing Nature’s Interest. Ecological Footprints as an Indicator of
Sustainability; Earthscan: London, UK; Sterling, VA, USA, 2000.
33. Best Foot Forward (Part of the Anthesis Consulting Group PLC) [without year]. Ecological Footprinting.
Available online: http://www.bestfootforward.com/accounting/footprinting/ecological-footprinting
(accessed on 22 November 2018).
34. Jenkin, N.; Stentiford, C. Stepping Forward. A Resource Flow and Ecological Footprint Analysis of the South West
of England (Technical Report); Best Foot Forward: Oxford, UK, 2005.
35. Global Footprint Network World Footprint [without year, b]. Available online: http://www.
footprintnetwork.org/en/index.php/GFN/page/world_footprint (accessed on 22 November 2018).
36. WWF. Living Planet Report 2012: Biodiversity, Biocapacity and Better Choices; WWF International: Gland,
Switzerland, 2012.
37. Aldaya, M.M.; Chapagain, A.K.; Hoekstra, A.Y.; Mekonnen, M.M. The Water Footprint Assessment Manual:
Setting the Global Standard; Earthscan: London, UK; Washington, DC, USA, 2011.
38. Zheng, Q.P.; Rebennack, S.; Pardalos, P.; Pereira, M.V.F.; Iliadis, F.N. Handbook of CO2 in Power Systems;
Springer: Berlin/Heidelberg, Germany, 2012.
39. Global Footprint Network. Footprint Basics—Overview. 2012. Available online: http://www.
footprintnetwork.org/en/index.php/GFN/page/footprint_basics_overvie (accessed on 22 November 2018).
40. United States Environmental Protection Agency (EPA). What Is a Carbon Footprint? 2008. Available
online: http://climatechange.supportportal.com/link/portal/23002/23006/Article/22042/What-is-a-
carbon-footprint (accessed on 22 November 2018).
41. Williams, M. Difference between a Carbon Footprint and an Ecological Footprint [without year]. Available
online: http://homeguides.sfgate.com/difference-between-carbon-footprint-ecological-footprint-78732.
html (accessed on 22 November 2018).Heritage 2019, 2 760
42. London Organizing Committee of the Olympic Games and Paralympic Games. Carbon Footprint
Study—Methodology and Reference Footprint; London Organizing Committee of the Olympic Games: London,
UK, 2010; pp. 1–80. Available online: http://learninglegacy.independent.gov.uk/publications/london-2012-
carbon-footprint-methodology-and-reference-f.php (accessed on 22 November 2018).
43. Best Foot Forward (Part of the Anthesis Consulting Group PLC). Footprint Reporter™: User Guide; Best Foot
Forward: Oxford, UK, 2011.
44. DEFRA (Department for Environment, Food and Rural Affairs). Guidelines to Defra’s GHG Conversion
Factors. 2008. Available online: http://www.defra.gov.uk/environment/business/envrp/pdf/ghg-cf-
guidelines-annexes2008.pdf (accessed on 22 November 2018).
45. Batinic, B. Datenqualität bei internetbasierten Befragungen. In Online-Marktforschung: Theoretische Grundlagen
und Praktische Erfahrungen; Theobald, A., Dreyer, M., Starsetzki, T., Eds.; Gabler Verlag: Wiesbaden, Germany,
2001; pp. 115–132.
46. Evans, J.R.; Mathur, A. The value of online surveys. Internet Res. 2005, 15, 195–219. [CrossRef]
47. Wright, K.B. Researching Internet-based populations: Advantages and disadvantages of online survey
research, online questionnaire authoring software packages, and web survey services. J. Comput. -Med.
Commun. 2005, 10, 11. Available online: http://onlinelibrary.wiley.com/doi/10.1111/j.1083-6101.2005.
tb00259.x/full (accessed on 22 November 2018). [CrossRef]
48. United Nations. Report of the Secretary-General on the Work of the Organization: Millennium Development Goals,
Targets and Indicators: Statistical Tables; United Nations: New York, NY, USA, 2013.
49. United Nations. Millennium Development Goals Indicators [without year]. Available online: http://mdgs.
un.org/unsd/mdg/SeriesDetail.aspx?srid=749&crid (accessed on 22 November 2018).
50. Simmons, C. Learning Legacy. Lessons Learned from Planning and Staging the London 2012 Games; London
Organizing Committee of the Olympic Games and Paralympic Games: London, UK, 2012.
51. FIFA (Fédération Internationale de Football Association). Summary of the 2014 FIFA World
Cup Brazil™ Carbon Footprint. 2013. Available online: http://www.mgminnova.com/web/
summaryofthe2014fwccarbonfootprint_neutral.pdf (accessed on 22 November 2018).
52. Department of Environmental Affairs and Tourism of the Republic of South Africa. Feasibility study report for
a carbon neutral FIFA 2010 World Cup™ in South Africa; Econ Pöyry: Stockholm, Sweden, 2009.
53. United Nations Environment Programme (UNEP)/Oben. T South Africa 2010 Report; UNON Publishing
Services Section: Nairobi, Kenya, 2012; Available online: www.unep.org/pdf/pressreleases/FIFA_2010_LR.
pdf (accessed on 22 November 2018).
54. Collins, A.; Flynn, A.; Munday, M.; Roberts, A. Assessing the Environmental Consequences of Major Sporting
Events: The 2003/04 FA Cup Final. Urban Stud. 2007, 44, 457–476. [CrossRef]
55. Collins, A.; Munday, M.; Roberts, A. Environmental Consequences of Tourism Consumption at Major Events:
An Analysis of the UK Stages of the 2007 Tour de France. J. Travel Res. 2012, 51, 577–590. [CrossRef]
56. Collins, A.; Roberts, A.; Munday, M. The Environmental Impacts of Major Cycling Events: Reflections on the UK
Stages of the Tour de France (Report); Cardiff University: Cardiff, Wales, UK, 2012.
57. Collins, A.; Jones, C.; Munday, M. Assessing the environmental impacts of mega sporting events: Two
options? Tour. Manag. 2009, 30, 828–837. [CrossRef]
58. Quels Touristes pour La Réunion? Linfo.re. 22 May 2014. Available online: http://www.linfo.re/la-reunion/
economie/644294-quels-touristes-pour-la-reunion (accessed on 22 November 2018).
59. Lamy-Giner, M.-A. Road Communications in Reunion’s Uplands: Highways and Byways. In The Uplands of
Reunion Island: Where Tradition Meets the Future; Jauze, J.-M., Ed.; Océan Editions: Saint-André, La Réunion,
2013; pp. 299–319.
60. Steinberg, L. Sports Can Help Roll Back Climate Change! Forbes.com, 21 April 2014. Available online: http:
//www.forbes.com/sites/leighsteinberg/2014/04/21/sports-can-help-roll-back-climate-change/ (accessed
on 22 November 2018).
© 2019 by the author. Licensee MDPI, Basel, Switzerland. This article is an open access
article distributed under the terms and conditions of the Creative Commons Attribution
(CC BY) license (http://creativecommons.org/licenses/by/4.0/).You can also read