Spillovers in Prices: The Curious Case of Haunted Houses
←
→
Page content transcription
If your browser does not render page correctly, please read the page content below
Review of Finance, 2021, 903–935
                                                               doi: 10.1093/rof/rfaa030
                                     Advance Access Publication Date: 15 October 2020

                                                                                                            Downloaded from https://academic.oup.com/rof/article/25/3/903/5924383 by Copenhagen Business School user on 20 May 2021
Spillovers in Prices: The Curious Case of
Haunted Houses*
Utpal Bhattacharya1, Daisy Huang2, and
Kasper Meisner Nielsen3
1
 Hong Kong University of Science and Technology, 2Research Institute of Economics and
Management, Southwestern University of Finance and Economics, and 3Copenhagen Business
School

Abstract
Exploiting the unique institutional setting of Hong Kong’s real estate market, we un-
cover a curious ripple effect of haunted houses on the prices of nearby houses.
Prices drop on average 20% for units that become haunted, 10% for units on the
same floor, 7% for units in the same block, and 1% for units in the same estate. Our
study makes two contributions. First, we provide an estimate of a large negative
spillover on prices caused by a quality shock. Second, we find that the demand
shock rather than the fire sale supply shock explains most of the spillover.

JEL classification: D62, H23, R21, R31
Keywords: Fire sales, Negative spillovers, Haunted houses
Received May 22, 2020; accepted August 23, 2020 by Editor Amit Goyal.

 * The authors are grateful to the Coroner’s Court, and in particular to Information Officer Barry Lee,
   for providing administrative register data on unnatural deaths in Hong Kong from 2000 to 2015.
   They thank Amit Kumar, Dalin Wang, Xiao Zhao, and Zhuowei Hwang for excellent research assist-
   ance. This article has benefited from helpful comments and suggestions from Johan Sulaeman, Ed
   Coulson, and seminar participants at Aalto University, Australia National University, ABFER
   Conference 2018, Bank of Estonia, Chinese University of Hong Kong in Hong Kong and in Shenzhen,
   City University of Hong Kong, Erasmus University, FMA Asian Conference 2018, Goethe University
   Frankfurt, Harbin University, Hong Kong Baptist University, Hong Kong Polytechnic University, Hong
   Kong University of Science and Technology, Miami Behavioral Finance Conference 2017, Nanjing
   Audit University, Nottingham University Business School China, Peking University, Pontificia
   Universidad Javeriana, Shanghai Advanced Institute of Finance, Southwestern University of
   Finance and Economics, Sun Yat-sen University (Guangzhou and Zhuhai), Tsinghua University,
   University of Amsterdam, University of British Columbia, University of Hong Kong, University of
   Oulu, University of Vaasa, and Zhejiang University. They gratefully acknowledge financial support
   from the Fundamental Research Funds for the Central Universities, China [Grant No. JBK190601].
   K.M.N. thanks the Danish Finance Institute for financial support.

C The Author(s) 2020. Published by Oxford University Press on behalf of the European Finance Association.
V
All rights reserved. For permissions, please email: journals.permissions@oup.com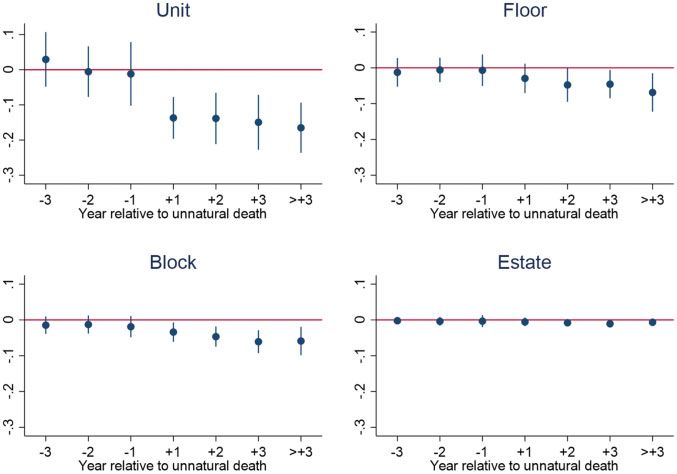
904                                                                            U. Bhattacharya et al.

1. Introduction
Spillovers in prices occur in many financial markets. They are caused by an idiosyncratic
shock that affects the price of just one asset, which in turn affects the price of other assets.
Empirically, it is challenging to identify shocks that are idiosyncratic, rather than systemat-

                                                                                                            Downloaded from https://academic.oup.com/rof/article/25/3/903/5924383 by Copenhagen Business School user on 20 May 2021
ic. Even when shocks are idiosyncratic, it remains a challenge to quantify how much of the
spillover in prices is caused by the idiosyncratic demand shock or the idiosyncratic supply
shock.1
    The purpose of this article is to employ a unique institutional setting that allows us to
identify a well-defined quality shock, and to isolate the effect of the demand and supply
shocks in the spillover on prices. Specifically, we identify a negative psychological shock to
the perceived quality of a house—a house being declared as “haunted” due to a murder,
suicide, or other unnatural death. This exogenous shock to perceived quality may cause a
negative demand shock, a positive supply shock, or both. There will be a negative demand
shock if the lower perceived quality makes prospective buyers reluctant to buy nearby
houses—a negative externality—and there will be a positive supply shock if haunted house
owners decide to sell their houses fast, resulting in price pressure—again, a negative exter-
nality. Both effects may cause the price of nearby houses to drop. Using the setting of
haunted houses, we analyze the spillover effect on prices of neighboring houses, and exam-
ine whether it is driven by the fire sale of the haunted house (a supply shock) or lower per-
ceived quality (a demand shock), or both. We can separate these two channels because the
prices of nearby houses are observed, irrespective of whether the affected unit is sold or
not.
    We analyze Hong Kong’s residential real-estate market because it offers four institution-
al features that help our identification strategy. First, since a population of 7.3 million
(2015) lives in a small area that is less than 25% of its 1,106 km2 (most of the other area is
reserved for country parks and nature reserves), residential real estate mainly consists of
units in high rise blocks sharing common facilities on a small plot of land, called an estate.
Although estates are heterogeneous, blocks within an estate and the units within a block
are fairly homogeneous.2 This helps in our identification because it makes spillovers in pri-
ces easier to identify and allows us to control for unobserved heterogeneity in the cross-
section of units as well as in the time-series.
    Second, residents are very wary of haunted houses and sellers have to disclose whether a
house is haunted.3 In Hong Kong, the psychological component of the value of a house,

1 Prior empirical literature on spillovers in prices has been preoccupied with identifying the effect of
  fire sales on prices (see survey by Shleifer and Vishny, 2011) using transaction price-based data
  sets on airplanes (Pulvino, 1998), corporate bankruptcies (Eckbo and Thorburn, 2008; Bernstein
  et al., 2017), foreclosures (Campbell, Giglio, and Pathak, 2011; Anenberg and Kung, 2014), and mu-
  tual funds (Coval and Stafford, 2007). Collectively, these studies have established that fire sales
  lead to substantial reductions in prices, and result in negative spillover effects on prices of similar
  assets. Spillovers in prices, however, might occur not just due to the supply shock (price pressure)
  from a fire sale, but also from a demand shock.
2 In our sample, each estate has an average of twelve blocks, each block has an average of twenty-
  six floors, and each floor has an average of five units. Thus, the average estate in our sample con-
  sists of 1,560 apartments in a small area.
3 In Jopard Holdings Limited v. Ladefaith Limited and Centaline Property Agency Limited (HCA3775/
  2001), the Property Agent lost the case because “the Agent did not exercise reasonable care and
Spillovers in Prices                                                                             905

given the beliefs of locals, is related to the principles of Feng Shui. An unnatural death, it is
believed, causes excess negative energy, and impairs the value of a house. As a result, real-
estate companies maintain databases of haunted houses compiled from local press reports
covering these tragic events.4 The focus on haunted houses helps our identification, because
unnatural death is a negative shock to the perceived quality of the unit. Third, as the Hong

                                                                                                         Downloaded from https://academic.oup.com/rof/article/25/3/903/5924383 by Copenhagen Business School user on 20 May 2021
Kong real-estate market is very liquid and the flow of haunted houses is large in number (in
our sample of large estates, from 2000 to 2015, 1,032 units are identified as haunted), we
have a sample size with sufficient statistical power to detect spillovers in a small geographic
area with homogeneous quality of units within an estate.5 Fourth, and finally, the institu-
tional setting makes it unlikely that local economic shocks at the district level (Hong Kong
has 18 districts) differentially affect haunted and non-haunted units, floors or blocks within
an estate, because of the close proximity.6 This bolsters our identification strategy and
makes it reasonable to attribute the effect of haunted houses on the prices of nearby units
to the spillover effect.
    To examine the effect of haunted houses on prices, we follow a standard approach in
real-estate economics and regress the logarithm of the transaction price per square foot on
time-varying unit characteristics, unit fixed effects, and year-month fixed effects. We find
that the haunted unit drops in price by 19.9% after it becomes haunted; the units on the
affected floor drop in price by 9.7%; the units on floors one to three floors above or below
the affected floor drop in price by 8.9%; the units in the affected block drop in price by
7.1%; the units in the affected estate drop in price by 1.4%. Local economic shocks in
Hong Kong cannot explain this highly granular ripple effect within an estate.
    Among the tragic events that we consider, murder has the most dramatic ripple effect.
Interestingly, price recovery is slow. We find that prices of the haunted units do not seem to
recover during our 16-year sample period. The prices of its affected neighbors on the same
floor do recover, albeit very slowly. The affected block and the affected estate even have
further discounts later.
    A legitimate issue is how we define a haunted house. In Hong Kong, a haunted house is
where an unnatural death occurred. According to this definition, a unit will not be consid-
ered haunted if the unnatural death occurred outside the unit. We check this hypothesis
using a placebo test. We construct a placebo sample of unnatural deaths that occurred out-
side the home of the deceased (deaths in traffic accidents, accidental deaths during medical
procedures, and accidental deaths due to drowning). We find no discounts in units in this
placebo sample, and neither do we find any negative spillovers on the prices of nearby
houses. A second issue is that haunted houses due to deaths before 2000 are unobserved,
but might affect prices in the 2000–2015 period. We address this issue by re-running our

  skill in the collection and passing on of information concerning the Property.” The information that
  was not revealed was the tragic death of a four-year-old boy who had fallen from the balcony of
  the unit a year before the sale. http://legalref.judiciary.gov.hk/lrs/common/search/search_result_
  detail_frame.jsp?DIS¼43673&QS¼%2B&TP¼JU.
4 See, for example, http://www.squarefoot.com.hk/haunted/.
5 Andersen and Nielsen (2017), who use sudden deaths as the exogenous event to document price
  drops in houses that have fire sales, cannot analyze spillovers because of a small sample size.
6 Haunted houses provide an ideal solution to the identification problem. To quote Campbell, Giglio,
  and Pathak (2011): “Ideally, we would like an instrument that influences foreclosures but that does
  not influence house prices except through foreclosures: however, we have not been able to find
  such an instrument.”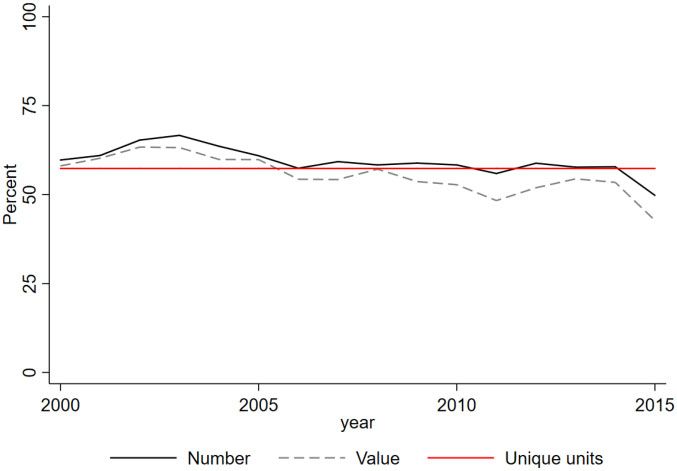
906                                                                          U. Bhattacharya et al.

tests for estates constructed after 2000. Our results do not change. A third issue is that
house price growth might be different in locations with haunted houses. We address this
concern by showing that there is no pre-trend in house prices before units become haunted
and by re-running our tests using high-dimensional location-time fixed effects. The inclu-
sion of high-dimensional fixed effects also addresses potential concerns about pre-trends in

                                                                                                         Downloaded from https://academic.oup.com/rof/article/25/3/903/5924383 by Copenhagen Business School user on 20 May 2021
house prices due to geographic locations, because the spillover effects are estimated using
variation in house prices within a location at a given time. Again, our results do not
change.
    Our main result is that most of the spillover effect in prices is driven by the demand
shock caused by the perceived drop in quality. We document this by comparing the spill-
over effect when the affected unit is sold (supply shock and demand shock) to the spillover
effect when the affected unit is not sold (only demand shock). Both these spillover effects
are the same for affected floors, for affected blocks, and for affected estates, implying that
the demand shock is mostly responsible for the spillover. We corroborate this finding by
examining transactions before and after the unnatural death. We notice that turnover
increases for units after they become haunted, implying that there is a supply shock at the
unit level. However, turnover does not change for affected floors, for affected blocks, and
for affected estates, implying that there is no supply shock at these levels, and so the spill-
over in prices seems to be caused by the demand shock. To this end, our study is the first to
identify a negative quality shock that causes a spillover effect on prices primarily driven by
a demand shock.
    Our study contributes to a growing literature on spillovers in prices. Prior literature has
documented that macroeconomic shocks cause spillover in prices of stock and bonds due to
rebalancing by institutional investors (Jotikasthira, Lundblad, and Ramadorai, 2012;
Manconi, Massa, and Yasuda, 2012) or due to similarity in investment style (Boyson,
Stahel, and Stulz, 2010). Bankruptcy announcements might cause return contagions, lead-
ing to distress events for strategic partners (Boone and Ivanov, 2012) and creditors with
large exposures (Jorion and Zhang, 2009), or to increased interest rates for industry rivals
(Hertzel and Officer, 2012). Financial contagion might also be propagated through liquid-
ity and risk-premium channels as suggested by Longstaff (2010). In relation to these papers,
our study identifies a shock that causes a spillover effect on prices, which is primarily driven
by a demand shock caused by a perceived drop in quality, rather than a supply shock
caused by forced sales. The perceived drop in the quality of units in the immediate vicinity
of the haunted unit is because of the principles of Feng Shui.7
    We also contribute to the literature in real-estate economics studying (dis)amenity spill-
overs due to foreclosure (Lin, Rosenblatt, and Yao, 2009; Campbell, Giglio, and Pathak,
2011; Anenberg and Kung, 2014), large house sizes (Leguizamon, 2010), home ownership
(Coulson and Li, 2013), and urban revitalization (Rossi-Hansberg, Sarte, and Owens,
2010). The study that is closest to ours is Anenberg and Kung (2014), who decompose the

7 Joyce Lam, Director of Savills Realty Limited, a large real-estate broker in Hong Kong, explains:
  “According to traditional Chinese thought, someone who dies an unnatural death becomes a hun-
  gry ghost: angry, restless and liable to do you harm. If they met their untimely demise at home, the
  market price of that apartment can drop by an average of 15%. The effect can spread throughout
  the building—adjacent units and even the whole floor are affected, too.” (https://www.savills.-
  com.hk/blog/article/147919/hong-kong-articles/the-myths-about-buying-a-haunted-house-in-hong-
  kong.aspx?locale¼).
Spillovers in Prices 907
spillover effects of foreclosures into a supply and demand effect. Their identifying assump-
tion is that the demand effect occurs at the time of the eviction, while the supply effect
occurs at the time of the foreclosure. In comparison, our identification comes from the tim-
ing of unnatural deaths. Our decomposition into supply and demand effects is based on the
Downloaded from https://academic.oup.com/rof/article/25/3/903/5924383 by Copenhagen Business School user on 20 May 2021
simple idea that there cannot be a supply effect if the haunted house is not sold.
Section 2 presents our data and explains the institutional setting surrounding residential
real estate and haunted houses in Hong Kong. Section 3 presents the spillover results.
Section 4 presents a simple model that tells us how to disentangle the demand channel from
the supply channel in our case. We then use this idea to do the disentangling. Section 5 dis-
cusses some concerns like the external validity of our research. Section 6 concludes.
2. Data
2.1 Estates in Hong Kong
The residential real-estate market in Hong Kong consists of a private and public sector.
This study focuses on the private sector, whose market share is around 50%. We exclude
the public sector, because their property values are distorted by large government subsidies
and sales restrictions.
The institutional setting of Hong Kong’s private market for residential real estate is
helpful for our identification strategy. Due to Hong Kong’s rugged topography with steep
hills, buildable land is scarce. The scarcity of buildable land combined with population
growth has led to the pervasive construction of high-rise blocks, resulting in one of the
world’s highest population densities. In the most densely populated district, Kwun Tong,
around 57,000 people live per square kilometer. Economies of scale, combined with the
Hong Kong government’s monopoly on land, have led to large-scale real-estate develop-
ments that are referred to as estates. The typical estate consists of several identical high-rise
blocks sharing amenities such as carparks, fitness centers, shuttle buses, swimming pools,
and security. Each block typically consists of 20–80 floors sharing a lobby area, while each
floor is subdivided into four to eight units with shared access to elevators and staircases.
This helps in our identification because it alleviates the concern that district-level economic
conditions differentially affect haunted and non-haunted units, floors, or blocks within an
estate, because units within a block are homogeneous, and blocks are very close to each
other and share the same amenities. These institutional features also make it easier to iden-
tify spillovers in prices convincingly.
In order to understand the nature of an estate, it is helpful to zoom into one: Dawning
Views. We start with a drone view of Hong Kong. Hong Kong consists of three territories:
Hong Kong Island, Kowloon, and New Territories. These territories are further divided
into districts. Hong Kong Island has four districts, Kowloon has five districts, and New
Territories has nine districts. Online Appendix A1 shows a map of the eighteen districts.
Online Appendix A2 zooms in on one estate, Dawning Views, in the North District of the
New Territories. Online Appendix A3 shows a picture of the blocks of Dawning Views.
Online Appendix A4 gives the estate layout of Dawning Views, while Online Appendix A5
shows the floor plan of floors 8–27 in Block 12 of Dawning Views, which have eight units
per floor. Collectively, Online Appendices A1–A5 visualize the advantage of using Hong
Kong’s residential real-estate market to identify spillovers in prices and uncover whether
spillovers are driven by demand shocks, supply shocks, or both.908 U. Bhattacharya et al.
Our data cover all private residential real-estate transactions in Hong Kong between
2000 and 2015. There are 1,056,918 of them. The data are maintained by EPRC Ltd., a
commercial real-estate agency in Hong Kong, and the data are available for sale to the pub-
lic. The data include the estate name and location; the address of the block, floor, and unit;
some property characteristics; transaction date; and transaction price.
Downloaded from https://academic.oup.com/rof/article/25/3/903/5924383 by Copenhagen Business School user on 20 May 2021
The average unit in Hong Kong costs 4.23 million HKD (541,000 USD), and has an in-
terior size of 606.3 square feet (56.3 m2), making Hong Kong one of the most expensive cit-
ies in the world with an average transaction price of 6,209 HKD (791 USD) per square
foot, equivalent to 66,833 HKD (8,514 USD) per square meter. Most transactions occur in
New Territories, followed by Kowloon and Hong Kong Island. There is a lot of heterogen-
eity in these real-estate transactions. The median growth in unit prices is 8.8% per year
from 2000 to 2015, the 25th percentile being 5.4%, and the 75th percentile being 12.6%.8
Although there are 7,352 estates in Hong Kong, we focus on the largest estates, because
such estates provide us with a better ability to control for location-time effects due to a
large number of transactions. A large estate is defined as an estate with 1,000 or more
transactions over our sample period, equivalent to around five transactions per month.
Following this definition, 211 estates are classified as large (2.9% of all estates). Although
this is a small fraction of all estates in our sample, more than half of the transactions
(57.5%) in our data are located in large estates. Figure 1 shows that the market share of
large estates has been almost constant over the sample period both in terms of the number
of transactions and value of transactions. In comparison, large estates make up 57.3% of
the private residential real-estate units, as illustrated by the red horizontal line in Figure 1,
implying that the market for units in large estates has the same turnover as the market for
units in small estates. Figure 2 shows that the prices per square foot in large and small
estates have followed a parallel trend, with the exception of 2011 and 2012 when prices of
small estates appreciated more than for large estates. We note that this difference is driven
by location as properties on Hong Kong Island appreciated faster than units in Kowloon
and New Territories during these years. We conclude that our sample of transactions in
large estates is fairly representative for the residential real-estate market in Hong Kong.
Table I reports detailed descriptive statistics showing the difference between large and
small estates. Panel A of Table I shows that units in large estates are slightly smaller (592
versus 628 square feet), younger (10.5 versus 19.7 years), sell at lower prices (3.84 versus
4.80 million HKD) and are cheaper (6,033 versus 6,467 HKD per square foot) compared
with small estates. These differences are statistically significant. Part of the difference in
price can be attributed to location as large (small) estates are in New Territories (Hong
Kong Island)—see Panel B of Table I—and property prices in New Territories compared
with property prices in Hong Kong Island, due to the longer distance to the central business
district around Victoria Harbor, are lower. The number of transactions across years, as
seen in Panel C of Table I, has an inverse U pattern in the period from 2000 to 2015 for
both large and small estates. Panel D of Table I shows no seasonal pattern for both large
and small estates.
While we focus on the largest estates, there is substantial heterogeneity even in this sub-
set. The largest estate in our sample of large estates, Mei Foo Sun Chuen, consists of 99
high-rise unit blocks with around 13,500 units. During our sample period, 13,867 units in
8 We analyze units with at least two transactions in our sample period. The growth rate in unit price
per year is calculated from the price of the first transaction and the price of the last transaction.Spillovers in Prices 909
Downloaded from https://academic.oup.com/rof/article/25/3/903/5924383 by Copenhagen Business School user on 20 May 2021
Figure 1. Market share of large estates. This figure shows the market share of large estates between
2000 and 2015. A large estate is defined as estates with 1,000 or more transactions over our sample
period, equivalent to around five transactions per month. We calculate the market share in large
estates based on the number and value of transactions in each year. The horizontal red line shows the
fraction of unique units located in large estates.
Figure 2. House price development, 2000–2015. This figure shows the average transaction price per
square foot for large and small estates between 2000 and 2015. A large estate is defined as estates with
1,000 or more transactions over our sample period, equivalent to around five transactions per month.910 U. Bhattacharya et al.
Table I. Descriptive statistics
We report descriptive statistics for all transactions, and transactions in estates that are classi-
fied as large or not, respectively. A large estate is defined as estates with 1,000 or more transac-
tions over our sample period, equivalent to around five transactions per month. Panel A reports
Downloaded from https://academic.oup.com/rof/article/25/3/903/5924383 by Copenhagen Business School user on 20 May 2021
transaction characteristics. Price is in million HKD (one USD equals 7.78 HKD), Size is measured
in square feet (one square meter equals 10.76 square feet), Price per square foot is in HKD, and
Age is measured in years. New unit is an indicator for primary transactions. Carpark is an indi-
cator for whether the transaction includes allocated space in the carpark. Panels B–D report the
distribution of transactions by territory (i.e., region), year, and quarter of year, respectively. ***
denotes statistical significance at the 1% level.
All Large estate Difference
Yes (1) No (2) (1)(2)
A. Transaction characteristics
Price (million HKD) 4.23 3.84 4.80 0.97***
Size (square feet) 606.3 591.7 627.7 –36.0***
Price per square foot (HKD) 6,209.0 6,033.2 6,467.2 –433.2***
Block age (years) 14.2 10.5 19.7 –9.2***
New unit (%) 17.5 22.6 10.2 12.4***
Carpark (%) 6.5 2.3 12.7 –10.4***
B. Territory (%)
Hong Kong Island 22.4 11.8 37.9
Kowloon 27.7 23.4 33.9
New Territories 50.0 64.8 28.2
C. Year
2000 48,302 28,847 19,455
2001 55,430 33,806 21,624
2002 54,390 35,529 18,861
2003 56,801 37,856 18,945
2004 79,426 50,508 28,918
2005 75,821 46,191 29,630
2006 61,276 35,178 26,098
2007 100,882 59,790 41,092
2008 66,321 38,694 27,627
2009 95,447 56,178 39,269
2010 103,937 60,632 43,305
2011 63,552 35,547 28,005
2012 65,071 38,276 26,795
2013 37,558 21,675 15,883
2014 51,242 29,629 21,613
2015 41,462 20,646 20,816
D. Quarter
First 271,777 162,699 109,078
Second 272,399 161,750 111,649
Third 260,822 156,334 104,488
Fourth 251,920 149,199 102,721
N 1,056,918 628,982 427,936Spillovers in Prices 911
Mei Foo Sun Chuen are sold for a total transaction value of 45.2 billion HKD (5.76 billion
USD). The smallest estate in our sample of large estates, LaGrove, consists of only 542
units. During our sample period, 1,000 units in LaGrove are sold for a total transaction
value of 2.7 billion HKD (340 million USD).
Downloaded from https://academic.oup.com/rof/article/25/3/903/5924383 by Copenhagen Business School user on 20 May 2021
2.2 Haunted Houses
A haunted house is a house where an unnatural death occurred. Unnatural deaths include
accidents, murders, and suicides. To identify haunted houses, we rely on data from the
Coroner’s Court of Hong Kong, which details all unnatural deaths in Hong Kong. As cur-
rent research focuses on the largest 211 estates, we extract haunted houses only in these
estates from the territory-wide databases of unnatural deaths from the Coroner’s Court
using a name-matching algorithm. Further, we manually confirm that the haunted houses
picked up by the name-matching algorithm do indeed belong to the 211 estates. We obtain
1,032 records of haunted houses in the 211 largest estates from 2000 to 2015.
We also collect data from property information websites and real-estate agents in Hong
Kong that spend effort compiling databases on haunted houses. Property websites maintain
their databases by tracking local news and make their data publicly accessible online to at-
tract browsing flow. We draw from four of the websites with the most extended and most
detailed lists.9 Online Appendix B1 gives a screenshot of one of these websites—
Squarefoot—where the first page shows the tab called “Haunted House” and the second
page gives the list of haunted houses. Online Appendix B2 gives a screenshot of another of
these websites—Spacious—where the first page shows the tab called “Haunted houses,”
the second page shows a spooky ghost, and the third page shows the exact location of a
haunted house. We merge this data set with our data from the Coroner’s Court and find
that 898 out of 1,032 (87%) haunted houses have data that are publicly available.
An important point to make here is that although the real-estate websites give us the
names and addresses of the haunted estates and the haunted blocks, there is little informa-
tion on haunted units. The purpose of the websites is to allow prospective buyers to assess
whether a specific block in an estate contains a haunted unit or not. To identify haunted
units, prospective buyers have to ask their real-estate broker, who keeps a register of these
haunted units. The “Code of Conduct” issued by the Estate Agency Authority (EAA)—a
statutory body formed to regulate real-estate agencies in Hong Kong—requires agencies to
give an answer to an unambiguous question, including questions about addresses of
haunted houses.10 We contacted one such broker, Ricacorp, on August 16, 2017, to obtain
09 The first is property.hk, the second is Squarefoot, the third is hk-compass.com, and the fourth is
Spacious. The respective URLs of the four haunted house lists are: http://www.property.hk/un
lucky.php, http://www.squarefoot.com.hk/haunted, http://www.hk-compass.com/badfile.php, and
https://www.spacious.hk/en/hong-kong/resources/tragic-events.
10 We quote a relevant paragraph from the website of the Estate Agency Authority: “Whether an es-
tate agent has a duty to disclose to the buyer that the property he intends to buy was previously
involved in a murder or is a ‘haunted flat’ depends on the circumstances of the case. Generally
speaking, if you have not made direct enquiries with your agent or if the agent does not know or
could not have known that such things ever happened in the property, the agent has not breached
the Code of Ethics. Therefore, the EAA would like to remind you that if you are concerned about
whether the flat you intend to buy is ‘haunted’, you should ask the agent or the vendor through
the agent. . . . You should ask, for example, whether a suicide or homicide took place in the flat912 U. Bhattacharya et al.
their register of haunted houses. Ricacorp kindly declined our request, because we were not
prospective buyers asking about a specific location. We therefore obtained data from the
Coroners Court to ensure that we systematically identify haunted units.
Panel A of Table II classifies these 1,032 haunted houses according to the type of unnat-
ural death that caused the house to become haunted. Suicides are the major reason that a
Downloaded from https://academic.oup.com/rof/article/25/3/903/5924383 by Copenhagen Business School user on 20 May 2021
house becomes haunted (88% of our sample). Accidents (7% of the sample) are the second
most common cause. Murders, on the other hand, account for only 2% of our sample. The
residual 7% are classified as miscellaneous. This classification is important because, as we
will see later, though the negative spillover effect is greatest for murder, it exists for all
other classifications as well.
Panel B of Table II documents that in our sample most haunted houses are in New
Territories. Panel C of Table II shows that the flow of haunted houses into our panel data
set from 2000 to 2015 has no particular trend over the years. Finally, Panel D of Table II
shows the number of transactions that occur after a house becomes haunted. We report the
number of transactions involving: (i) haunted units (the unit where the death occurred),
(ii) haunted floors (units on the same floor as the haunted unit, excluding the haunted unit),
(iii) haunted blocks (units in the same block as the haunted unit, excluding the haunted unit
and haunted floor), and (iv) haunted estates (units in the same estate as the haunted unit,
excluding the haunted unit, haunted floor, and haunted block). Panel D shows that a sig-
nificant number of transactions (around one-third) are of haunted units or occur in haunted
floors, haunted blocks, or haunted estates.
3. Spillover in Prices
Table III reports the average transaction price per square foot before and after a unit
becomes haunted. Panel A shows the average transaction price in HKD per square foot for
transactions occurring one year before to one year after, whereas Panels B and C report the
same for the period of two and three years before and after, respectively. To control for
time trends in prices, we also report the average transaction price per square foot in the
same district in the same period, and provide a difference-in-differences estimate of the ef-
fect of haunted houses on the price per square foot.11
before, and not use vague terms, such as whether the flat is ‘haunted’ or ‘cursed’.” (https://
www.eaa.org.hk/en-us/Consumer-Corner/Frequently-Asked-Questions).
11 Online Appendix Figure C1 reports the distribution of the price per square foot three years before
and three years after a unit becomes haunted. We note that the distributions are similar before
the unnatural death, but different after the unnatural death. In particular, after the unnatural death,
the distribution of prices for haunted units are to the left of the distribution of prices in the control
group, and that this difference is larger for haunted units, followed by haunted floors, haunted
blocks, and haunted estates. Collectively, Online Appendix Figure C1 shows that our results are
not driven by outliers. Online Appendix Table C2 compares house characteristics of units, floors,
blocks, and estates that sell before the unnatural death to the average unit in the same district.
We report the following house characteristics that we have data on: Price, Size, Price per square
foot, Age, and New unit indicator and Carpark indicator. The only significant differences between
units that will become haunted and units that will not become haunted are that the former are
smaller in size and transaction price—though price per square foot is about the same—and have
fewer carparks.Spillovers in Prices 913
Table II. Sample of haunted houses
We report the composition of the sample of haunted houses in large estates between 2000 and
2015. A house becomes haunted if a murder, suicide, accident, or some other unnatural death
occurs. Panel A reports the distribution of unnatural deaths by cause. Panel B reports the distri-
Downloaded from https://academic.oup.com/rof/article/25/3/903/5924383 by Copenhagen Business School user on 20 May 2021
bution of unnatural deaths by territory (i.e., region). Panel C reports the distribution of unnatural
deaths by year. Panel D reports the number of transactions involving: haunted units, units on
the haunted floor (excluding the haunted unit), units in the haunted block (excluding the
haunted floor), units in the haunted estate (excluding the haunted block), and non-haunted
units.
N %
A. Cause of death
Murder 21 2.0
Suicide 910 88.2
Accident 73 7.1
Other 28 2.7
B. Territory
Hong Kong Island 199 19.3
Kowloon 246 23.8
New Territories 587 56.9
C. Year
2000 56 5.4
2001 70 6.8
2002 69 6.7
2003 90 8.7
2004 73 7.1
2005 70 6.8
2006 61 5.9
2007 47 4.6
2008 64 6.2
2009 62 6.0
2010 61 5.9
2011 48 4.7
2012 63 6.1
2013 73 7.1
2014 71 6.9
2015 54 5.2
N 1,032 100
D. Transactions
Haunted units 761 0.1
Haunted floors 3,606 0.3
Haunted blocks 99,258 9.4
Haunted estates 267,816 25.3
Non-haunted 685,477 64.9
N 1,056,918 100914
Table III. Difference-in-differences estimates of haunted house effects on price per square foot
This table reports the average price per square foot before and after a unit becomes haunted. Panel A shows the average transaction price per square foot for
transactions occurring one year before to one year after, whereas Panels B and C report the same for the period of two and three years before and after, re-
spectively. We report the effect for haunted units, units on the haunted floor (excluding the haunted unit), and units in the haunted block (excluding the haunted
floor). To control for time trends in prices we also report the average transaction price per square foot in the same district, and provide a difference-in-differen-
ces estimate of the effect of haunted houses on the price per square foot.
Window Unit Floor Block
Price per square foot % Price per square foot % Price per square foot %
Haunted District Difference Haunted District Difference Haunted District Difference
A. One year before to one year after
Before 4,898 5,245 –7% 5,196 5,534 –6% 5,335 5,632 –5%
After 4,785 5,717 –16% 5,151 5,569 –8% 5,401 5,788 –7%
Difference –2% 9% –11% –1% 1% –1% 1% 3% –2%
B. Two years before to two years after
Before 5,028 5,172 –3% 4,987 5,286 –6% 5,205 5,458 –5%
After 4,587 5,512 –17% 5,196 5,746 –10% 5,500 5,897 –7%
Difference –9% 7% –15% 4% 9% –5% 6% 8% –2%
C. Three years before to three years after
Before 5,182 5,203 0% 4,961 5,234 –5% 5,199 5,401 –4%
After 4,668 5,627 –17% 5,188 5,771 –10% 5,502 5,927 –7%
Difference –10% 8% –18% 5% 10% –6% 6% 10% –4%
U. Bhattacharya et al.
Downloaded from https://academic.oup.com/rof/article/25/3/903/5924383 by Copenhagen Business School user on 20 May 2021Spillovers in Prices 915
We notice from Panel A that the affected unit decreases in price by 2% from one year
before to one year after the unit becomes haunted. This is much lower than for units in the
district as a whole, where prices rise by 9% from one year before to one year after.12 The
difference-in-differences is 11%. The ripple effect can be seen if we look at floors. The
affected floor—here we remove the affected unit from the floor—decreases in price by 1%
Downloaded from https://academic.oup.com/rof/article/25/3/903/5924383 by Copenhagen Business School user on 20 May 2021
from one year before to one year after the floor becomes haunted. This is lower than for the
floors in the district as a whole, where prices rise by 1% from one year before to one year
after. The difference-in-differences is 1% (rounding off error). The affected block—here
we remove the affected floor from the block—increases in price by 1% from one year be-
fore to one year after the floor becomes haunted. This is slightly lower than for the blocks
in the district as a whole, where prices rise by 3% from one year before to one year after.
The difference-in-differences is 2%.
The ripple effect continues to be seen in Panel B (two years before to two years after-
ward). The difference-in-differences is 15% for the unit, 5% for the floor, and 2% for
the block. The ripple effect continues to be seen in Panel C (three years before to three years
afterward). The difference-in-differences is 18% for the unit, 6% for the floor, and
4% for the block. In addition, by comparing Panels A–C, we observe that the price drops
are not temporary for the affected units, floors, or blocks. They do not recover even after
three years.
While Table III provides descriptive statistics that suggest that haunted houses have
negative spillover effects on nearby houses, we caution against making strong conclusions
based on the preliminary evidence. Table III just provides a simple comparison of the price
per square foot of units that are becoming haunted with the price per square foot of un-
affected units in the same district without controlling for determinants of house prices. To
formally estimate the relationship between the prices of houses and their characteristics, we
use a hedonic regression that is typically used in the academic real-estate literature. We use
all transactions during our sample period and include unit fixed effects to ensure that we
track the house price development of the same unit around the unnatural death. This is dif-
ferent from Table III, which compares the average price of any unit that is sold in a short-
time window either before or after the unnatural death.
The hedonic regression for estimating the haunted house price is specified in Equation
(1), where the dependent variable is the log of the transaction price per square foot, yit, of
unit i in year-month t
yit ¼ ai þ bt þ c0 Xit þ h0 Hit>k þ it : (1)
Here, ai captures unit fixed effects, bt is a vector of year-month fixed effects, Xit is a vec-
tor of unit characteristics that change over time, and Hit>k is a vector of indicators denoting
an unnatural death occurring in year k, where t > k. The purpose of k is to differentiate the
year of an unnatural death from that of the time of the transaction. Any unnatural death be-
fore the transaction of unit i in year-month t will make Hit>k equal one. Unit characteristics
that change over time in our sample are interior size (due to alterations) and block age. We
12 As shown in Figure 2, houses prices go up by a factor of three from 2000 to 2015. The 9% increase
in non-haunted units in a given district reflects this overall time trend in house prices in Hong
Kong during the sample period. Note that trends in house prices are absorbed by time fixed
effects in the main specification, and by local-time fixed effects in Table X. Thus, spillovers in pri-
ces are not an artifact of time trends in house prices.916 U. Bhattacharya et al.
are also interested in two other unit characteristics: whether the transaction is of a new unit
(primary transaction) and whether the transaction includes allocated space in the carpark.
The inclusion of unit fixed effects implies that we estimate the effect of haunted houses
using a repeat sales approach, which is common in real-estate economics. Our sample con-
sists of 615,998 units and 1,056,918 transactions; this implies that the average unit is sold
Downloaded from https://academic.oup.com/rof/article/25/3/903/5924383 by Copenhagen Business School user on 20 May 2021
1.7 times. Around 45% of the units are sold more than once (see distribution in Appendix
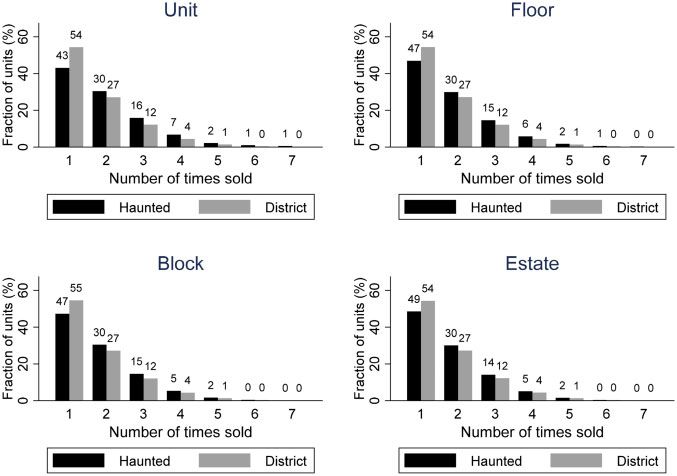
Figure C3); 717,565 out of 1,056,918 transactions (68%) are repeat sales. Figure 3 plots
distributions of the number of times a unit is sold during the sample period from 2000 to
2015 for haunted units, haunted floors, haunted blocks, and haunted estates, and compare
them to the distributions for units in the same district. We note that haunted houses are
more likely than non-haunted houses to have repeat sales, but that the distributions are
similar conditional on having a repeat sale. While we address concerns about general selec-
tion into repeat sales in Column (5) of Table IV, we acknowledge that our empirical specifi-
cations cannot address concerns about differential selection into repeat sales for haunted
and non-haunted houses.
In our main specifications, we cluster standard errors at the estate level. Online
Appendix C5 shows that we obtain consistent results when we alternatively cluster at the
unit or block level, the block-year-month, or the estate-year-month level.
The indicators in the vector Hit>k are the following. “Haunted unit” is an indicator for
haunted units (units in which an unnatural death occurred). “Haunted floor” is an indica-
tor for units on the same floor as the haunted unit, but is set to zero for the haunted unit.
“Haunted block” is an indicator for units in the same block as the haunted unit. It is set to
the count of the number of haunted units in the block, but is set to zero for haunted units
and units on a haunted floor. “Haunted estate” is an indicator for units in the same estate
as the haunted unit. It is set to the count of the number of haunted units in the estate, but is
set to zero for haunted units, units on the haunted floor, and units in the haunted block.
“Same block, proximity to haunted floor (one to three floors)” is an indicator for units that
are one to three floors above or below a haunted floor in a haunted block. “Same block,
proximity to haunted floor (four–six floors)” is an indicator for units that are four–six
floors above or below a haunted floor in a haunted block. “Same estate, neighbor to
haunted block” is an indicator for units that are in a block that is the neighbor to a haunted
block.
Notice that the indicator variable is 1 or 0 for units or floors, but the indicator variable
is the count or 0 for blocks or estates. The reason for this is that in our sample, though there
is no more than one haunted unit per floor, there is sometimes more than one haunted unit
per block, and sometimes more than one haunted unit per estate. Since the effects of
haunted units occurring over time in a block or estate may cumulate, we use the count to
ameliorate this.
The coefficients of interest in Equation (1) are the different h coefficients. A negative h
reveals the discount for being haunted, and if negative, the magnitude of h reveals the per-
centage discount. As our empirical strategy relies on repeat sales through the inclusion of
unit fixed effects, it follows that we identify the effect of haunted houses on prices, h, in a
setting that compares the house price development of units that became haunted to the
house price development of houses that are sold at the same time, but that did not become
haunted.
Table IV, which is the main table of this paper, shows the results of the above estima-
tion. Column (1) reveals that the haunted unit drops in price by 19.9% after it becomesSpillovers in Prices 917
Downloaded from https://academic.oup.com/rof/article/25/3/903/5924383 by Copenhagen Business School user on 20 May 2021
Figure 3. Fraction of units with repeated sales 2000–2015. This figure plots distributions of the number
of times sold during the sample period from 2000 to 2015 for haunted units, haunted floors, haunted
blocks, and haunted estates, and compares them to the distributions for units in the same district.
haunted; the units on the affected floor—here the affected unit is excluded from the affected
floor—drop in price by 9.7%; the units in the affected block—here the affected floor is
excluded from the affected block—drop in price by 7.1%; and units in the affected estate—
here the affected block is excluded from the affected estate—drop in price by 1.4%. Notice
that all price drops, though statistically significant, diminish in magnitude as we move geo-
graphically outward from the affected unit. This confirms the ripple effect documented in
Table III.
To ensure that the estimated spillover effects do not pick up trends in house prices, we
change the specification in Column (1) of Table IV to an event study by including pre-trend
indicators for haunted units, floors, blocks, and estates that are sold in each of the three
years before the unnatural death occurs as well as indicators for haunted units, floors,
blocks, and estates that are sold 1, 2, 3, and >3þ years after the unnatural death. Figure 4
plots the coefficients from the event study in four panels: one for units, floors, blocks, and
estates, respectively. Each of the four panels compares the estimated pre-trend in prices to
the estimated spillover effects after the unnatural death. The panels show no pre-trend in
house prices and large spillovers in prices after unnatural deaths. To address the concern
that the event study in Figure 4 lacks statistical power, we supplement the analysis with an
event study that aggregates the pre-trends into indicators for transactions three years before
the unnatural death, and include them in our main specification with indicators for transac-
tions after the unnatural death. Appendix Figure C4 confirms the conclusion from Figure 4
with greater statistical power. We therefore conclude that the estimated spillover effects do
not pick up pre-trends in house prices.918 U. Bhattacharya et al.
Table IV. Spillover effects of haunted houses on price
This table shows the spillover effect of haunted houses on transaction prices. The dependent
variable is the log of transaction price per square foot. In Columns (1)–(4), the sample consists
of transactions in all estates, whereas the sample in Column (5) only consists of new estates
Downloaded from https://academic.oup.com/rof/article/25/3/903/5924383 by Copenhagen Business School user on 20 May 2021
that were constructed during the sample period. Haunted unit is an indicator for haunted units
(units in which an unnatural death occurred). Haunted floor is an indicator for units on the
same floor as the haunted unit, but is set to zero for the haunted unit. Haunted block is an indi-
cator for units in the same block as the haunted unit. It is set to the count of the number of
haunted units in the block, but is set to zero for haunted units and units on a haunted floor.
Haunted estate is an indicator for units in the same estate as the haunted unit. It is set to the
count of the number of haunted units in the estate, but is set to zero for haunted units, units on
the haunted floor, and units in the haunted block. Same block, proximity to haunted floor (one–
three floors) is an indicator for units that are one–three floors above or below a haunted floor in
a haunted block. Same block, proximity to haunted floor (four–six floors) is an indicator for
units that are four–six floors above or below a haunted floor in a haunted block. Same estate,
neighbor to haunted block is an indicator for units that are in a block that is the neighbor to a
haunted block. Size is the size of the unit measured in square feet. Age is the block age meas-
ured years. New unit is an indicator for primary transactions. Carpark is an indicator for
whether the transaction includes allocated space in the carpark. All specifications include unit
fixed effects and year-month fixed effects. Column (5) also includes unit transaction sequence
fixed effects. Standard errors are clustered at the estate level, and reported in parentheses. ***,
**, and * indicate statistical significance at the 1%, 5%, and 10% level, respectively.
Sample All estates New
estates
(1) (2) (3) (4) (5) (6)
Haunted unit –0.1988*** –0.1986*** –0.1913*** –0.1910*** –0.2021*** –0.1916***
(0.0295) (0.0296) (0.0281) (0.0282) (0.0277) (0.0461)
Haunted floor –0.0974*** –0.0971*** –0.0897*** –0.0894*** –0.0970*** –0.0799**
(0.0226) (0.0226) (0.0211) (0.0211) (0.0208) (0.0321)
Haunted block –0.0714*** –0.0678*** –0.0657*** –0.0622*** –0.0675*** –0.0419*
(0.0166) (0.0166) (0.0151) (0.0151) (0.0159) (0.0216)
Haunted estate –0.0139*** –0.0140*** –0.0128*** –0.0129*** –0.0130*** –0.0143*
(0.0039) (0.0039) (0.0041) (0.0041) (0.0036) (0.0087)
Same block, proximity –0.0213** –0.0206** –0.0183
to haunted floor
(one–three floors)
(0.0095) (0.0095) (0.0136)
Same block, proximity –0.0142 –0.0135 –0.0090
to haunted floor
(four–six floors)
(0.0090) (0.0089) (0.0128)
Same estate, neighbor –0.0195 –0.0195 –0.0218
to haunted block
(0.0185) (0.0185) (0.0221)
Size –0.0002 –0.0002 –0.0002 –0.0002 –0.0002 –0.0002
(0.0001) (0.0001) (0.0001) (0.0001) (0.0001) (0.0001)
Age –0.0067 –0.0066 –0.0062 –0.0061 –0.0006 0.0131
(0.0171) (0.0171) (0.0171) (0.0171) (0.0176) (0.0197)
New unit 0.1608*** 0.1608*** 0.1625*** 0.1626*** 0.1689*** 0.1006***
(0.0183) (0.0183) (0.0181) (0.0181) (0.0177) (0.0173)
(continued)Spillovers in Prices 919
Table IV. Continued
Sample All estates New
estates
(1) (2) (3) (4) (5) (6)
Downloaded from https://academic.oup.com/rof/article/25/3/903/5924383 by Copenhagen Business School user on 20 May 2021
*** *** *** ***
Carpark 0.0515 0.0514 0.0514 0.0514 0.0543*** 0.0597*
(0.0190) (0.0190) (0.0190) (0.0190) (0.0184) (0.0339)
Unit fixed effects Yes Yes Yes Yes Yes Yes
Unit transaction sequence No No No No Yes No
fixed effects
Year-month fixed effects Yes Yes Yes Yes Yes Yes
Adjusted R2 0.979 0.979 0.979 0.979 0.980 0.983
N 1,056,918 1,056,918 1,056,918 1,056,918 1,056,918 368,394
Figure 4. Pre-trends in house prices of haunted houses. This figure reports coefficients from an exten-
sion of Equation (1) to include pre-trends in house prices for haunted houses. To capture pre-trends,
we include indicators for units, floors, blocks, and estates that are sold in years 3, 2, and 1 before
the unnatural death, and compare the estimated coefficients to coefficients on indicators for haunted
units, haunted floors, haunted blocks, and haunted estates that are sold in years þ1, þ2, þ3, and >þ3
after the unnatural death. We report the estimated coefficients and the corresponding standard errors
in four panels focusing on units, floors, blocks, and estates, respectively.
Column (2) shows an even more granular spiral effect. The haunted unit drops in price
by 19.9% after it becomes haunted; the units on the affected floor drop in price by 9.7%;
the units on floors one–three floors above or below the affected floor drop in price by 8.9%
(6.8 þ 2.1%); the units in the affected block drop in price by 6.8%; and units in the affected
estate drop in price by 1.4%.920 U. Bhattacharya et al.
Column (3) tries to show another geographical spiral effect. It shows that the units in
the block that is the neighbor of the haunted block drop in price by 3.3% (1.3 þ 2%), but
this number is not statistically significant.
Column (4) brings all these indicators together. We find that the haunted unit drops in
price by 19.1% after it becomes haunted; the units on the affected floor drop in price by
Downloaded from https://academic.oup.com/rof/article/25/3/903/5924383 by Copenhagen Business School user on 20 May 2021
8.9%; the units on floors one–three floors above or below the affected floor drop in price
by 8.3% (6.2 þ 2.1%); the units in the affected block drop in price by 6.2%; the units in
the affected estate drop in price by 1.3%.
As mentioned above, the estimated spillover effects of haunted houses are estimated
using a repeat sales approach. This raises a concern about sample selection bias if the likeli-
hood of repeat sales depends on the development of house prices. To address this concern,
we include unit transaction sequence fixed effects in Column (5) of Table IV. These fixed
effects control the number of the transaction sequence of each unit, implying that we esti-
mate spillover effects while holding constant the general selection into repeat sales. We
note that the estimated spillover effects in Column (5) are consistent with those in Column
(1), implying that the estimated spillover effects are not an artifact of general selection into
repeat sales.13 We note from Figure 3 that haunted houses are more likely than non-
haunted houses to have repeat sales, but that the distributions are similar conditional on
having a repeat sale. We acknowledge that our empirical specification in Column (5) of
Table IV can only address concerns about general selection into repeat sales, but not differ-
ential selection into repeat sales for haunted and non-haunted houses.
As our sample of unnatural deaths that cause houses to become haunted begins in 2000,
it is possible that the estimated spillover effects are biased because unnatural deaths before
2000 are unobserved and these may have spillover effects of their own. Column (6) corrects
for this potential source of bias by restricting the sample to only new estates that are con-
structed during the sample period. By definition, new units start the count at zero when
they enter our sample, ensuring that our methodology correctly counts the number of
haunted units within an estate for this sample. As can be seen in Column (6), though our
sample size is much smaller, our results do not qualitatively change.
To conclude, a unit becoming haunted has a significant price drop, both economically
and statistically. More importantly, price drops are seen for all units that are close to the
haunted unit. The closer is the unit, the larger is the price drop.
The fact that the negative externality dissipates away within an estate suggests that local
conditions in Hong Kong like economic hardship and crime are unlikely to be responsible.
Alternate explanations like economic hardship or crime would predict a common discount
across units, floors, and blocks within an estate. Our main specification shows that haunted
units are selling at larger discounts than haunted floors, which in turn are selling at larger
discounts than haunted blocks, which in turn are selling at larger discounts than haunted
estates. We also address this last concern in Table X where we add high-dimensional loca-
tion-time fixed effects.
The coefficients on Age, New unit, and Carpark have the expected signs. Older units are
valued less, new units are valued more, as are units with carparks. The inclusion of unit
13 Consistent with a positive selection into repeat sales, we note that the estimated unit transaction
sequence fixed effects are positive and increasing with the transaction sequence number. For in-
stance, the second (third) transaction of a unit sells at 6.5% (12.5%) higher prices compared with
the first transaction of the same unit.Spillovers in Prices 921
fixed effects takes care of all time-invariant unit characteristics. The year-month fixed
effects control for all market-wide demand and supply shocks over time.
Although Table IV does show the ripple effect, it does not show whether the price drops
are temporary or persistent. To understand this, we estimate the equation
Downloaded from https://academic.oup.com/rof/article/25/3/903/5924383 by Copenhagen Business School user on 20 May 2021
yit ¼ ai þ bt þ c0 Xit þ h0 Hit>k þ k0 Time Hit>k þ it : (2)
Equation (2) is the same as Equation (1) with one extra term added: the interaction be-
tween Time and Hit>k . Here, Time is the difference between the transaction date and the
date when the unit becomes haunted, that is, Time equals t–k measured in years.14 For the
interaction with haunted block and haunted estate, we use the timing of the last event
whenever there are multiple haunted units in a block or estate. The coefficients of interest
in Equation (2) are the different k coefficients. A positive k reveals that prices of discounted
haunted houses recover over time, and if positive, the magnitude of k reveals the speed of
recovery.
Table V shows the results of the above estimation. Column (1), which includes the entire
sample, reveals that the price of the haunted unit does not seem to recover at all. Notice
that the coefficient on the interaction term is 0.0053 and statistically insignificant. The
affected floor—here the affected unit is excluded from the affected floor—does seem to re-
cover about 0.37% per year after an immediate price drop of 10.5%. The recovery is very
slow. The affected block where the affected floor is excluded, and the affected estate where
the affected block is excluded do not seem to recover either. In fact, the coefficients are
negative, suggesting there are further discounts as time goes by. This means that the dis-
counts are not temporary, a result indicated by the difference-in-differences estimates docu-
mented in Table III. Column (2), which includes only new estates, has similar results. In an
unreported regression, we have further examined whether the spillover effects are persistent
across transactions. Thus, rather than interacting the haunted house indicators with time
[as in Equation (2) above], we interact the haunted house indicator with the transaction
number sequence (after becoming haunted). We find results of similar magnitude, suggest-
ing that price recovery over time and transactions is indeed slow.
It would be interesting to know which cause of death is associated with the largest drop
in price, and which cause of death has the highest spillover effect on prices. The answers
are given in Table VI. The numbers in Table VI come from the same estimation of Equation
(1), except now the regressions are run for sub-samples related to the cause of death.
Table VI shows that murder has the most adverse effect on the price of a unit: the house
price drops by 34.4% [see Column (3) of Table VI]. Murder also has the most negative ad-
verse effect on neighboring house prices. This is in line with the principles of Feng Shui.
According to real-estate agents, it is commonly believed murder is worse than suicide.15
The units on the affected floor drop in price by 19.2%, the units in the affected block drop
14 As Equation (2) is estimating whether spillover effects of haunted houses decay, Time is always
zero for units that are not haunted.
15 See media coverage in Reuters, June 28, 2018: “Spooked no more? Hong Kong’s ‘haunted apart-
ment’ prices levitate with white-hot market” (https://www.reuters.com/article/us-hongkong-prop-
erty-haunted-insight/spooked-no-more-hong-kongs-haunted-apartment-prices-levitate-with-white
-hot-market-idUSKBN1JO01O) and New York Times, November 16, 2016: “House-hunting in Hong
Kong with the app that sees dead people” (https://www.nytimes.com/2016/11/24/world/asia/hong-
kong-haunted-apartments-app.html).You can also read