THE CORNERSTONE OF NEXT GENERATION MOBILITY - February 2021
←
→
Page content transcription
If your browser does not render page correctly, please read the page content below
THE CORNERSTONE
OF NEXT GENERATION MOBILITY
February 2021
Disclaimer
This presentation (the “presentation”) is provided for informational purposes only and has been prepared to assist interested parties in making their own evaluation with respect to a potential business combination between REE Automotive Ltd. (“REE”) and 10X
Capital Venture Acquisition Corp (“10X”) and related transactions (the "Transaction") and for no other purpose.

No Representations and Warranties
This presentation is for informational purposes only and does not purport to contain all of the information that may be required to evaluate the Transaction. This presentation is not intended to form the basis of any investment decision and does not constitute
investment, tax or legal advice. No representation or warranty, express or implied, is or will be given by 10X or REE or any of their respective affiliates, directors, officers, employees or advisers or any other person as to the accuracy or completeness of the
information in this presentation or any other written, oral or other communications transmitted or otherwise made available to any party in the course of its evaluation of a possible transaction between 10X and REE and no responsibility or liability whatsoever is
accepted for the accuracy or sufficiency thereof or for any errors, omissions or misstatements, negligent or otherwise, relating thereto. The information contained in this presentation is preliminary in nature and is subject to change, and any such changes may be
material. 10X and REE disclaim any duty to update the information contained in this presentation. Viewers of this presentation should each make their own evaluation of REE, 10X and the Transaction and of the relevant and adequacy of the information contained
herein and should make such other investigations as they deem necessary.

Forward-Looking Statements
This presentation includes “forward-looking statements” within the meaning of the “safe harbor” provisions of the Private Securities Litigation Reform Act of 1996. 10X’s and REE’s actual results may differ from their expectations, estimates and projections and
consequently, you should not rely on these forward-looking statements as predictions of future events. Words such as “expect”, “estimate”, “project”, “budget”, “forecast”, “anticipate”, “intend”, “plan”, “may”, “will”, “could”, “should”, “believes”, “predicts”,
“potential”, “continue”, and similar expressions are intended to identify such forward-looking statements. These forward-looking statements include, without limitation, 10X’s and REE’s expectations with respect to future performance and anticipated financial
impacts of the Transaction, the satisfaction of closing conditions to the Transaction and the timing of the completion of the Transaction. These forward-looking statements involve significant risks and uncertainties that could cause the actual results to differ
materially from the expected results. Most of these factors are outside 10X’s and REE’s control and are difficult to predict. Factors that may cause such differences include, but are not limited to: (1) the outcome of any legal proceedings that may be instituted
against 10X or REE following the announcement of the Transaction; (2) the inability to complete the Transaction, including due to the inability to concurrently close the business combination and the private placement of common stock or due to failure to obtain
approval of the stockholders of 10X; (3) delays in obtaining, adverse conditions contained in, or the inability to obtain necessary regulatory approvals or complete regular reviews required to complete the Transaction; (4) the risk that the Transaction disrupts current
plans and operations as a result of the announcement and consummation of the Transaction; (5) the inability to recognize the anticipated benefits of the Transaction, which may be affected by, among other things, competition, the ability of the combined company
to grow and manage growth profitably, maintain relationships with customers and suppliers and retain its key employees; (6) costs related to the Transaction; (7) changes in the applicable laws or regulations; (8) the possibility that the combined company may be
adversely affected by other economic, business, and/or competitive factors; (9) the impact of the global COVID-19 pandemic; and (10) other risks and uncertainties indicated from time to time described in 10X's registration on Form S-1, the proxy statement relating
to the Transaction, including those under “Risk Factors” therein, and in 10X’s other filings with the U.S. Securities and Exchange Commission (“SEC”). 10X and REE caution that the foregoing list of factors is not exclusive and not to place undue reliance upon any
forward-looking statements, including projections, which speak only as of the date made. Neither 10X nor REE undertakes or accepts any obligation to release publicly any updates or revisions to any forward-looking statements to reflect any change in its
expectations or any change in events, conditions or circumstances on which any such statement is based.

Industry and Market Data
In this presentation, 10X and REE rely on and refer to publicly available information and statistics regarding market participants in the sectors in which REE competes and other industry data. Any comparison of REE to the industry or to any of its competitors is based
on this publicly available information and statistics and such comparisons assume the reliability of the information available to REE. REE obtained this information and statistics from third-party sources, including reports by market research firms and company filings.
While REE believes such third-party information is reliable, there can be no assurance as to the accuracy or completeness of the indicated information. Neither REE nor 10X has independently verified the information provided by the third-party sources.

Trademarks
This presentation may contain trademarks, service marks, trade names and copyrights of other companies, which are the property of their respective owners. Solely for convenience, some of the trademarks, service marks, trade names and copyrights referred to in
this presentation may be listed without the TM, SM © or ® symbols, but 10X and REE will assert, to the fullest extent under applicable law, the rights of the applicable owners, if any, to these trademarks, service marks, trade names and copyrights.

                   Confidential and Proprietary Information                                                                                                                                                                                                                 2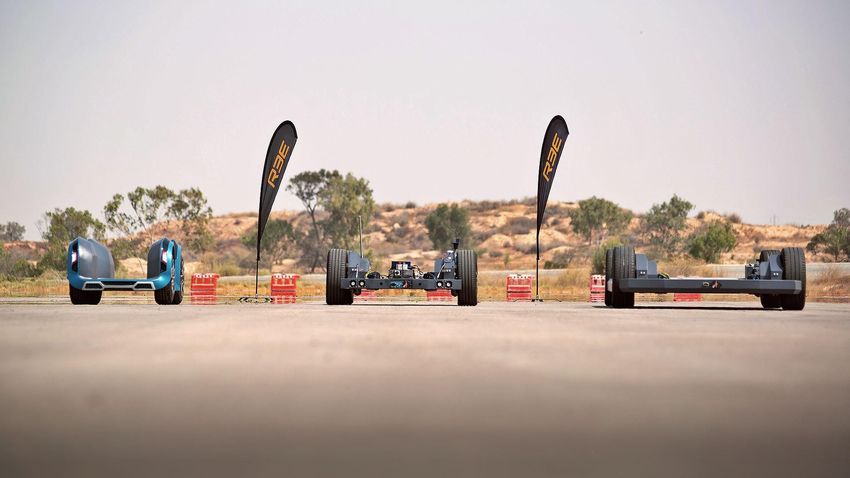
.
Disclaimer (Cont’d)
Additional Information
In connection with the proposed transaction, REE will file with the Securities and Exchange Commission (“SEC”) a registration statement on Form F-4 that will include a proxy statement of 10X in connection with 10X’s solicitation of proxies for the vote by 10X’s
shareholders with respect to the proposed transaction and other matters as may be described in the registration statement. REE and 10X also plan to file other documents with the SEC regarding the proposed transaction and a proxy statement/prospectus will be
mailed to holders of shares of 10X’s Class A ordinary shares. BEFORE MAKING ANY VOTING OR INVESTMENT DECISION, INVESTORS ARE URGED TO READ THE FORM F-4 AND THE PROXY STATEMENT/PROSPECTUS REGARDING THE PROPOSED TRANSACTION AND ANY OTHER
RELEVANT DOCUMENTS CAREFULLY IN THEIR ENTIRETY WHEN THEY BECOME AVAILABLE BECAUSE THEY WILLCONTAIN IMPORTANT INFORMAT10X ABOUT THE PROPOSED TRANSACTION. The proxy statement/prospectus, as well as other filings containing information
about REE and 10X will be available without charge at the SEC’s Internet site (http://www.sec.gov). Copies of the proxy statement/prospectus can also be obtained, when available, without charge, from REE’s website at https://ree.auto/. Copies of the proxy
statement/prospectus can be obtained, when available, without charge, from 10X’s website https://www.10xspac.com/.

Participants in the Solicitations
REE, 10X and certain of their respective directors, executive officers and other members of management and employees may, under SEC rules, be deemed to be participants in the solicitation of proxies from 10X’s shareholders in connection with the proposed
transaction. You can find more information about 10X’s directors and executive officers in 10X’s final prospectus dated November 24, 2020 and filed with the SEC on November 25, 2020. Additional information regarding the participants in the proxy solicitation and a
description of their direct and indirect interests will be included in the proxy statement/prospectus when it becomes available. Shareholders, potential investors and other interested persons should read the proxy statement/prospectus carefully when it becomes
available before making any voting or investment decisions. You may obtain free copies of these documents from the sources indicated above.

No Offer or Solicitation
This communication does not constitute an offer to sell or the solicitation of an offer to buy any securities, or a solicitation of any vote or approval, nor shall there be any sale of securities in any jurisdiction in which such offer, solicitation or sale would be unlawful
prior to registration or qualification under the securities laws of any such jurisdiction. No offering of securities shall be made except by means of a prospectus meeting the requirements of section 10 of the Securities Act, or an exemption therefrom.

Financial Information
The financial information contained in this presentation has been taken from or prepared based on the historical financial statements of REE for the periods presented. An audit of these financial statements is in process. Accordingly, such financial information and
data may not be included in, may be adjusted in or may be presented differently in any proxy statement to be filed with the SEC by 10X in connection with the Transaction.

Use of Projections
This presentation also contains certain financial forecasts, including projected revenue. Neither 10X’s nor REE’s independent auditors have studied, reviewed, compiled or performed any procedures with respect to the projections for the purpose of their inclusion in
this presentation, and accordingly, neither of them expressed an opinion or provided any other form of assurance with respect thereto for the purpose of this presentation. These projections are for illustrative purposes only and should not be relied upon as being
necessarily indicative of future results. In this presentation, certain of the above-mentioned projected information has been provided for purposes of providing comparisons with historical data. The assumptions and estimates underlying the prospective financial
information are inherently uncertain and are subject to a wide variety of significant business, economic and competitive risks and uncertainties that could cause actual results to differ materially from those contained in the prospective financial information.
Projections are inherently uncertain due to a number of factors outside of 10X’s or REE’s control. Additionally, the projections are based on current platform designs and if new platform designs are developed and/or implemented there is no assurance that the
projections presented herein will be applicable. Accordingly, there can be no assurance that the prospective results are indicative of future performance of the combined company after the Transaction or that actual results will not differ materially from those
presented in the prospective financial information. Inclusion of the prospective financial information in this presentation should not be regarded as a representation by any person that the results contained in the prospective financial information will be achieved.

Use of Non-GAAP Financial Measures
This presentation includes non-GAAP financial measures, such as EBITDA, Capex and Free Cash Flow. EBITDA is defined as net earnings (loss) before interest expense, income tax expense (benefit), depreciation and amortization. Free Cash Flow is defined as EBITDA
less Capex and Investment in Working Capital.10X and REE believe that these non-GAAP measures are useful to investors for two principal reasons: 1) these measures may assist investors in comparing performance over various reporting periods on a consistent basis
by removing from operating results the impact of items that do not reflect core operating performance; and 2) these measures are used by REE’s management and board of directors to assess its performance and may (subject to the limitations described below)
enable investors to compare the performance of REE and the combined company to its competition. 10X and REE believe that the use of these non-GAAP financial measures provides an additional tool for investors to use in evaluating ongoing operating results and
trends. These non-GAAP measures should not be considered in isolation from, or as an alternative to, financial measures determined in accordance with GAAP. A reconciliation of non-GAAP financial measures in this presentation to the most directly comparable
GAAP financial measures is not included, because, without unreasonable effort, REE is unable to predict with reasonable certainty the amount or timing of non-GAAP adjustments that are used to calculate these forward-looking non-GAAP financial measures. The
non-GAAP financial measures included in this presentation may not be comparable to similarly-titled measures presented by other companies.

                    Confidential and Proprietary Information                                                                                                                                                                                                                          3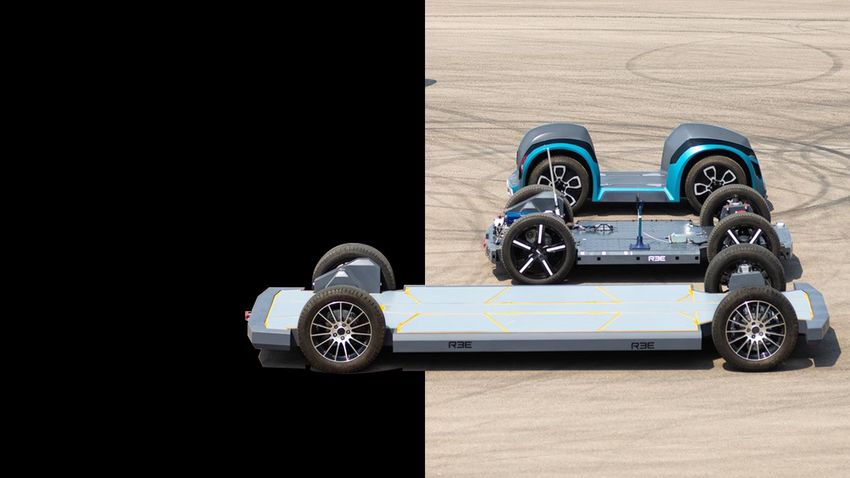
REE and 10X Combine to Create the Cornerstone of Electric Mobility
Highly differentiated from other EV offerings in the market

Transaction Structure
- On February 3, 2021, REE and 10X entered into a business combination agreement
- Transaction is expected to close by end of Q2 2021
- It is anticipated that the post-closing company, REE, will be listed on Nasdaq

Valuation
- Transaction implies a fully distributed pro forma enterprise value of $3.1 billion, representing
  multiples of 0.6x EV / 2025E revenue and 3.5x EV / 2025E EBITDA1
- Highly attractive entry point relative to EV ecosystem

Capital Structure
- Transaction is expected to result in $501 million of total gross proceeds raised to fund growth2,3
       - Based on $201 million in cash from 10X's trust account and a $300 million PIPE
- Transaction expected to fully fund business model through cash flow positive
- All-primary transaction; existing REE shareholders, including management, are rolling all their
  equity and collectively are expected to own 83.8% of the pro forma company at closing2
- Co-founders to hold 10x voting Class B ordinary shares granting each up to 39% voting power in the
  company (assuming no redemptions)

            Confidential and Proprietary Information   (1)   These projections are for illustrative purposes only and should not be relied upon as being necessarily indicative of future results. Metrics that are considered non-GAAP financial measures are   4
                                                             presented on a non-GAAP basis without reconciliations of such forward-looking non-GAAP measures. For more information about non-GAAP financial measures, see slide 3
                                                       (2)   Assumes no redemption by 10X Capital’s existing stockholders
                                                       (3)   Does not include fees and expenses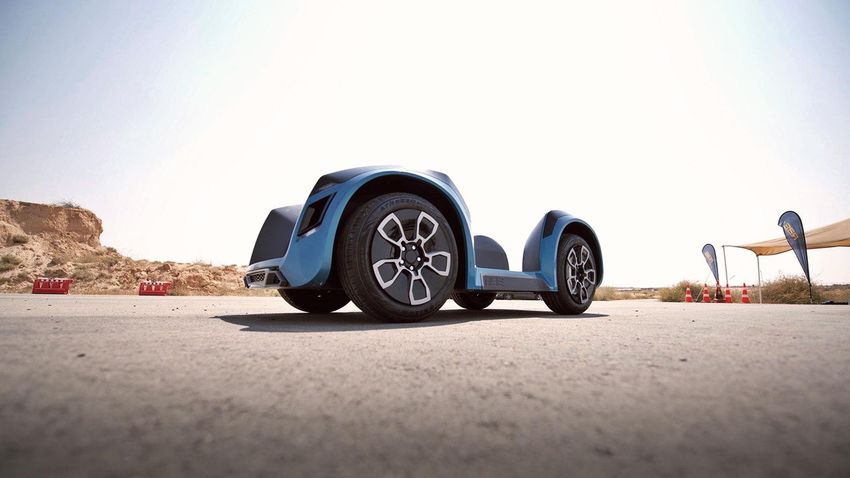
Combined Leadership Well Positioned to Accelerate Transition to EV and Autonomous Vehicles
Experienced & Entrepreneurial REE Management Team

            Daniel                                               Ahishay                                                  Michael-John                                                Keren                                               Hai                                            Angelique
            Barel                                                Sardes                                                   Charlton                                                    Shemesh                                             Aviv                                           Strong Marks
            Co-Founder & CEO                                     Co-Founder & CTO                                         COO                                                         CMO                                                 CFO                                            General Counsel
            -   Visionary leader and                             -   15+ years of experience                              -    25+ years experience                                  -    20+ years experience                            -   15+ years of experience                     -      25+ years experience
                serial entrepreneur
                                                                 -   Leadership R&D roles at                              -    Led global production                                 -    Led global B2B high-                            -   Prior public CFO roles:
                                                                     multinational                                                                                                                                                                                                        -      Chief Legal Officer at
            -   Founder, SoftWheel                                                                                             expansion & plant                                          tech companies
                                                                     technology companies                                                                                                                                                     @BeyondAir $XAIR                                   multiple multinational
                & SpecterX                                                                                                     establishment
                                                                                                                                                                                                                                              @Babylon    $BBYL                                  corporations
                                                                                                                               @Tenneco and ZF

Global Talent Pool fusing Auto & Tech expertise, from:

Highly Successful 10X Investment Team

            Hans Thomas                                                                 Oliver Wriedt                                                                       David Weisburd                                                                   Guhan Kandasamy
            CEO & Chairman                                                              President &                                                                         COO & Head of Origination                                                        CFO
                                                                                        Head of Capital Markets
            -   Founder @ 10X                                                                                                                                               -    Co-Head of Venture Capital                                                   -   Chief Credit Officer @ 10X
                                                                                        -    25+ Years Experience                                                                @ 10X
            -   20+ Years Wall St. & Silicon Valley                                                                                                                                                                                                           -   18Year track record
                                                                                        -    CEO @Vibrant Capital $7.3Bn AUM                                                -    Founder, Growth Technology                                                       @Fannie Mae, DBRS,
            -   Entrepreneur, VC + SPAC investor                                                                                                                                 Partners (acquired by 10X)                                                       CoreLogic, Opera/Electrif.ai
            -   Featured in Bloomberg, WSJ, etc.                                        -    Co-CEO @CIFC $30Bn AUM
                                                                                                                                                                            -    Partner, Flight Ventures                                                     -   MBA Finance from Oxford
                                                                                        -    Partner @GoldenTree $40Bn AUM

Selected Portfolio Companies1:

                Confidential and Proprietary Information   (1)   List is representative & not exhaustive. Includes investments & transactions attributable to SPAC management & board, and in cases of SPACs, on target & acquirer side                                                                          5
Option 1
Investment Thesis                                                                                                                   REE/10X: WIP
The cornerstone of next generation electric mobility

 Tailwinds
 - Trillion dollar1 global market undergoing rapid transformation
 - Regulatory environment; maturing technology; consumer behavior

 Team
 - Entrepreneurial & industry experienced

 Technology: The Corner
 - Elegant, disruptive – with 60+ patents
 - Differentiated offering – superior platform offering

 TAM: Largest2 in Peer Group
 - Best approach: Horizontal B2B business model
 - Scalable, Capex-light model
 - Completes other EV makers and suppliers, doesn’t compete

 Traction / Go-to-Market Momentum
 - Starting in highly profitable market segment
 - Blue-Chip strategic partners, customers, investors
 - Significant signed demand

 Highly Differentiated from other EV Offerings
 - REE’s tech & business model are agnostic to who or what wins, as market develops
       - Battery vs. Fuel Cell
       - Autonomous vs. Human Driven
       - Startups vs. Incumbents (RE: OEMs, Manufacturers or component suppliers)
 - Real, essential Tech. Real, diverse Market Validation. Real Competitive Moat

            Confidential and Proprietary Information (1)   Based on REE’s average selling price and Frost & Sullivan Forecast   6
                                                     (2)   See slide: Unique Technology & Go-To-Market Strategy Relative to
                                                           New Mobility Players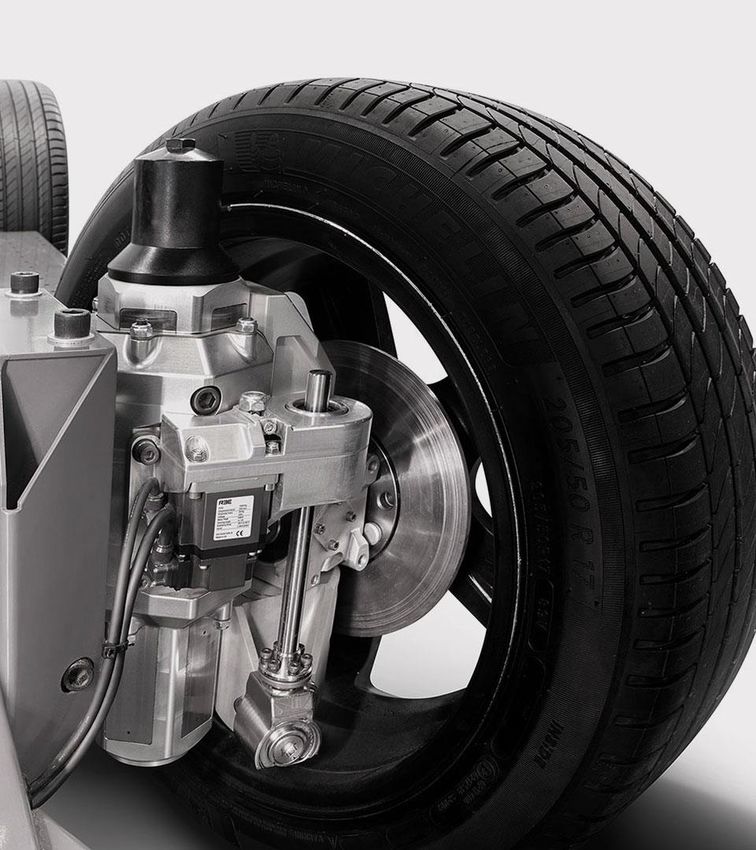
REE’s Vision
        We strive to be the cornerstone on top of which mobility players can
        build their dreams of future services, unbound by legacy thinking, as
        we carry the next generation of electric and autonomous vehicles on a
        truly modular and scalable platform

Confidential and Proprietary Information                                        7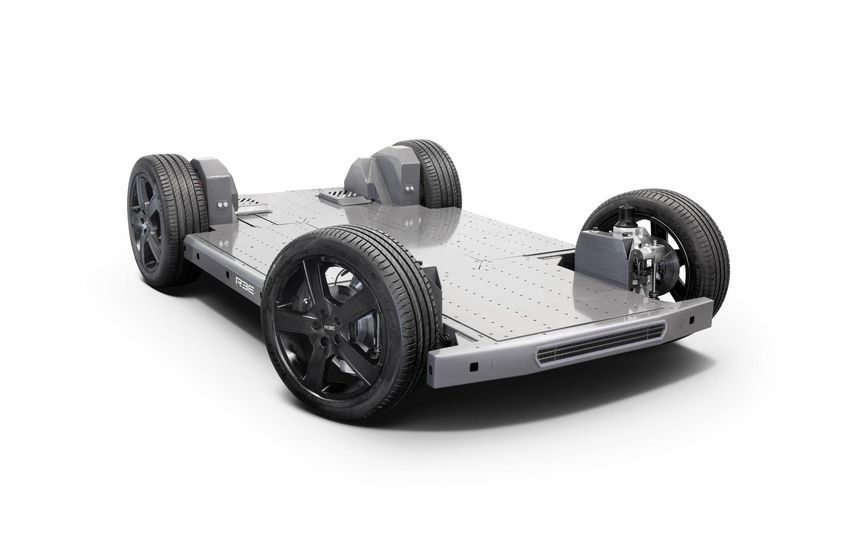
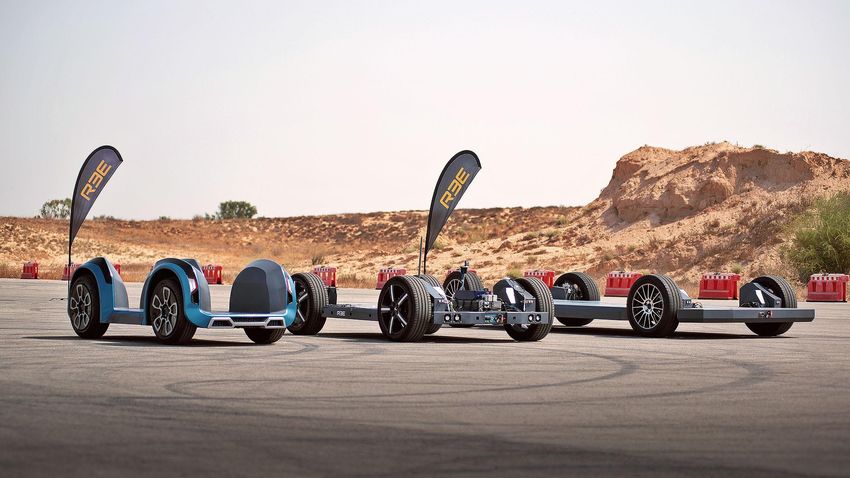
REEcorner
The cornerstone of next generation electric mobility

        Modularity
         - Modular vehicle architecture (supports a wide variety of size, weight and bodies)
         - Power source agnostic (BEV or FCEV)
         - In house development of single wheel X-by-wire technology (SBW, BBW, DBW)
         - Low center of gravity, smaller footprint and more space1

        Serviceability
         - Superior total cost of ownership (TCO)2
         - Minimal downtime with quick REEcorner replacements
         - Upgradeable via OTA (over the air)

        Smart Corners
         - Advanced data collection and analytics
         - Preventative maintenance AI
         - Autonomous-ready
         - Fail operational, full redundancy without a single point of failure

        Meets Zero-Emission Regulations

             Confidential and Proprietary Information (1)   Based on current REE design and REE internal research team   8
                                                      (2)   See slide: Superior Total Cost of Ownership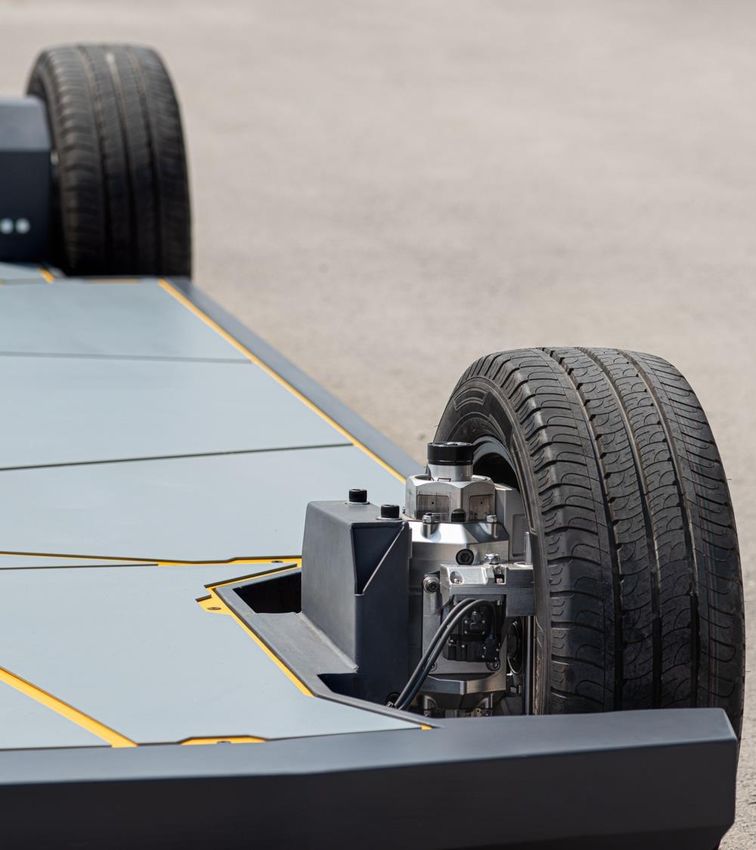
Play video

             9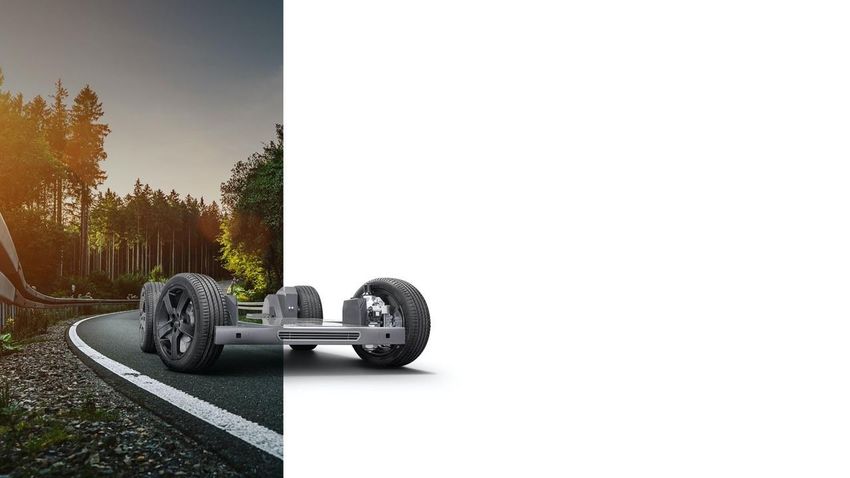
From Vision
to Reality
Disruptive technology behind a modular EV platform
to carry the future of electric mobility

     Play video

 Confidential and Proprietary Information            10
REE's Cornerstone Solution1
Horizontal player for maximum addressable market
Only fully horizontal player2
• The largest addressable market
• Unified and complete full system solution
• Can collaborate with a variety of market players
Confidential and Proprietary Information (1) Based on publicly available information, based on US classification 11
(2) See slide: Unique Technology & Go-To-Market Strategy Relative to New Mobility PlayersREE’s Innovative Platform Serves $700Bn+1 Total Addressable Market (TAM)
Significant growth expected in each of REE’s target opportunities2
Scalable Modular Architecture Supports All Mission Specific EVs TAM Breakdown1
Passenger
Vehicles: 60%
MD Truck / EV Bus
Autonomous
$700Bn+1 Delivery: 4%
Total Market
Light Commercial
Opportunity Vehicles: 6%
E-LCV / EV Shuttle
Mid Duty Commercial
Vehicles: 2%
E-Shuttles and Robotaxi
Mid Mile Delivery / MaaS: 28% 34.7
29.3
24.3
19.1
Robo Taxi / PV 15.3
13.1
9.3
6.4
4.4
3.1
Last Mile Delivery
2021E 2022E 2023E 2024E 2025E 2026E 2027E 2028E 2029E 2030E
1
Total EV TAM (Units in Millions)
Confidential and Proprietary Information (1) Based on REE’s average selling price and Frost & Sullivan Forecast 12
(2) Based on Frost & Sullivan Forecast
(3) These projections are for illustrative purposes only and should not be relied upon as being necessarily indicative of future resultsOur Partners & Investors 1
Key Strategic Partners & Cooperation Highlights
One of the largest EV manufacturers with a unique cost structure and global footprint.
MOU to explore strategic collaboration of jointly developed all-electric commercial
vehicles for global markets.
OEM Partnership
Targeting global volumes of 200,000 to 250,000
Hino Motors is the medium and heavy-duty truck arm of Toyota, and a leader in MaaS & eLCV units, the Strategic MOU Collaboration with
electrification. Announced cooperation at the Tokyo Motor Show 2019. Mahindra leverages REE’s corner module and
modular platform technology and Mahindra’s
vehicle design, engineering, sourcing capability
and manufacturing assets.
KYB is a top 5 Tier-1 supplier of shock absorbers, air suspension and power steering
systems. Partnership to develop suspension capabilities.
Maxion Wheels is one of the world's largest wheel manufacturer and a leader in truck
chassis systems. Partnership to co-develop and manufacture exclusive wheel design and
chassis solutions.
Key Strategic Investors & Partners
American Axle & Manufacturing is a global Tier-1 supplier in driveline, powertrain, and
OEM Cooperation
casting technologies.
Mitsubishi Corporation is Japan's largest trading company. Business, partnerships and The idea of the Flatformer concept was initiated
marketing cooperation. by Hino Motors, one of the leading truck
manufacturers in the world, to deliver optimized
space, flexibility and energy efficiency to
Musashi Seimitsu is one of the world’s largest powertrain manufacturer and is partially customers. With a shared vision of creating a
sustainable future, REE’s and Hino Motors’
owned by Honda Motor Co., Ltd. Announced collaboration on a foundation for future
cooperation was showcased in the FlatFormer
electric vehicles at Frankfurt Motor Show 2019. modular concept model, a super-flexible chassis
that optimizes electric mobility solutions.
Confidential and Proprietary Information (1) Represents both recent and current cooperation activities and/or strategic partners. Companies information based on publicly available information 13REE’s Strategic Integration Center Plan1
Globally Distributed Integration Centers
2021-2023 Plan Annual Capex Spend2 ($ in Millions)
Set-up of Integration Centers
Tooling & Other Capex
$335
$214
1 U.S.A.
$126
3 Japan $57
$22 $26
2021 2022 2023 2024 2025 2026
2 Germany
Expected Integration Center Capacity (Units in Thousands) 600
New Capacity
440
Existing Capacity
Land & Building:
43%
280
̵REE will assemble components at its integration
centers, thus reducing Capex requirements Other: 160
23%
$15M Total
̵Expect to have a network of 15 integration Cost per IC2 80
40
centers by 2026 with annual capacity of ~600k
units
Assembly & Testing: 2021 2022 2023 2024 2025 2026
33% New
Facilities 1 1 2 3 4 4
Confidential and Proprietary Information (1) Cost, timing and locations represent management expectation and are subject to change. These projections are for illustrative purposes only and should not be relied upon as being necessarily indicative of future results 14
(2) Includes Capex for machinery and tooling, R&D engineering centers, replacement and refurbishment, and otherStrong and Diverse Customer Pipeline1
Total Pipeline Revenue by Stage ($ in Billions)2 Cumulative 2021E – 2026E Revenue By Stage2
• $19Bn+ total cumulative revenue by 2026
10.4 Signed MOUs
– Signed MOUs represent $5.1Bn of total Signed MOUs
$5.1Bn / 27%
cumulative revenue by 2026, or 27% of total Advanced Pipeline
cumulative revenue
5.7
– $14.0Bn in Advanced Pipeline stage by 2026
– Partners include leaders in EV and autonomous
2.7
driving across Automotive, Logistics, and Mobility Advanced Pipeline
/ Technology $14.0Bn / 73%
0.3
2023 2024 2025 2026
• Additional early-stage customers represent Total: $19.1Bn
significant upside potential
Cumulative 2021E – 2026E Revenue by Segments2 Cumulative 2021E – 2026E Units By Stage2
Mobility as a Service (MaaS) Autonomous Delivery
Signed MOUs
10% 15%
260K / 35%
Mid Duty Commercial
Vehicles
18%
Light Commercial Advanced
Vehicles Pipeline
Delivery Vans and Trucks 27% 477K / 65%
29%
Total: $19.1Bn Total: 737K Units
Confidential and Proprietary Information (1) MOUs may be modified or canceled pursuant to their terms. The Advanced Pipeline reflects initial revenue indications from potential customers and not contractual commitments. Actual sales may differ materially from projected volume 15
(2) These projections are for illustrative purposes only and should not be relied upon as being necessarily indicative of future resultsUnique Technology & Go-To-Market Strategy Relative to New Mobility Players
Revenues Pre revenue Pre revenue Pre revenue Pre revenue Pre revenue Pre revenue Pre revenue Pre revenue
# of platforms 3 2 2 1 1 1 1 1
2 1
260,000 20,000 116,000 10,000 14,600 1,500 100,000
Orderbook (NA)
($5.1Bn) by 2026 ($1.2Bn) (NA) (~$0.4Bn) ($10.2Bn) (~$0.3Bn) (~$5Bn)
Israel, US, US, UK, Germany,
Global footprint US US US, UK US, EU US, Canada US
UK, Germany Russia, Netherland
Addressable Class 1-6 Class 2 & 7 Class 2 & 3 Class 1 Class 1 Class 7-8 Class 8 Class 2
5 4 4
market $700Bn $430Bn NA $51Bn NA $700Bn $94Bn $65Bn
Strategic
cooperation
Tech adaptation
3 3 3 3 3 3 3
Enterprise value $3.1Bn $16.9Bn ~$27.6Bn $3.2Bn $4.1Bn $8.1Bn $2.8Bn $4.2Bn
Confidential and Proprietary Information Source: Capital IQ, Pitchbook, S&P Global Market Intelligence, Investor Presentations, Company Filings, Company Website and Public Sources. (1) Includes option to order additional 10,000 units. (2) Potential opportunities based on current agreements 16
and advance pipeline, see slide: Strong and Diverse Customer Pipeline. (3) Canoo, Fisker, Nikola, Hyliion, and Lordstown market data as of February 1, 2021. Arrival valuation based on CIIG Merger Corp (NASDAQ: CIIC) and Rivian valuation based on
estimated ~$25 billion valuation in latest financing round in process reported in January 2021 and an additional $2.65 billion in funding raised subsequently from a group of investors led by T. Rowe Price Group Inc. (4) Primary market TAM. Canoo and
Lordstown data from investor presentations. (5) Based on REE’s average selling price and Frost & Sullivan Forecast 2030E TAMIndustry Disruptor Positioned For Long-Term and Sustainable Growth
REE will be the cornerstone for future electric vehicles
Scalable and modular corner technology for broad range of EV and AD vehicles
- Massive and rapidly growing TAM
- 3.1MM units today, projected to grow to 13.1MM in 2025 and 34.7MM in 20301
Unique horizontal approach and rapid platform development cycle
- Developing 5 functional platform classes for multi-segment coverage, from Class 1 to Class
6 vehicles
- Power agnostic (BEV & FCEV)
Groundbreaking and proprietary technology (REEcorner)
- 60+ patents across design, component engineering & software
Strong pipeline from leading automotive, logistics and technology companies 2
- Over $19.1Bn cumulative revenue opportunity by 2026 from OEMs, logistics and technology
companies
Capex light and flexible manufacturing approach
- Supported by global automotive Tier 1 network
- >30% gross margins
- Start of Production (SOP) 2023 CY3
Compelling growth, margins, and cash flow profile with significant upside potential
Strong leadership team
- Proven execution track record
- Diverse talent pool combining automotive and tech
- Team locations: US, Israel, Germany and the UK
Confidential and Proprietary Information (1) Based on F&S forecast, total global EV market 17
(2) See slide: Strong and Diverse Customer Pipeline
(3) See slide: REE’s Strategic Integration Center PlanxUnique and Compelling Business Model Confidential and Proprietary Information 18
REE's Cornerstone Solution To Power Mission Specific Applications 1

                                        Logistics & Cargo Applications                                                                                                                                                   Mobility as a Service Applications

                                                                                                                                              $700Bn+2
                                                                                                                                             Total Market
                                                                                                                                             Opportunity

                                                                                                                                                                                                                                                                        22,822

                           1,700                                                       1,634

                                                                                                                                                                                                                                         8,403                2,739
            61                                                     220                                                              27                     183                                                     47

              AD Last Mile                                                 E-LCV                                                          MD Truck                                                        E-Shuttle, Robo Taxi, MaaS                             Passenger

                                                                                                                                                                                                     2021           2030
*Units in Thousands

                  Confidential and Proprietary Information   (1)   Based on Frost & Sullivan Forecast. These projections are for illustrative purposes only and should not be relied upon as being necessarily indicative of future results                                      19
                                                             (2)   Based on REE’s average selling price and Frost & Sullivan Forecast
REE Offers a Unique Value Proposition to OEMs
Integration of REEcorner modules into OEM flat EV platforms enables fast and efficient entry to EV markets
Cost Efficiencies Short Time to Market Incremental Revenue
Seamless integration of OEM technology Short design, development and assembly Scalable and modular platform technology
and supply chain (ie battery, body, etc) cycle, enables agile reactions to evolving for maximum market coverage, enabling
business models, market opportunities, entrance into new segments and services
regulations and competitive actions
Minimized in-house development Integrated powertrain components & Complements OEM transitions to software and
for resource and Capex savings control systems, pre-certified for safety service monetization, supporting incremental
application layers with REE’s network of
partner experts
Superior Design for Manufacturing & Adoption of REE technology can facilitate Integrated DaaS capabilities for Aftersales
Design for Serviceability for reduced ADAS Technology implementation through revenue and service offerings
vehicle assembly and aftersales costs to Level 5
Confidential and Proprietary Information 20REE Offers a Unique Value Proposition to Service Providers (MaaS & Logistics)
REEcorner technology enables the development of mission specific vehicles, allowing mobility players and service providers to concentrate on core areas of expertise.
Service Providers must no longer be limited to off the shelf offerings
Modularity Functionality Lower TCO and Cost Efficiencies
Any level of customized body, Best-in-Class1 functional capabilities across Optimized Design for Serviceability and corner
functionality, ADAS capability and segments and classes – cargo space, swap capabilities enable low MTTR2, minimal
service layers for mission specific battery capacity agnostic of type, spare part inventories due to maximum
applications at required quantities ergonomics, maneuverability and payload common components, and longer lifecycles via
upgradeable corners and bodies
Platforms capable of supporting more Robust data collection capabilities and Operational efficiencies from a single global
than one body for multi purpose units network of partner experts for DaaS strategy - wide fleet implementation with
- maximum uptime, usage, and layers comprehensive unmatched preventative
revenue generation maintenance AI and OTA upgrades
Facilitates comprehensive global Future proofed – modular and highly Industry's flattest3 platform enables much
strategies – core component and functional technology allows for more room for passengers, cargo and
system commonalities yet optimized upgradeable corners and additional layered batteries (longer ranges for fewer routes)
for local market regulations & needs services to meet evolving needs
Confidential and Proprietary Information (1) Based on publicly available information and statistics regarding Class 2 Vehicles in the sectors in which REE competes 21
(2) Mean time to repair
(3) Based on publicly available information and statistics regarding market participants in the sectors in which REE competesBest-In-Class Specifications Across e-LCV Classes1
Class 2 Vehicles
More Cargo Volume & Cargo Volume per meter length – carries more, less routes
REEcorner & Control technology enables the most
functional vehicles across key segments.
15
13.8
2.68
10.7 11 2.4
1.79 1.81
6
1.17
Cargo Volume (m3) Cargo Volume / Length (m3/m)
Minimal Turning Radius – better maneuverability, Low Step Height – better ergonomics for driver, more Max Battery Capacity – longer distance
drivability in urban areas cargo volume for a given vehicle height capabilities for more transactions / route
15.7 72.9 80
13.6 61.5 67
12.9 12.9 55.7
45
40
41
36 35
5.8
Turning Radius (m) Step in Height (cm) Max Battery Capacity (kWh)
Confidential and Proprietary Information (1) Based on publicly available information and statistics regarding market participants in the sectors in which REE competes. REE information based on current class 2 design 22Short and Mid Haul Comparison - Powered by REEcorners1
Length Cargo Volume
Sprinter 144’’
5,925mm 10.5m2
Mercedes
eSprinter 6,088mm 11.0m
Short haul
2,500
powered by REE 5,600mm 15.0m2
8% 36%
2,040 5,600
Shorter2 more space2
Length Cargo Volume
Sprinter 7,360mm 15.5m2
170’’
Mid haul
powered by 6,900mm 20m2
2550
REE
6% 29%
Shorter2 more space2 6900
2040
Confidential and Proprietary Information (1) Based on publicly available information and statistics regarding market participants in the sectors in which REE competes. REE information based on current Mid and Short haul design 23
(2) Compared to Mercedes eSprinterSuperior Total Cost of Ownership
Vehicle
̵Superior footprint, weight, cargo volume and payload
attributes
̵Better maneuverability & faster parking Total Cost of Ownership1
̵Extra space to carry more goods per route $269,210
̵Low center of gravity
̵Flexible battery packaging for maximum range
$144,545
Maintenance Costs
̵Quick REEcorner replacements – efficient module swaps for
reduced Mean Time to Repair (MTTR) $91,250
̵Reduced scheduled maintenance via Preventative
$73,915
Maintenance AI $118,770
$109,565
̵Minimal downtime
REE P4 Electric Next Gen Electric Diesel REE P7 Electric Electric Diesel
Power and Infrastructure
2023 CY 2023 CY 2021CY 2023 CY 2021 CY 2021CY
̵Power agnostic (BEV or FCEV) $0.20/km $0.25/km $0.40/km $0.30/km $0.33/km $0.74/km
̵Modular pack configurations
Class 2 Vans Class 4 Vans
̵Fast and smart charging
19% reduction from new generation EV Vans 8% reduction from EV Vans
49% reduction from traditional Diesel Vans 59% reduction from traditional Diesel Vans
Lifecycle
̵Built to last, >12 year lifecycles
̵Body can be rebuilt without changing corners
̵Power source upgradeable over time
̵Component and function upgrades over time
Confidential and Proprietary Information (1) Assumes 36,500 km in operation per year for a 10 year period 24
Total Cost of Ownership includes purchase price + energy cost + infrastructure cost + maintenance cost less residual value. Competitor data based on publicly available information and statistics regarding market participants in the sectors in
which REE competes and analyzed by REE internal research team. Diesel vehicle compliant with Euro 6 standardsAttractive Single Platform Unit Economics
Platform 4T – Up to 4-ton Bill of Materials at Mass Production1
Light-Duty Commercial Vehicle
$6,312
$2,668
$5,764
~ 36%
$25,000 Gross Profit Margin
$1,295
$8,961
2
Gross Revenue Platform Front Corners Rear Corners Labor & Others Platform Gross Profit
Total Vehicle Cost Comparable LCV MSRPs ($ in k)5
System Cost Volkswagen e-Crafter 5.5T $76
REE Platform $25,000
Mercedes eVito 3.2T $50
Battery3 $10,800
Body4 $9,600 Volkswagen ABT
$57
eTransporter 3.2T
Total Vehicle Cost $45,400
Master ZE 3.1T $67
(1) Example calculation based on current P4 platform
Confidential and Proprietary Information (2) Excludes drive motors and battery 25
(3) Estimated cost based on comparative LCV models. Assumes $180 / kWh
(4) Estimated cost based on comparative LCV models
(5) MSRP, excluding taxes and grants. Based on publicly available information and statistics regarding market participants in the sectors in which REE competeREEcorner Technology Confidential and Proprietary Information 26
Extensive IP Portfolio Across Design, Component Engineering & Software
+60 patents1
REEboard
̵Flat chassis
̵Control systems and electrification
REEcorner
̵High performance compact suspension
̵Extended steering per volume
̵In-corner brake system
̵Integrated powertrain
REEboard + REEcorner
̵Interfaces to external & remote systems
̵Redundancy and safety
̵Smart Service & Maintenance AI with OTA
̵Operational Synergy between REEcorners updates
̵Energy efficiency & performance ̵Smart corners
̵Modularity ̵Efficient off-vehicle servicing
̵Fast replacement and activation
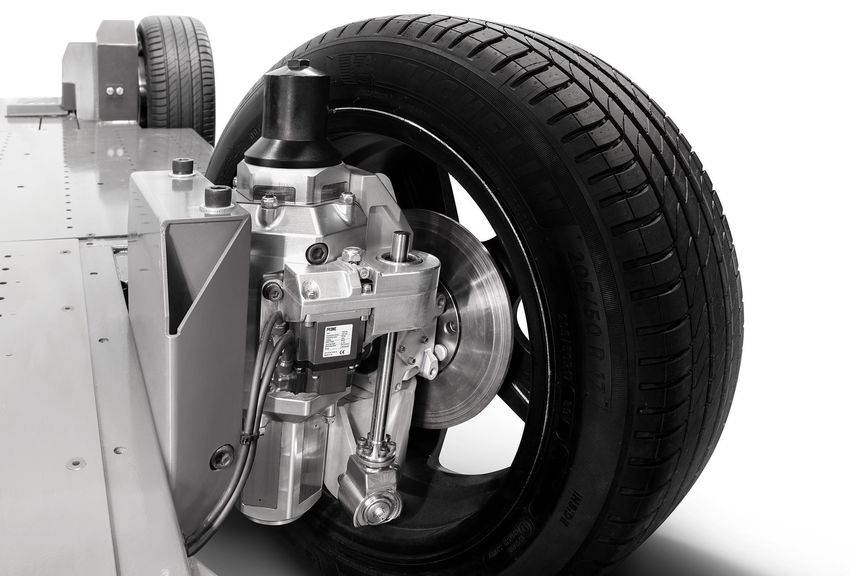
Confidential and Proprietary Information (1) Pending and granted patents 27Smart REEcorner – Unique Design with a Focus on Performance and Safety
REEcorner
̵All components housed in the wheel arch; pre-certified for safety
Sub-Frame
̵On-board e-motor fixed to chassis allows rotation at high speeds, leading to better
driving efficiencies and safety (protected high voltage lines in the chassis)
Damper & spring
Gear
Single Wheel X-by-Wire Technology
̵Full SBW/BBW/DBW
̵Improved vehicle dynamics from independent wheel control (steering, braking, torque)
e-Motor
̵Perfect Ackermann geometry adjusts for different speeds, vehicle slip angles and
various conditions
̵Maintains adjustability of KPI angles (camber, caster, scrub radius, kingpin angle, etc.)
̵AD ready
̵Fully Redundant Systems with data gathering capabilities
On-board braking system
̵Robust encrypted communications Torque transfer
Confidential and Propriety Information 28Smart REEcorner – Unique Design with a Focus on Performance and Safety
Zone Architecture & Enhanced ESP
̵REEcenter ECU is the primary “brain” of the platform, controlling all corner
level functions
̵REEcorner ECUs individually control all braking, steering, & traction components for Best-
in-Class ESP, logging all sensor data for offline or cloud-based analysis
Autonomous Ready
̵Single wheel XBW (Drive/Steer/Brake) Architecture
̵State-of-the-art safety redundancies in case of failure
Data Logging
̵All data collected uses a separate protected CAN
̵Malware attacks blocked via proprietary protocols
ISO 26262 ASIL D Pre-Certified
̵ISO’s 26262 V-model compliant from design to validation
̵TÜV ASIL D certification in process
Preventative Maintenance AI & OTA Updates
̵Identification of malfunctions before they occur & instant failure reporting
̵Secured, hash key protected, over the air updates
̵Reduced maintenance costs –performing maintenance only when needed
Control Error + Status Power
Confidential and Proprietary Information 29REE’s Business and Operational Plan Confidential and Proprietary Information 30
Production Roadmap

                            2020                                                  2021                                                      2022                                                       2023                                                      2024

                            Q1           Q2           Q3            Q4            Q1             Q2            Q3             Q4            Q1             Q2             Q3            Q4             Q1            Q2             Q3            Q4             Q1            Q2   Q3         Q4

         Key Events
                                                                             1st Engineering Center                        First IC Established                        2nd IC Established                            3rd IC Established             4rt IC Established
                                                                                 Established - UK                                  U.S.                                    Germany                                         Japan                            TBD

 Engineering Design                                                 Product & systems engineering center driving customer program management & delivery

  Production Intent                                                                                                    Vendor Networks Validated

 Pilot Manufacturing                                                              Safe Launch factory and process template

         Purchasing         Vendor approval & RFQ                                 Samples                      Build 1                      Verify         Serial production supply and network optimization

                          Validation & Verification

   Proof of concept         Completed

   Design Validation                                  In progress

  Alpha Verification                                                                             EC Lead

   Beta Verification                                                                                                          EC Lead

     Pilot Capability                                                                                                                                      LFS

         Build Units                                                                                                                                                      OTOP                         Ramping globally 15k units                                Ramping Globally 110k units

           Confidential and Proprietary Information   (1)   Timing and locations represent management expectation and are subject to change. These projections are for illustrative purposes only and should not be relied upon as being necessarily indicative of future results                   31
Key Leadership
Daniel Barel Co-Founder & CEO Ahishay Sardes Co-Founder & CTO Hai Aviv CFO
̵Visionary leader and serial entrepreneur with a ̵15+ years of experience in leading multi-national R&D ̵15+ years of financial management experience
successful track record of building and leading teams
̵Previously served as CFO at Beyond Air (XAIR)
technology companies including SoftWheel, SpecterX ̵Deep knowledge and experience in mechanics, and Babylon Ltd (BBYL)
and CAUTES engineering and prototyping
̵CPA and holds B.A. in Business Accounting and
̵Strong foundation in Economics and Game Theory ̵Previously served in senior leadership roles at SoftWheel MBT in Business and Taxation
from the Hebrew University in Jerusalem and ZIV-AV Technologies
Michael-John Charlton COO Keren Shemesh CMO Ohad Stauber VP R&D
̵25+ years of experience in automotive operation & ̵20+ years of multidisciplinary experience in B2B marketing ̵Industry veteran with 20+ years technology
production experience, previously from Intel and OSR
̵ Served in various leadership roles in high-tech companies
̵Served as SVP for Tenneco Automotive, leading the global in telecom, IoT and IR4.0 ̵Experience leading engineering teams in high-
production expansion and plant establishment performance, results-driven environments
̵Holds a BSC in Electrical Engineering
̵Previously served as Lead Director at TRW Automotive ̵BSc from Technion, Israel Institute of Technology
and EMBA from Tel-Aviv University
Micha Risling VP BD Angelique Strong Marks General Counsel Limor Raz VP HR
̵20+ years experience in building and leading ̵25+ years of legal experience ̵Extensive HR management experience in leading
new organizations, geographies, products and tech companies
̵Strong automotive background at leading Tier1 companies
teams and previously served as Chief Legal Officer of four large ̵Planning & implementation of HR strategy focused on
̵Served as SVP Business Development, Product multinational corporations business objectives, global recruitment,
and Marketing and the Head of Automotive at organizational growth & performance management
̵Holds Juris Doctor, B.S in Finance and MBA in Finance and
Valens Management
Mati Shani VP Program Management Tali Miller Levin VP Corporate Development
̵20+ years of product and project management ̵20+ years of business development and managerial
experience. experience in telecom, hi-tech and environmental sectors
̵Served in global high-tech companies including ̵Strong background in M&A and financing
Innoviz, Nova and HP
̵BA in Economics from Tel Aviv University and MBA from
̵Expert at strategic planning, product and program INSEAD
management
Highly-experienced talent pool fusing auto and tech
Confidential and Proprietary Information 3210X Capital Has a Strong Track Record of Investing in Great Companies and SPACs
Hans Thomas CEO & Chairman Woodrow H. Levin Board Member SPAC / IPO Track Record1
- Founder @ 10X - Board Member: DraftKings 2
since 2013 (SPAC Exit 2020)
- 20+ Yrs. Wall St. & Silicon Valley
- Founder & CEO: Extend
- Entrepreneur, VC + SPAC investor 3
- Founder & CEO Estate Assist (acquired by
- Featured in Bloomberg, WSJ, etc. DocuSign)
David Weisburd COO & Head of Origination Chris Jurasek Board Member
- Co-Head of Venture @ 10X - 25+ Yrs. Tech Private Equity Leader
- Founder, Growth Technology Partners - Board Member: ConvergeOne
(acquired by 10X) (SPAC Exit 2018)
Selected Portfolio Companies4
- Partner, Flight Ventures - President, JetSmarter; CEO Eagleview
- Operating Executive, Clearlake
Oliver Wriedt President & Head of Capital Markets Ziggy Jonsson Board Member
- 25+ Years Experience - Senior Partner @ 1/0 Capital
- CEO @Vibrant Capital $7.3Bn AUM - Tech Founder @Better, Climb, Future
Finance & TheNumber
- Co-CEO @CIFC $30Bn AUM
- Former Head of Structured Credit @Bank of
- Partner @GoldenTree $40Bn AUM
America
Guhan Kandasamy CFO Gil Penchina Board Member
- Chief Credit Officer @ 10X - Investor: LinkedIn, Paypal, Fastly, Cruise
(acquired by GM), Rent the Runway, Discord,
- 17 Yr. track record @Fannie Mae, DBRS, CoreLogic,
Dollar Shave Club, Carta, Wealthfront
Opera/Electrif.ai
- Ran M&A and International expansion @eBay
- MBA Finance from Oxford
1998-2006
(1) Includes transactions attributable to SPAC management, board & sponsorship group, on target and acquirer side
Confidential and Proprietary Information (2) Biotech “two-step” APO reverse merger transaction 33
(3) Direct listing. NYSE:PLTR
(4) List is representative & not exhaustiveRobust Revenue Growth1,2
• $19Bn+ total cumulative revenue by 2026 Total Pipeline Revenue by Segments ($ in Billions)
– Signed MOUs represent $5.1Bn of total 10.4
cumulative revenue by 2026, or 27% of total Autonomous Delivery
cumulative revenue Light Commercial Vehicles
Delivery Vans and Trucks
– $14.0Bn in Advanced Pipeline stage by 2026
Mid Duty Commercial Vehicles 5.7
– Partners include leaders in EV and Mobility as a Service (MaaS)
autonomous driving across Automotive,
Logistics, and Mobility / Technology 2.7
• Additional early-stage customers represent 0.3
significant upside potential
2023 2024 2025 2026
Active Projects Highlights
Cumulative 2021E – 2026E Revenue by Segments Cumulative 2021E – 2026E Revenue By Stage
Number of
Segment
Projects Mobility as a Service
(MaaS) Autonomous Delivery
Signed MOUs
Autonomous Delivery 3 10% 15%
$5.1Bn / 27%
Light Commercial Vehicles 3 Mid Duty Commercial
Vehicles Light
Delivery Vans and Trucks 5 18% Commercial
Vehicles Advanced
Mid Duty Commercial 27% Pipeline
2 Delivery Vans and
Vehicles Trucks $14.0Bn / 73%
29%
Mobility as a Service (MaaS) 3
Total: $19.1Bn Total: $19.1Bn
Total 16
Confidential and Proprietary Information (1) MOUs may be modified or canceled pursuant to their terms. The Advanced Pipeline reflects initial revenue indications from potential customers and not contractual commitments. Actual sales may differ 34
materially from projected volume
(2) These projections are for illustrative purposes only and should not be relied upon as being necessarily indicative of future resultsAttractive Margin and Free Cash Flow Profile
Gross Profit ($ in Millions)1
31% 31%
3 ,9 95 3 5%
Gross Margin (%)
3 ,4 95
26% 3,247 3 0%
20%
2 ,9 95 2 5%
2 ,4 95 2 0%
- Reductions in material and labor / overhead as
1,757
1 ,9 95 1 5%
production volume increases
1 ,4 95
6% 1 0%
9 95
710 5%
- Leverage partner manufacturing capabilities
(2%) 70
1
4 95 0%
(0)
-5 - 5%
2021 2022 2023 2024 2025 2026
16% 1,693
2 ,0 00 .0 0 .1 8
EBITDA ($ in Millions)1 0 .1 6
1 ,5 00 .0 16% 0 .1 4
EBITDA Margin (%)
10%
0 .1 2
1 ,0 00 .0
904 0 .1
- Core technology has been already developed, limiting
ongoing R&D expenditures
0 .0 8
275
0 .0 6
5 00 .0
- Significant operating leverage from SG&A
0 .0 4
0 .0 2
0 .0
(6) 0
(42) (96) (2%) - 0. 02
- 50 0. 0 - 0. 04
2021 2022 2023 2024 2025 2026
Free Cash Flow ($ in Millions)1
770
9 50 .0
7 50 .0
5 50 .0
- REE only needs to assemble components at its
3 50 .0
307 Integration Centers, reducing Capex requirements
1 50 .0
- Cash flow positive by 2025
- 50 .0
- 25 0. 0
(64) (124) (100) (137)
2021 2022 2023 2024 2025 2026
Confidential and Proprietary Information (1) These projections are for illustrative purposes only and should not be relied upon as being necessarily indicative of future results. Metrics that are considered non-GAAP financial measures are presented 35
on a non-GAAP basis without reconciliations of such forward-looking non-GAAP measures. For more information about non-GAAP financial measures, see slide 3Transaction Summary Confidential and Proprietary Information 36
Pro Forma Equity Ownership

  Sources & Uses1,2                                                                                                                                                       Pro Forma Valuation4
  $ in Millions

                                                          Sources
 10X Capital Trust3                                                                                                               $201                              Share Price                                                                                                                        $10.00
 Rollover Equity                                                                                                               $3,000                               Pro Forma Shares Outstanding (Millions of shares)                                                                                   358.1
 PIPE                                                                                                                             $300
 Total Sources                                                                                                                $3,501                                Equity Value                                                                                                                       $3,581
                                                                                                                                                                    Plus: Debt                                                                                                                              0
                                                                Uses
                                                                                                                                                                    Less: Cash on Balance Sheet                                                                                                         $4365
 Cash to Balance Sheet                                                                                                           $4365
                                                                                                                                                                     Enterprise Value                                                                                                                  $3,144
 Rollover Equity                                                                                                               $3,000
 Fees & Other Transaction Expenses                                                                                                  $65
 Total Uses                                                                                                                   $3,501
                                                                                                                                                                         Pro Forma Post Money Ownership4
  -       All REE preferred and common equity holders will receive stock in public company
                                                                                                                                                                      % / Millions of shares                                         10X Shareholders                10X Sponsor Shares (6)
  -       Proceeds from transaction will be used to capitalize balance sheet for $436                                                                                                                                                5.6% / 20.1                     2.2% / 7.9
          million, net of $65 million estimated transaction related fees and expenses
                                                                                                                                                                                                                                                                                 PIPE Investors
  -       REE will use proceeds to primarily fund:
                                                                                                                                                                                                                                                                                 8.4% / 30.0
          − Build out of strategic network of integration centers globally
                                                                                                                                                                                          Existing REE Shareholders
          − CapEx for machinery and tooling and R&D engineering centers                                                                                                                   83.8% / 300.0
          − Working capital to support increasing production demand
      -   Co-founders to hold 10x voting Class B ordinary shares granting each up to 39%
          voting power in the company (assuming no redemptions)

                                                          (1)    Based on REE capital structure                                                                                 (5)   Exclusive of REE’s cash contribution
               Confidential and Proprietary Information   (2)    Assumes no redemption from the public shareholders of 10X                                                      (6)   Sponsor stake equivalent to 7.9 million shares of Class A shares, from which 1.5 million shares are subject to            37
                                                          (3)    Cash in Trust value at December 21, 2020                                                                             forfeiture upon the happening of certain events
                                                          (4)    Values shown assuming $10 per 10X share; does not include 10.1 and 5.5 million public and sponsor out of the
                                                                 money warrants
Operational Benchmarking
Emerging EV Platforms1,2 Established EV Platforms
Revenue CAGR 2022-24E Revenue CAGR 2022-24E Revenue CAGR
%
307 Median : 121% Median : 26%
274 236
147 133 121 115 108 85 79
32 20
2023–25E 2023–25E
2024E Gross Margin 2024E Gross Margin
Gross Margin
% Median : 25.6% Median : 22.7%
30.9 35.3 30.0
26.5 26.2 25.0 24.1 21.4
18.6 17.5 16.6
N/A
2025E 2023E
EBITDA Margin 2024E EBITDA Margin 2024E EBITDA Margin
% Median : 14.4% Median : 13.1%
28.8
22.9 22.4 19.5
15.9 19.1
14.4 13.1 12.8 10.4 7.0
(6.5)
2025E 2023E
Confidential and Proprietary Information Source: Capital IQ as of February 1, 2021 38
(1) All financial projections for emerging EV platforms are per management at SPAC deal announcement except for Fisker, Nikola, and Workhorse
(2) These projections are for illustrative purposes only and should not be relied upon as being necessarily indicative of future results. Metrics that are considered non-GAAP financial measures are
presented on a non-GAAP basis without reconciliations of such forward-looking non-GAAP measures. For more information about non-GAAP financial measures, see slide 3Valuation Benchmarking
Emerging EV Platforms1,2 Established EV Platforms
EV / Revenue 2024E EV / Revenue 2024E EV / Revenue
(x) Median : 1.3x Median : 7.8x
9.0
6.6
4.7
3.0
2.2 1.9
1.2 1.3 1.3 1.2
0.6 0.9 0.7
0.3
2024E 2025E 2026E
EV / EBITDA 2024E EV / EBITDA 2024E EV / EBITDA
(x)
Median : 6.9x Median : 70.2x
93.3
17.0
11.4 47.1
10.1
8.7
7.0 6.7 5.5 5.2 4.7
3.5
1.8
NM
2024E 2025E 2026E
Confidential and Proprietary Information Source: Capital IQ as of February 1, 2021 39
(1) All financial projections for emerging EV platforms are per management at SPAC deal announcement except for Fisker, Nikola, and Workhorse
(2) These projections are for illustrative purposes only and should not be relied upon as being necessarily indicative of future results. Metrics that are considered non-GAAP financial measures are
presented on a non-GAAP basis without reconciliations of such forward-looking non-GAAP measures. For more information about non-GAAP financial measures, see slide 3Transaction Represents Attractive Discount to Peers
Implied Enterprise Value ($ in Billions)
Implied Value Based off Peer Trading Multiples Current Transaction Value
45.5
92%
28.4 Implied
Discount
11.4
64%
3.1 Implied
5.7 Discount
Established EV Platforms Emerging EV Platforms Post-Money
Enterprise Value
5.0x – 8.0x 1.0x – 2.0x 0.6x
EV / 2025E Revenue EV / 2025E Revenue EV / 2025E Revenue
Based off peers’ 2024E trading multiples ranges, reflecting differences in
production ramp-up timelines
Confidential and Proprietary Information 40Thank you Confidential and Proprietary Information 41
You can also read