What drives public support for policies to enhance electric vehicle adoption?
←
→
Page content transcription
If your browser does not render page correctly, please read the page content below
Environmental Research Letters

LETTER • OPEN ACCESS

What drives public support for policies to enhance electric vehicle
adoption?
To cite this article: Gracia Brückmann and Thomas Bernauer 2020 Environ. Res. Lett. 15 094002

View the article online for updates and enhancements.

                              This content was downloaded from IP address 46.4.80.155 on 11/10/2020 at 07:31
Environ. Res. Lett. 15 (2020) 094002 https://doi.org/10.1088/1748-9326/ab90a5
Environmental Research Letters
LETTER
What drives public support for policies to enhance electric vehicle
OPEN ACCESS
adoption?
RECEIVED
29 October 2019 Gracia Brückmann1,2 and Thomas Bernauer1,2
REVISED 1
Center for Comparative and International Studies (CIS), ETH Zurich, Zurich, Switzerland
29 February 2020 2
Institute of Science, Technology and Policy (ISTP), Swiss Mobility Lab, UNO, ETH Zurich, Universitätsstrasse 41, 8092, Zurich,
ACCEPTED FOR PUBLICATION Switzerland
6 May 2020
E-mail: gracia.brueckmann@istp.ethz.ch
PUBLISHED
17 August 2020
Keywords: electric vehicles, transportation policy, pull and push policy measures, policy funding, public opinion, choice experiment
Supplementary material for this article is available online
Original content from
this work may be used
under the terms of the
Creative Commons
Attribution 4.0 licence. Abstract
Any further distribution Decarbonizing the transportation sector is crucial to limiting global warming, but faces severe
of this work must
maintain attribution to political feasibility challenges due to widespread opposition by those who incur the costs. With
the author(s) and the title
of the work, journal
respect to private motorized vehicles, which account for the largest share of emissions from
citation and DOI. transportation, various studies show that pull measures, such as subsidies for electric vehicles
(EVs) and charging infrastructure, attract more public support than push measures, such as
carbon taxes or regulation to phase out fossil fuel cars. Based on a choice experiment with a large,
representative sample (N = 5325) of car holders in Switzerland, we reassess and add to these
findings. We empirically focus on Switzerland because its newly registered cars have the worst
emissions record in Europe. First, we reassess the presumably stronger support for pull measures
by studying whether such support is (negatively) affected by revealing the cost implications in
terms of means for funding these policy measures. Second, a unique feature of our study is that we
examine support for policies to promote EVs both amongst non-EV and EV holders. Our
hypothesis is that EV holders are likely to be more supportive of such policies, even when cost
implications become apparent. Our key finding is that support for pull measures, which is high
amongst non-EV holders, and even higher among technology adopters (EV holders), remains
stable even when policy funding is revealed. This suggests that more ambitious pull measures in
this area are politically feasible, even more so as the share of EV-adopters increases. Our research
also provides a methodological template for similar research in other countries.
1. Introduction (Ajanovic and Haas 2016). This is widely regarded as
indispensable and technically feasible, but also very
The transportation sector is currently one of the difficult to achieve politically because conventional
largest contributors to global CO2 emissions (Abergel cars are widely considered convenient, fast, offer pri-
et al 2017) and accounts for around 14% of total vacy and luggage space, and are regarded as a status
anthropogenic greenhouse gas emissions (Intergov- symbol (Gärling and Schuitema 2007).
ernmental Panel on Climate Change 2014). Decar- Global comparisons of EV adoption rates show
bonizing transportation poses enormous challenges that such adoption, for the time being, hinges strongly
(Rogelj et al 2015, Schellnhuber et al 2016, Rock- on policy interventions (Green et al 2014, Curtin et al
ström et al 2017), such as replacing internal combus- 2017, Hardman et al 2017, Lévay et al 2017, Hard-
tion engine vehicles with vehicles that do not rely man 2019). Current EVs adoption rates are gener-
on fossil fuel, such as battery electric vehicles1 (EVs) ally low in countries with no or weak policy interven-
in conjunction with energy from renewable sources tions in this area, and higher in countries with strong
policies (Sierzchula et al 2014, Hardman 2019, Riet-
1For simplicity, we use only the term ‘electric vehicle (EV)’ for bat- mann and Lieven 2019), which suggests that policy
tery electric vehicles (excluding (plug-in) hybrid vehicles and fuel interventions can contribute to changing behaviour
cell cars). (Tummers 2019). Policy interventions include tax
© 2020 The Author(s). Published by IOP Publishing LtdEnviron. Res. Lett. 15 (2020) 094002 G Brückmann and T Bernauer
rebates, purchase subsidies, parking space privileges, costs that are borne by taxpayers, citizens, and voters
or exceptions from road or car ferry prices, but also (Cherry et al 2012).
disincentives concerning the purchase of combustion We examine whether support for pull measures
engine cars (feebates, bans). decreases when the policy funding is revealed. We
Government intervention is usually justified for focus on two types of seemingly popular but costly
the purpose of promoting technological innovation pull measures for EVs: purchase subsidies and char-
aimed at reducing negative externalities (such as ging infrastructure expansion. Subsidies as well as
emissions from conventional cars) (Sierzchula et al charging infrastructure are regarded as key to enhan-
2014). The absence or weakness in many countries cing EV uptake (Sierzchula et al 2014). Both policy
of policies to promote EV adoption also suggest that measures are voluntary, in the sense that they are not
implementing such policies is far from easy. The main directly disincentivizing the use of conventional cars.
obstacle, arguably, is opposition by those parts of Another pull measure that we also study, information
society that are or would be incurring high costs, and requirements on cars’ energy consumption, is a less
in particular owners of conventional vehicles. In view costly pull measure.
of the fact that public support is quintessential to In a stylized economic market model, (efficient)
the political feasibility of policy interventions (Page forms and levels of policy interventions can be iden-
and Shapiro 1983, Wlezien 1995, Anderson et al 2017, tified by researchers. In the real world, citizens and
Schuitema and Bergstad 2018), it is quite surprising voters take different types of policy interventions (e.g.
that only few studies (Huber et al 2019, Wicki et al amounts of subsidy) into consideration when form-
2019a, 2019b) have, thus far, examined public opin- ing policy preferences and shaping policy-choices.
ion with respect to EV policies. These choices may, and often do, deviate from
In general terms, the literature suggests differ- the market-equilibrium internalizing the externality.
ent ways for reducing externalities (in our case air- After all, in democracies voters have an indirect (via
pollution, noise, and CO2 emissions caused by fossil- elections) or direct (via referenda) say when it comes
fuelled vehicles), notably (Pigouvian) taxes, subsidies, to enacting and implementing particular policies.
and regulation. From a purely economic viewpoint, Real-world policy interventions often come in the
the effectiveness and efficiency of different policy form of sets of policy instruments, rather than a single
instruments may be similar, depending on their policy instrument in isolation (Wicki et al 2019a).
design. But they are likely to vary in terms of their Our study design mimics this by identifying prefer-
political feasibility, proxied by public opinion, which ences with respect to policy proposals consisting of
is our primary focus here. Existing research shows several policy instruments. Specifically, we rely on a
that policy interventions to disincentivise specific conjoint experiment in which car holders (with and
behaviours are usually quite unpopular (e.g. Tobler without EV) evaluate different policy options for pro-
et al 2012, Sørensen et al 2014, Stadelmann-Steffen moting EVs.
and Dermont 2018). Those interventions are usu- Switzerland, in which we sampled the car holders
ally called push measures (e.g. fuel taxes, road pri- for our experiment, is an interesting case for such a
cing). In contrast, policy interventions to incentivize study for several reasons. A high share of the country’s
desired behaviour, often called pull measures, tend electricity is already from renewables (mostly hydro-
to attract considerably more public support. Cherry power) and the government is planning to replace all
et al (2012), e.g. find that public support for sub- remaining non-renewable energy sources, including
sidies that correct for an externality is greater than nuclear energy, with renewables by 2050 (Swiss Fed-
support for taxes (see also Leiserowitz et al 2011). eral Office of Energy 2018). This would increase the
Rhodes et al (2017) show that pull measures, such environmental benefits from EV use (Ajanovic and
as subsidies for purchasing low-carbon technologies, Haas 2016). EV purchase decisions are endogenous to
receive more support than taxes to discourage the our experiment and are influenced by many factors,
purchase of carbon-intensive technology. Steg et al such as perceived performance, environmental atti-
(2006) also find that pull measures (e.g. subsidies) tudes, views on technology, prestige, risk, socio-
enjoy more public support. demographics, as well as cost-benefit-considerations
Higher levels of public support for pull measures (Higgins et al 2012, Smith et al 2017). Currently, EV
or incentive-based policies (e.g. subsidies) are usually adoption rates in Switzerland are very small: only
explained in terms of their voluntariness, (low) per- 1.7% of new car registrations in 2018 (Swiss Fed-
ceived costs and (high) perceived benefits. Pull meas- eral Office of Energy 2019) were (pure) EVs, des-
ures are voluntary in the sense that they make the pite Switzerland’s high GDP/capita (IMF, Interna-
incentivized behaviour relatively cheaper (or other- tional Monetary Fund 2018) and generally strong
wise more attractive) without limiting or eliminating pro-environmental attitudes (Franzen and Vogl 2013)
the alternative choice of ‘undesired’ behaviours. Pull and support for renewable energy (Plum et al 2019).
measures’ perceived costs also tend to be lower. Per- This appears paradoxical because high income and
haps unsurprisingly, subsidies are preferred over taxes environmental attitudes are usually regarded as being
and regulations, even though subsidies also incur positively related to EV adoption (Sierzchula et al
2Environ. Res. Lett. 15 (2020) 094002 G Brückmann and T Bernauer
2014, Brückmann et al 2019). Moreover, EV adop- a pre-defined condition implies eligibility. For
tion should also be facilitated by cost-parity between example, everyone buying an EV could obtain a pur-
EVs and conventional cars, which can be reached after chase subsidy. At the same time, it is uncertain ex ante
30 000-65 000 km of usage (Bloomberg 2019, Swiss how the government will collect the funds for the
eMobility, 2019). subsidy. One option here could be shifting the fin-
The remainder of the paper is structured as fol- ancial burden to future taxpayers. This (un)certainty
lows. First, we review the current literature and high- contrasts in particular with Pigouvian taxes: paying
light theories that are central to our arguments and them is deterministic, whereas if and how collected
hypotheses. Thereafter, we outline the study design, taxes will be returned to voters is uncertain. Loss
present the results, and discuss their implications. aversion (Tversky and Kahneman 1991) thus helps
explain support for subsidies (Heres et al 2017) when
2. Theory and empirical expectations evaluations are based on personal gains and losses
depending on a proposed policy.
In view of the important role public opinion plays in Hence we argue that obtaining more information
shaping environmental policy choices (Anderson et al on funding diminishes the fiscal illusion (and hence
2017, Bakaki et al 2019, Huber et al 2019, Marquart- the uncertainty) concerning pull measures. Hypo-
Pyatt et al 2019), many studies have examined the thesis 2 reflects these arguments.
determinants of public support for particular types of H2: With information on how policy interventions
environmental policies. And some have done so with would be funded, support for pull measures decreases
respect to policies for promoting electric vehicles. and the difference between support levels for pull and
Several studies (e.g. Steg et al 2006, Bjerkan et al 2016, push measures diminishes.
Rhodes et al 2017) show that pull measures enjoy We also expect some differences between the pref-
more public support than push measures (Drews and erences of conventional car and EV holders regarding
van den Bergh 2016; see also De Groot and Schuitema EV policies. Their tastes for policy are likely to differ
2012, Harrison 2010, Wicki et al 2019a, 2019b). The for several reasons.
underlying theoretical logic is that pull measures are First of all, these two populations differ from
less coercive and reduce the costs of the desired, envir- another in several ways (Axsen et al 2016, Westin et al
onmentally friendly behaviour (Steg et al 2006). Our 2018, Brückmann et al 2019). EV holders are more
first hypothesis reflects this argument. familiar with the technology and its (societal) bene-
H1: Pull measures enjoy more public support than fits because of their own experience. Current users,
push measures. already voluntarily, in the absence of strong polit-
Existing evidence shows that car purchase sub- ical interventions, decided to adopt it. Second, the
sidies for EVs, a prominent pull measure, are quite costs of behavioural change in the direction of polit-
popular in Switzerland (EBP 2016), our country ically incentivized behaviour are lower for EV users
of study. Yet, results of a laboratory study show (Diekmann and Preisendörfer 2003, De Groot and
that receiving information about the cost implic- Schuitema 2012). Finally, self-serving bias implies
ations of such subsidies might affect public sup- that people tend to support policies appearing bene-
port (Heres et al 2017). This suggests that sup- ficial for themselves (Caplan 2007). This is likely to be
port for pull measures may result from a lack the case with policies to promote new charging infra-
of attention to societal costssocietal costs. Kall- structure.
bekken and Aasen (2010), for instance, argue that Taken together, these arguments (familiarity,
citizens express rather strong support for govern- lower behavioural costs, and self-serving bias) can be
ment subsidies because of a ‘fiscal illusion’ (for summarized in Hypothesis 3:
more details on this, see SI 1 (available online at H3: Technology adopters (EV holders) are more
stacks.iop.org/ERL/15/094002/mmedia)). Fiscal illu- supportive of push and of pull measures than non-
sion means that people systematically underestim- adopters (non-EV holders).
ate the costs of public services and that, therefore,
demanded public spending exceeds the willingness- 3. Study design
to-pay for it (Winter and Mouritzen 2001). Harrison
(2010) describes this issue in terms of the indirect and 3.1. Sampling and data collection
less visible nature of costs for consumers that will not To test the above arguments, we rely on original sur-
provoke electoral opposition. Not only information vey data. The survey was fielded to a random sample
about the amount of costs but also attention payed to of car holders in the German-speaking Swiss Cantons
costs may explain the ‘fiscal illusion’ (Baekgaard et al of Aargau, Schwyz, Zug, and Zurich. 2 5000 non-EV
2016). In our study, we focus on salience of the fund- car holders were randomly selected in each canton
ing of costly pull measures. (20 000 in total), plus all EV-holders in these cantons.
Heres et al (2017) propose that subsidies receive
more support due to uncertainty about the budgetary
process. Receiving subsidies is deterministic, because 2This selection is justified in more detail in the SI 2.
3Environ. Res. Lett. 15 (2020) 094002 G Brückmann and T Bernauer
Table 1. Conjoint attributes and attribute values.
Attribute Attribute values (one of each is randomly assigned)
Charging infrastructure provision for electric vehicles • 100 out of 1000 parking spaces
at public parking spaces • 10 out of 1000 parking spaces
• 1 out of 1000 parking spaces
• No new additional charging infrastructure
Purchase subsidy for new electric vehicles • Subsidy of 5000 CHFa
• Subsidy of 3000 CHF
• Subsidy of 1000 CHF
• No subsidy
Information requirements on fuel consumption, CO2 • Stricter information requirements: energy labels
emissions, and energy efficiency of cars (e.g. energy must show additional fuel consumption data from real
labels, information in advertisements and sales bro- driving and visibility must be increased
chures) • Abolish current information requirements on fuel
consumption, CO2 emissions, and energy efficiency of
cars
• Maintain current information requirements: energy
label attached to newly sold cars
Registration of highly fossil fuel consuming cars • Forbid registration from 2020 onward
(above 7 l of gasoline/diesel per 100 km) • Allowed
Funding of these measures (only randomly displayed to • Price increase for motorway vignette from 40 to 100
half of the respondents) CHF
• General federal budget with an increase in income
taxes
• Fee (malus) of CHF 4000 when purchasing a car with
gasoline/diesel engine
• General federal budget without an increase in income
taxes (savings in other areas of the budget)
• No additional fundingb
a
Note: 1 CHF (Swiss Franc) is approx. 1.03 US Dollar or 0.94 Euros (as of February 2020).
b
Shown if and only if the policy proposal jointly included «No additional charging infrastructure» and «No subsidy». When these two
attribute values were displayed jointly, funding was always «No additional funding». This is the only restriction in this fully randomized
conjoint design, see SI 5. The information in this table footnote was not displayed to respondents.
The total was 22 627 survey invitees. The four can- regards to policy options consisting of specific sets of
tonal car registries randomly sampled and provided policy measures (attributes). The list of attributes is
the postal addresses. shown in table 1.
5325 invitees completed the survey, which The conjoint experiment started with an over-
included a choice experiment (see below), yielding view of all attributes and all potential values (levels)
a (The American Association for Public Opinion of these attributes (table 1). The first four attrib-
Research 2016) response rate of 23.5 %. The survey utes shown in table 1 include three pull (charging
was fielded between May 22, 2018, and October 2, infrastructure, purchase subsidy, information/energy
2018. In the SI, we discuss to what extent our sample labelling requirements) and one push measure (phas-
represents the entire population of car holders (SI 3), ing out cars with high fuel consumption via new
describe in detail the survey flow (SI 4), and show the registration rules). Since our emphasis is on under-
survey instrument (SI 8). The study was approved by standing how cost information affects support for
ETH Zurich’s ethics committee (decision EK 2017- pull measures we decided to include more pull than
N-85). push measures in the experiment while using a lim-
ited number of attributes in order to minimize the
3.2. Choice experiment cognitive burden on participants, so as to obtain
For the experiment, we used a two-step design meaningful responses. The fifth attribute in table 1
(Sen 2017, Kirkland and Coppock 2018, Beiser - concerns funding. As noted above, study participants
McGrath and Bernauer 2019). We first randomly were randomly assigned to choice experiments that
assigned study participants to two groups: one always included or always omitted this attribute. The
received information in the choice experiment on choice of this method is justified in more detail in SI 6.
how pull measures will be funded, the other group Our experimental design randomly exposes
received no such funding information. In the conjoint study participants to sets of treatment conditions in
choice experiment (Hainmueller et al 2014) study terms of a combination of four (or five, including
participants then had to express their preferences with funding information) variables whose values are
4Environ. Res. Lett. 15 (2020) 094002 G Brückmann and T Bernauer
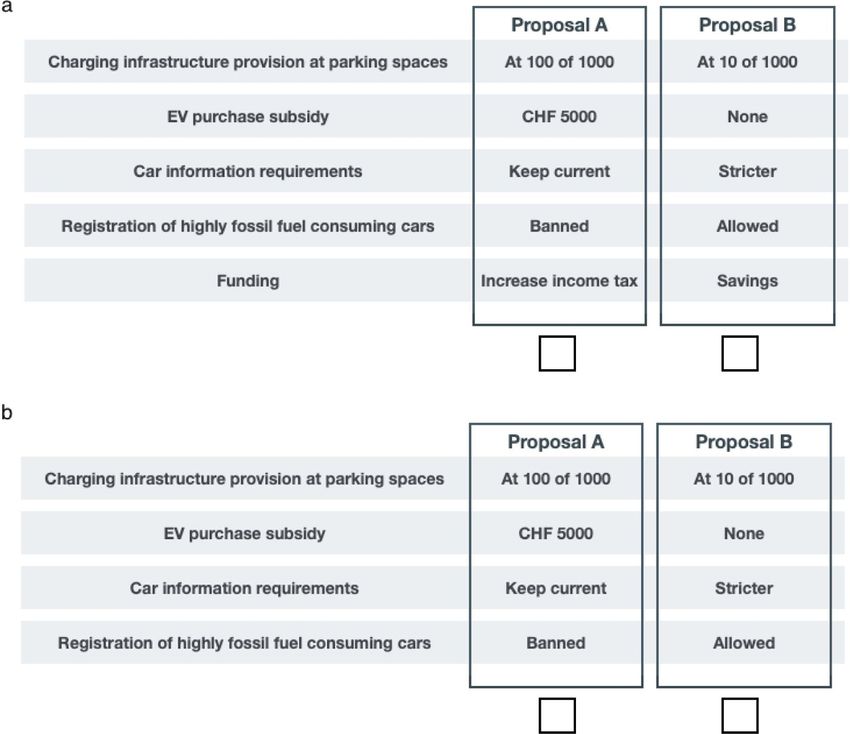
Figure 1. The upper panel (a) shows an example of a conjoint table with funding information, the lower panel (b) shows an
exemplary conjoint table without funding information. These pictures exemplarily display how the survey experiment looked for
participants.
experimentally manipulated. These attribute val- provide further, more nuanced information (see also
ues were randomly allocated. For every policy meas- Hainmueller et al 2015).
ure (attribute) the status quo is one possible attrib- In terms of sample size, this setup generates a
ute value, e.g. no new chargers. This allows parti- maximum of N = 53 250 = 5325 respondents × 2
cipants to compare each proposed attribute value policy proposals × 5 choice tasks. The data is
to the status quo. Displaying random attribute val- clustered on individuals, as each participant per-
ues allows us to estimate the causal impact of these forms five choice tasks. Omissions due to item non-
treatment conditions on the outcome (dependent response occur. We use OLS3 to estimate the coef-
variable) of interest, i.e. policy preferences. The lat- ficients of the average marginal component effects
ter are captured through a binary choice (whether (AMCEs) and marginal means (Leeper et al 2019).
policy option A or B is preferred) and a 7-point Likert We report only marginal means as they display the
scale. Two side-by-side policy proposals each had to rate at which the dependent variable (i.e. policy pro-
be rated in five choice tasks (leading to 10 policy posals’ choice probabilities or ratings) changes with
proposals evaluated per participant). Figure 1 illus- a change in the independent variable, holding the
trates one of these choice tasks with two exemplary other predictor variables at a constant level. They dir-
policy proposals. The order of attributes was ran- ectly result from AMCEs. Support for policy pro-
domized per participant, and then held constant posals serves as the dependent variable and different
across the five choice tasks to limit the cognitive experimentally manipulated policy attributes serve as
burden. the independent variables. We estimate the follow-
The decision to use a stated-preference con- ing two equations, where variables are labelled and
joint experiment, with binary choice and rating, for ordered according to the description in table 1 and
this research is motivated by two considerations. figure 1 above:
First, respondents face a trade-off, as the forced
choice between two alternative policies implicates 3Hainmueller et al (2014) show that OLS is an appropriate estim-
‘costs of foregone alternatives’. Second, ratings of ator for the AMCE and produces very similar estimates compared
each proposed policy, irrespectively if chosen or not, to binary logit or probit.
5Environ. Res. Lett. 15 (2020) 094002 G Brückmann and T Bernauer
At 100 of 1000
parking spaces
infrastructure
provision at
At 10 of 1000
Charging
At 1 of 1000
No new
CHF 5000
EV purchase
CHF 3000
subsisdy
CHF 1000
None
Stricter
Car information
requirements
Abolish
Keep current
Banned
highly fossil fuel
consuming cars
Registration of
Allowed
0.2 0.3 0.4 0.5 0.6 0.7
Figure 2. Marginal means for binary choice between policy proposals. Non-EV holders who did not receive any information on
policy funding (subsample of n = 1897). The bars represent 95% confidence intervals. The dashed line marks a 50% policy choice
probability.
Choice = β0 + β1 Chargers + β2 Subsidy we only look at respondents who did not receive any
+ β3 Information + β4 Registration + ε information on policy funding and focus on conven-
tional car (non-EV) holders (the results for EV hold-
ers are discussed further below). Figure 2 displays
Choice = β0 + β1 Chargers + β2 Subsidy policy support in terms of marginal means for dif-
+ β3 Information + β4 Registration ferent levels of policy attributes for the binary choice
+ β5 Funding + ε between two alternatives. Marginal means describe
the level of support for a specific attribute level, all else
4. Results equal. For the binary choice, this can be interpreted as
the probability that a participant chooses a proposal
First, we look whether our data,4 when policy funding given the respective policy attribute level is included
is omitted, supports the hypothesis that pull measures (Leeper et al 2019).
receive more support than push measures. Therefore, As shown in figure 2, respondents clearly prefer
more charging infrastructure (58% and 59% choice
probability all else equal, for 10 and 100 chargers
4We used Stata (StataCorp 2017) for data-cleaning and R (R Core
per 1000 parking spaces, respectively). This char-
Team 2018) for the analyses (Wickham 2017, Barari et al 2018, Gar-
buszus and Jeworutzki 2018, Leeper et al 2018, Walker 2018, Dowle
ger density is very high and far more than currently
and Srinivasan 2019). installed in Switzerland. Installing no or very few
6Environ. Res. Lett. 15 (2020) 094002 G Brückmann and T Bernauer
At 100 of 1000
parking spaces
infrastructure
provision at
At 10 of 1000
Charging
At 1 of 1000
No new
CHF 5000
EV purchase
CHF 3000
subsisdy
CHF 1000
None
Stricter
Car information
requirements
Abolish
Keep current
highly fossil fuel
consuming cars
Banned
Registration of
Allowed
Increase car vignette pr ice
Increase income tax
Funding
Malus for inefficient cars
Savings
No add. fund.
0.2 0.3 0.4 0.5 0.6 0.7
Funding Visible No Yes
Figure 3. Marginal means for binary choice between policy proposals (non- EV holders, subsample of n = 3768). Filled triangles
indicate that funding was displayed, empty triangles indicate that funding was excluded. The bars represent 95% confidence
intervals. The dashed line indicates a 50% choice probability.
new chargers results in support levels of less than requirements have a positive effect (55% choice prob-
0.5, indicating opposition. These results show that ability) on policy support. Completely abandoning
even non-EV holders, who currently do not benefit information requirements and energy labels induces
from charging infrastructure, strongly prefer more rather strong opposition (42% choice probability).
charging infrastructure and strongly oppose main- As to push measures, there is only a minor differ-
taining the status quo (no new chargers). Another ence between still allowing (51%) and banning (49%
pull measure, purchase subsidies, receives consider- choice probability) high consumption fossil fuel cars.
ably less support, which is rather surprising in view Given that banning new registrations for highly-
of previous research. Only small subsidies of CHF emitting cars is a rather strong push instrument, this
1000 are viewed positively (52% choice probability), level of support is surprising.
as they are preferred over the status quo (no sub- With respect to Hypothesis 1, our results thus
sidy). The third pull measure, information provi- show that pull measures are viewed positively, and
sion such as energy labels, is viewed positively in its more positively than push measures. The main caveat,
current form (status quo) and stricter information however, is that we included only one fairly radical
7Environ. Res. Lett. 15 (2020) 094002 G Brückmann and T Bernauer
At 100 of 1000
parking spaces
infrastructure
provision at
At 10 of 1000
Charging
At 1 of 1000
No new
CHF 5000
EV purchase
CHF 3000
subsisdy
CHF 1000
None
Stricter
Car information
requirements
Abolish
Keep current
Banned
highly fossil fuel
consuming cars
Registration of
Allowed
0.2 0.3 0.4 0.5 0.6 0.7
Car Type No EV EV
Figure 4. Binary choice between policy proposals (all car holders with funding hidden, n = 2480) with different attribute levels.
Green circles refer to EV holders (n = 583), while purple triangles refer to other car holders (n = 1897). The bars represent 95%
confidence intervals. The dashed line is 50%.
push measure in the experiment because we are Starting with the first attribute category, rechar-
interested mainly in examining whether funding ging infrastructure, we observe that providing no
information affects support for pull measures. The or only very few new chargers becomes somewhat
next step in the analysis then is to examine whether more popular when funding is revealed but support
revealing costs and funding reduces support. for no or only few new chargers is still low (e.g.
Figure 3 summarizes the results for conven- 35% to 38% choice probability for no new char-
tional car holders, differentiated by treatment status gers, confidence intervals do not overlap). For higher
(funding information hidden or revealed). Funding levels of new charging infrastructure provision, we
information is revealed when the triangle on the bars observe no significant difference when funding is
in the figure is filled, and hidden when the triangle revealed, and support levels remain very high (from
is outlined. Figure 3 again displays marginal means 58% to 57% choice probabilities). This result is very
(interpreted as choice probabilities, all else constant) surprising and indicates strong and robust support
for each policy attribute level. for policies providing for a large-scale expansion
8Environ. Res. Lett. 15 (2020) 094002 G Brückmann and T Bernauer
At 100 of 1000
parking spaces
infrastructure
provision at
At 10 of 1000
Charging
At 1 of 1000
No new
CHF 5000
EV purchase
CHF 3000
subsisdy
CHF 1000
None
Stricter
Car information
requirements
Abolish
Keep current
highly fossil fuel
consuming cars
Banned
Registration of
Allowed
Increase car vignette pr ice
Increase income tax
Funding
Malus for inefficient cars
Savings
No add. fund.
0.2 0.3 0.4 0.5 0.6 0.7
Car Type No EV EV
Figure 5. Binary choice between policy proposals (all car holders with funding revealed, n = 2442) with different attribute. Green
circles refer to EV holders (n = 571), while purple triangles refer to other car holders (n = 1871). The bars represent 95%
confidence intervals. The dashed line is 50%.
of charging infrastructure irrespective of funding place in the neighbouring country Germany or
hidden or revealed. the neighbouring canton of Thurgau (2020)5 , for
As to purchase subsidies, somewhat surprisingly instance.
we observe less support for the baseline of no sub- With regard to the third pull measure, vehicle
sidy when funding is omitted (50% choice probab- energy information requirements, we observe no sig-
ility) compared to when funding is revealed (52 %), nificant differences between the two funding inform-
though the difference is insignificant. New subsidies ation conditions. This result is less surprising than
are always slightly more supported when funding is the results for chargers and purchase subsidies,
revealed, but the differences are insignificant. These because the cost implications in terms of govern-
findings indicate that there is robust, but not very ment spending are probably much smaller and study
strong support (51% and 52% choice probability participants may have noted that. The same holds for
when financing is revealed) for purchase subsidies in
the order of CHF 1000 - an amount substantially
5Thurgau (2020) provides CHF 3500 in 2020.
lower than governmental subsidies currently in
9Environ. Res. Lett. 15 (2020) 094002 G Brückmann and T Bernauer
the push measure, regulation of high consumption 5. Conclusion
fossil- fuelled cars. Overall, these findings provide no
support for Hypothesis 2, which holds that revealing In this paper we examine public support for, and
information on funding reduces policy support. SI thus the political feasibility of policy options for
7 provides additional results using the policy rating promoting EV adoption, both in regard to market-
variables. As can be seen there, the results are very based pull measures (purchase subsidies, new char-
similar to the results for the choice variables reported ging infrastructure) and regulation (car-specific
above. energy information requirements, phasing out high
We now take a brief look at the findings for consumption fossil-fuelled cars). The emphasis
the funding attributes, though they do not directly was on studying support for costly pull measures
speak to Hypotheses 2 but are interesting from a when funding them (in different ways) is hidden or
policy perspective. The non-EV holders prefer fund- revealed. Moreover, we examined differences between
ing via the general government budget (implying sav- EV adopters and conventional car holders in this
ings in other policy areas) (55% choice probabil- respect.
ity) or via increasing the price on the usage permit Based on a survey embedded choice experiment
(‘vignette’) for Swiss highways (58% choice probabil- with a random sample of more than 5000 car hold-
ity) rather than increasing income tax to fund pro- ers, we find support for the argument that pull meas-
posed policy interventions. Respondents are ambi- ures attract more public support than push meas-
valent about imposing a new lump-sum tax on the ures. Interestingly, however, and in contrast to what
registration of fossil- fuelled cars for this purpose. we expected, support levels do not decrease much
Note, that not providing any new funding cannot be when funding options are revealed in the choice task.
interpreted directly as it is only displayed in the case Finally, in line with our expectations, we find stronger
where no new chargers and no purchase subsidies are support both for pull and push measures amongst EV
proposed. holders, relative to conventional car holders.
We now move to the analysis of the subsample The main policy implication of our findings is
of EV holders and compare the findings to those for that there is considerable political room of man-
non-EV holders (Hypotheses 3). In contrast to the euver for more ambitious pull measures in this area,
findings presented so far, the comparison presented such as large-scale expansion of public charging infra-
here does not reflect causal effects because we did structure, mandatory energy information, and to a
not experimentally manipulate car ownership; hence more limited extent also EV purchase subsidies. This
there might be underlying variables that affect driv- holds even when citizens/consumers are confronted
etrain choices as well as policy preferences. Figures with the fact that such measures have important cost
4 and 5 shows that, overall, EV holders are more implications and need to be funded. Moreover, the
supportive of pull measures, notably with respect fact that support levels amongst EV holders are higher
to (higher) purchase subsidies and (more) char- implicates that aggregate support levels amongst all
ging infrastructure. Similarly, they dislike no sub- car holders are likely to increase with an increasing
sidy and no new chargers even more than non-EV share of EV holders in the car holding population.
holders. Moreover, they are more supportive of the Additional research could focus on several issues
push measure, banning fossil-fuel cars, relative to in order to further probe into the political feasibility
non-EV holders (58% vs. 49% choice probability of pull and push policies for promoting EV adoption.
for both funding treatment categories). From fig- First, it would be worthwhile to reassess our main
ure 5, when funding is revealed, we also observe findings in other countries with somewhat different
that they prefer the push measure (malus for inef- EV policy settings, based on a similar study design.
ficient cars) much more than current fossil-fuelled Examples include Australia (with virtually no policies
car holders. Currently, EV ownership in Switzer- in place in this areas (Webb et al 2019)) and Germany
land is still very diverse, especially in view of differ- (with moderately ambitious such policies already in
ent types of BEVs and regarding second car owner- place (Federal Ministry for Economic Affairs and
ship among EV owners. We implemented two addi- Energy 2020)). Second, it would be useful to include a
tional sample stratifications to assess whether own- more nuanced set of push measures alongside the pull
ing a non-BEV car in a BEV household or hav- measures we emphasized. Examples include carbon
ing a long-range Tesla BEV (Hardman et al 2016, taxes or road space and parking restrictions for con-
Webb et al 2019) changes policy preferences. In both ventional car holders (Wolbertus et al 2018). Third,
cases, there were no statistically significant differ- it would be interesting to obtain more information
ences for these subgroups (results available from the on the assumptions car holders make with respect
authors on request). The above-mentioned findings to paying at new charging infrastructure: whether
clearly support Hypothesis 3, which expects more they would pay (the comparatively low) energy costs
support for pull and push measures amongst EV for refuelling EVs or high costs (as with fossil-fuels),
holders. or whether charging an EV would even be free of
10Environ. Res. Lett. 15 (2020) 094002 G Brückmann and T Bernauer
charge. Depending on such assumptions and others Baekgaard M, Serritzlew S and Blom-Hansen J 2016 Causes of
that affect the anticipated total cost of car ownership, fiscal illusion: lack of information or lack of attention?
Public Budg. Finance 36 26–44
car holders’ reactions to various push and pull meas-
Bakaki Z, Böhmelt T and Ward H 2019 The triangular relationship
ures might differ to some extent. Finally, further stud- between public concern for environmental issues, policy
ies could also examine how sensitive support levels are output, and media attention Environ. Polit. 1–21
to various cost implication levels and mixes of fund- Barari S et al 2018 Cjoint: AMCE estimator for conjoint
experiments https://cran.r-project.org/package=cjoint
ing options, in addition to ways of funding the costs.
Beiser-McGrath L F and Bernauer T 2019 Could revenue recycling
Besides that, as to the different preferences for tech- make effective carbon taxation politically feasible? Sci. Adv.
nology adopters, it would be interesting to study how 5 eaax3323
technology experience is causally linked to changes in Bjerkan K Y, Nørbech T E and Nordtømme M E 2016 Incentives
for promoting battery electric vehicle (BEV) adoption in
technology policy preferences.
Norway Transp. Res. D 43 169–80
BloombergNEF 2019 Electric Vehicle Outlook 2019 https://about.
Acknowledgments bnef.com/electric-vehicle-outlook/ (Accessed 12 February
2020)
Brückmann G, Willibald F and Blanco V 2019 Spatial and
We are grateful to Kay W. Axhausen, Liam F. Beiser- individual characteristics for battery electric vehicle
McGrath, Lukas Fesenfeld, Robert A. Huber, Dennis adoption Presented at the 42nd IAEE Int. Conf.
Kolcava, Vally Koubi, Michael Wicki, and participants pp 1–20.
Caplan B D 2007 The Myth of the Rational Voter : Why
at the 9th EPSA as well as two anonymous review- Democracies Choose Bad Policies (Princeton, NJ: Princeton
ers for very helpful comments on previous versions. University Press)
We are also grateful to Joshua Good, Dennis Atzen- Cherry T L, Kallbekken S and Kroll S 2012 The acceptability of
hofer, Michael Hudecheck, Alen Salihovic, and Ursin efficiency-enhancing environmental taxes, subsidies and
regulation: an experimental investigation Environ. Sci. Policy
Gstöhl for valuable research assistance, and to the 16 90–96
car registries of the Swiss cantons of Aargau, Schwyz, Curtin J, Mcinerney C and Gallachóir B Ó 2017 Financial
Zug, and Zurich for supporting the data collection. incentives to mobilise local citizens as investors in
The research was funded by the Swiss Federal Office low-carbon technologies: a systematic literature review
Renew. Sustain. Energy Rev. 75 534–47
of Energy and ETH Zurich’s ISTP Mobility Research De Groot J I M and Schuitema G 2012 How to make the
Incubator Program. unpopular popular? Policy characteristics, social norms and
the acceptability of environmental policies Environ. Sci.
Conflict of interest Policy 19–20 100–7
Diekmann A and Preisendörfer P 2003 Green and greenback the
behavioural effects of environmental attitudes in low-cost
None. and high-cost situations Ration. Soc. 15 441–72
Dowle M and Srinivasan A 2019 Data.Table: extension of
Data availability ‘data.Frame’ https://cran.r-project.org/package=data.table
Drews S and van den Bergh J C J M 2016 What explains public
support for climate policies? A review of empirical and
The data that support the findings of this study will experimental studies Clim. Policy 16 855–76
be openly available at https://doi.org/10.7910/DVN/ EBP 2016 Barometer Auto Und Mobilität Von Morgen (Zollikon)
XF0GD9 following a delay of 24 months from the date (https://www.ebp.ch/sites/default/files/2016-11/2016-06-
08_bam2016-bericht_def.pdf)
of publication. Federal Ministry for Economic Affairs and Energy 2020
Regulatory environment and incentives for using electric
ORCID iDs vehicles and developing a charging infrastructure Federal
Ministry for Economic Affairs and Energy https://www.
bmwi.de/Redaktion/EN/Artikel/Industry/regulatory-
Gracia Brückmann https://orcid.org/0000-0001- environment-and-incentives-for-using-electric-
5674-2343 vehicles.html (Accessed 28 February 2020)
Thomas Bernauer https://orcid.org/0000-0002- Franzen A and Vogl D 2013 Two decades of measuring
environmental attitudes: a comparative analysis of 33
3775-6245
countries Glob. Environ. Change 23 1001–8
Garbuszus J M and Jeworutzki S 2018 “Readstata13: import ‘Stata’
References Data Files https://cran.r-project.org/package=readstata13
Gärling T and Schuitema G 2007 Travel demand management
The American Association for Public Opinion Research 2016 targeting reduced private car use: effectiveness, public
Standard Definitions Final Dispositions of Case Codes and acceptability and political feasibility J. Soc. Issues
Outcome Rates for Surveys 9th Edition pp 1–80 63 139–53
Abergel T et al 2017 303 Energy Technology Perspectives 2017 Green E H, Skerlos S J and Winebrake J J 2014 Increasing electric
(Paris: OECD) vehicle policy efficiency and effectiveness by reducing
Ajanovic A and Haas R 2016 Dissemination of electric vehicles in mainstream market bias Energy Policy 65 562–6
urban areas: major factors for success Energy 115 1451–8 Hainmueller J, Hangartner D and Yamamoto T 2015 Validating
Anderson B, Böhmelt T and Ward H 2017 Public opinion and vignette and conjoint survey experiments against real-world
environmental policy output: a cross-national analysis of behavior Proc. Natl Acad. Sci. USA 112 2395–400
energy policies in Europe Environ. Res. Lett. 12 1–10 Hainmueller J, Hopkins D J and Yamamoto T 2014 Causal
Axsen J, Goldberg S and Bailey J 2016 How might potential future inference in conjoint analysis: understanding
plug-in electric vehicle buyers differ from current ‘Pioneer’ multidimensional choices via stated preference experiments
owners? Transp. Res. D 47 357–70 Polit.Anal. 22 1–30
11Environ. Res. Lett. 15 (2020) 094002 G Brückmann and T Bernauer
Hardman S 2019 Understanding the impact of reoccurring and Rogelj J, Luderer G, Pietzcker R C, Kriegler E, Schaeffer M, Krey V
non-financial incentives on plug-in electric vehicle adoption and Riahi K 2015 Energy system transformations for
– a review Transp. Res. A 119 1–14 limiting end-of-century warming to below 1.5 ◦ C Nat. Clim.
Hardman S, Chandan A, Tal G and Turrentine T 2017 The Change 5 519–27
effectiveness of financial purchase incentives for battery Schellnhuber H J, Rahmstorf S and Winkelmann R 2016 Why the
electric vehicles – a review of the evidence Renew. Sustain. right climate target was agreed in Paris Nat. Clim. Change
Energy Rev. 80 1100–11 6 649–53
Hardman S, Shiu E and Steinberger-Wilckens R 2016 Comparing Schuitema G and Bergstad C J 2018 Acceptability of
high-end and low-end early adopters of battery electric environmental policies Environmental Psychology, ed L Steg
vehicles Transp. Res. A 88 40–57 and J I M De Groot (Chichester: Wiley) pp 295–306
Harrison K 2010 The comparative politics of carbon taxation Sen M 2017 How political signals affect public support for judicial
Annu. Rev. Law Soc. Sci. 6 507–29 nominations Polit. Res. Q 70 374–93
Heres D R, Kallbekken S and Galarraga I 2017 The role of Sierzchula W, Bakker S, Maat K and van Wee B 2014 The
budgetary information in the preference for influence of financial incentives and other socio-economic
externality-correcting subsidies over taxes: a lab experiment factors on electric vehicle adoption Energy Policy 68 183–94
on public support Environ. Resour. Econ. 66 1–15 Smith B, Olaru D, Jabeen F and Greaves S 2017 Electric vehicles
Higgins A, Paevere P, Gardner J and Quezada G 2012 Combining adoption: environmental enthusiast bias in discrete choice
choice modelling and multi-criteria analysis for technology models Transp. Res. D 51 290–303
diffusion: an application to the uptake of electric vehicles Sørensen C H et al 2014 Strategies to manage barriers in policy
Technol. Forecast. Soc. Change 79 1399–412 formation and implementation of road pricing packages
Huber R A, Wicki M L and Bernauer T 2019 Public support for Transp. Res. A 60 40–52
environmental policy depends on beliefs concerning Stadelmann-Steffen I and Dermont C 2018 The unpopularity of
effectiveness, intrusiveness, and fairness Environ. Polit. 1–25 incentive-based instruments: what improves the
International Monetary Fund 2018 World Economic Outlook, cost–benefit ratio? Public Choice 175 37–62
October 2018: Challenges to Steady Growth (Washington, StataCorp 2017 Stata Statistical Software
DC: International Monetary Fund) Steg L, Dreijerink L and Abrahamse W 2006 Why are energy
Intergovernmental Panel on Climate Change 2014 Summary for policies acceptable and effective? Environ. Behav. 38 92–111
policymakers Climate Change 2014: Mitigation of Climate Swiss eMobility, c/o Mobilitätsakademie des TCS 2019 Mythbuster
Change. Contribution of Working Group III to the Fifth Elektroautos Berne https://www.swiss-emobility.ch/de-
Assessment Report of the Intergovernmental Panel on Climate wAssets/docs/Mythbuster/Mythbuster-Elektroauto-
Change ed O Edenhofer et al (Cambridge: Cambridge 2019_aktualisiert_07.01.2020.pdf (Accessed 12 February
University Press) pp 1–31 2020)
Kallbekken S and Aasen M 2010 The demand for earmarking: Swiss Federal Office of Energy 2018 Energiestrategie 2050 Nach
results from a focus group study Ecol. Econ. 69 2183–90 Dem Inkraft- Treten Des Neuen Energiegesetzes (Bern: BFE)
Kirkland P A and Coppock A 2018 Candidate choice without Swiss Federal Office of Energy 2019 Key data relating to
party labels Polit. Behav. 40 571–91 alternative drives (in German) https://www.bfe.admin.
Leeper T J, Arnold J and Arel-Bundock V. 2018 Margins: marginal ch/bfe/en/home/supply/statistics-and-geodata/key-vehicle-
effects for model objects https://cran.r-project.org/web/ data/key-data-relating-to-alternative-drives.html
packages/ /index.html (Accessed 12 June 2019) Accessed (12 June 2019)
Leeper T J, Hobolt S B and Tilley J 2019 Measuring subgroup Thurgau, Department für Inneres und Volkswirtschaft Energie
preferences in conjoint experiments Polit.Anal. 28 207–21 2020 Förderprogramm Energie 2020 Fördersätze Und
Leiserowitz A et al 2011 Climate Change in the American Mind: Bedingungen http://formular.tg.ch/dokumente/temp/
Public Support for Climate & Energy Policies in November 8CF71822-9CE5-24FC-77748518B6CA7614/
2011 (New Haven, CT: Yale Project on Climate Change Foerderprogramm_TG_2020_V1-0.pdf?CFID=8527798&
Communication) (http://environment. CFTOKEN=54743465 (Accessed 28 February 2020)
yale.edu/climate/files/PolicySupportNovember2011.pdf) Tobler C, Visschers V H M and Siegrist M 2012 Addressing
Lévay P Z, Drossinos Y and Thiel C 2017 The effect of fiscal climate change: determinants of consumers’ willingness to
incentives on market penetration of electric vehicles: a act and to support policy measures J. Environ. Psychol. 32
pairwise comparison of total cost of ownership Energy Policy 197–207
105 524–33 Tummers L 2019 Public policy and behavior change Public Adm.
Marquart-Pyatt S T, Qian H, Houser M K and Mccright A M 2019 Rev. 79 925–30
Climate change views, energy policy preferences, and Tversky A and Kahneman D 1991 Loss aversion in riskless choice:
intended actions across welfare state regimes: evidence from a reference-dependent model Q. J. Econ. 106 1039–61
the European Social Survey Int. J. Sociol. Walker A 2018 Openxlsx: read, Write and edit XLSX files
49 1–26 https://cran.r-project.org/package=openxlsx
Page B I and Shapiro R Y 1983 77 Source: the American Political Webb J, Whitehead J and Wilson C 2019 Who will fuel your
Science Review Eff. Public Opin. Policy https://www.jstor. electric vehicle in the future? You or your utility? Consumer,
org/stable/pdf/1956018.pdf Prosumer, Prosumager (London: Elsevier) pp 407–29
Plum C, Olschewski R, Jobin M and van Vliet O 2019 Public Westin K, Jansson J and Nordlund A 2018 The importance of
preferences for the Swiss Electricity System after the nuclear socio-demographic characteristics, geographic setting, and
phase-out: a choice experiment Energy Policy 181–96 attitudes for adoption of electric vehicles in Sweden Travel
R Core Team 2018 R: a language and environment for statistical Behav. Soc. 13 118–27
computing https://www.r-project.org/ Wickham H 2017 Tidyverse: easily install and load the ‘Tidyverse’
Rhodes E, Axsen J and Jaccard M 2017 Exploring citizen support https://cran.r-project.org/package=tidyverse
for different types of climate policy Ecol. Econ. Wicki M, Fesenfeld L and Bernauer T 2019a In search of
137 56–69 politically feasible policy-packages for sustainable passenger
Rietmann N and Lieven T 2019 How policy measures succeeded transport: insights from choice experiments in China,
to promote electric mobility – worldwide review and Germany, and the USA Environ. Res. Lett. 14 084048
outlook J. Clean. Prod. 206 66–75 Wicki M, Huber R A and Bernauer T 2019b Can policy-packaging
Rockström J, Gaffney O, Rogelj J, Meinshausen M, Nakicenovic N increase public support for costly policies? Insights from a
and Schellnhuber H J 2017 A roadmap for rapid choice experiment on policies against vehicle emissions J.
decarbonization Science 355 1269–71 Public Policy 1–27
12Environ. Res. Lett. 15 (2020) 094002 G Brückmann and T Bernauer
Winter S and Mouritzen P E 2001 Why people want something Wolbertus R, Kroesen M, van den Hoed R and Chorus C G 2018
for nothing: the role of asymmetrical illusions Eur. J. Polit. Policy effects on charging behaviour of electric vehicle
Res. 39 109–43 owners and on purchase intentions of prospective owners:
Wlezien C 1995 The public as thermostat: dynamics of natural and stated choice experiments Transp. Res. D
preferences for spending Am J Pol Sci 39 981–1000 62 283–97
13You can also read