A Measurement Study of Google Play
←
→
Page content transcription
If your browser does not render page correctly, please read the page content below
A Measurement Study of Google Play

                          Nicolas Viennot                                         Edward Garcia                          Jason Nieh
                       Computer Science                                       Computer Science                        Computer Science
                           Department                                             Department                             Department
                       Columbia University                                    Columbia University                    Columbia University
                       New York, NY, USA                                      New York, NY, USA                       New York, NY, USA
                   nviennot@cs.columbia.edu                                 ewg2115@columbia.edu                    nieh@cs.columbia.edu

ABSTRACT                                                                                        Keywords
Although millions of users download and use third-party                                         Android; Authentication; Clone Detection; Decompilation;
Android applications from the Google Play store, little in-                                     Google Play; Mobile Computing; OAuth; Security;
formation is known on an aggregated level about these ap-
plications. We have built PlayDrone, the first scalable                                         1.   INTRODUCTION
Google Play store crawler, and used it to index and analyze
                                                                                                   The Google Play store allows users to download and use
over 1,100,000 applications in the Google Play store on a
                                                                                                a vast amount of third-party applications. Millions of users
daily basis, the largest such index of Android applications.
                                                                                                register personal information both with Google and third-
PlayDrone leverages various hacking techniques to circum-
                                                                                                party services to download and use these applications on
vent Google’s roadblocks for indexing Google Play store con-
                                                                                                their personal Android phones and tablets. Hundreds of
tent, and makes proprietary application sources available,
                                                                                                thousands of developers upload content to the Google Play
including source code for over 880,000 free applications. We
                                                                                                store and millions of users download the content despite the
demonstrate the usefulness of PlayDrone in decompiling
                                                                                                fact that the content is largely unchecked.
and analyzing application content by exploring four pre-
                                                                                                   However, little is known at an aggregate level about the
viously unaddressed issues: the characterization of Google
                                                                                                hundreds of thousands of applications available in the Google
Play application content at large scale and its evolution over
                                                                                                Play store. This is due in large part to the lack of scal-
time, library usage in applications and its impact on appli-
                                                                                                able tools available for discovering and analyzing Android
cation portability, duplicative application content in Google
                                                                                                applications in the Google Play store. Application source
Play, and the ineffectiveness of OAuth and related service
                                                                                                code is also only available to the respective third-party de-
authentication mechanisms resulting in malicious users be-
                                                                                                velopers. Not even Google has access to the source code,
ing able to easily gain unauthorized access to user data and
                                                                                                as applications are submitted directly as compressed binary
resources on Amazon Web Services and Facebook.
                                                                                                packages by application developers to Google Play. Fur-
                                                                                                thermore, Google imposes various mechanisms to prevent
                                                                                                others from crawling and indexing Google Play store con-
Categories and Subject Descriptors                                                              tent. For example, discovery of applications in the Google
                                                                                                Play store is limited as only the first 500 applications be-
C.2.4 [Computer-Communication Networks]: Dis-                                                   longing to any category or matching any search term can be
tributed Systems; C.4 [Performance of Systems]:                                                 found by browsing the store’s web interface. Some applica-
Measurement techniques; C.5.3 [Computer System                                                  tions also require specific hardware features or other existing
Implementation]:      Microcomputers–Portable devices;                                          applications and libraries to be available on the end-user de-
H.3.3 [Information Storage and Retrieval]: Infor-                                               vice. Such applications are only available if the Google Play
mation Search and Retrieval–Information filtering; J.7                                          interface is accessed with an account registered on a device
[Computers in Other Systems]: Consumer products;                                                with the prerequisites available.
K.6.2 [Management of Computing and Information                                                     To explore Google Play content, we have created Play-
Systems]: Installation Management–Performance and us-                                           Drone, the first scalable Google Play store crawler and ap-
age measurement; K.6.5 [Management of Computing                                                 plication analysis framework. PlayDrone uses four key
and Information Systems]: Security and Protection–                                              techniques. First, PlayDrone leverages common hacking
Authentication                                                                                  techniques to easily circumvent security measures that Google
                                                                                                uses to prevent indexing Google Play store content. These
Permission to make digital or hard copies of all or part of this work for personal or
                                                                                                techniques include simple dictionary-based attacks for dis-
classroom use is granted without fee provided that copies are not made or distributed
for profit or commercial advantage and that copies bear this notice and the full citation
                                                                                                covering applications, and decompiling and rebuilding the
on the first page. Copyrights for components of this work owned by others than the              Google Play Android client to use insecure communication
author(s) must be honored. Abstracting with credit is permitted. To copy otherwise, or          protocols to communicate with the Google Play servers to
republish, to post on servers or to redistribute to lists, requires prior specific permission   capture, understand, and reproduce the necessary protocols.
and/or a fee. Request permissions from permissions@acm.org.                                     Second, PlayDrone leverages higher-level languages and
SIGMETRICS’14, June 16–20, 2014, Austin, Texas, USA.
                                                                                                frameworks to provide highly concurrent, distributed pro-
Copyright is held by the owner/author(s). Publication rights licensed to ACM.
ACM 978-1-4503-2789-3/14/06 ...$15.00.
                                                                                                cessing with modest implementation effort. PlayDrone
http://dx.doi.org/10.1145/2591971.2592003.                                                      is written in Ruby and uses the Sidekiq [31] asynchronous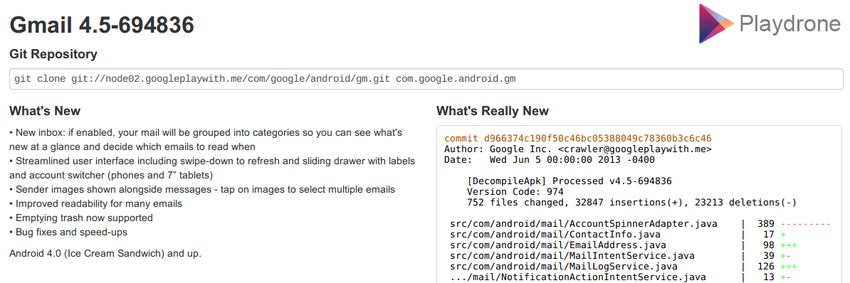
processing framework and the Redis [33] key-value store.           ning the applications. Our results demonstrate developer
Its performance scales easily by simply adding servers to          confusion may subvert the effectiveness of the widely used
the cluster, enabling PlayDrone to efficiently crawl the           OAuth open source standard for authentication. We notified
Google Play store on a daily basis even as its content con-        and worked with service providers to prevent these attacks,
tinues to grow. Third, PlayDrone stores each applica-              including providing Google with code to help them scan for
tion’s metadata and decompiled sources in a Git repository.        secret keys in applications as part of the Google Play appli-
This provides a simple versioning system for PlayDrone             cation publication process to protect users and developers.
to track and manage multiple versions of each application             This rest of this paper is organized as follows. Section 2
and analyze how Google Play store content evolves over             describes how PlayDrone intefaces with the Google Play
time. Finally, PlayDrone leverages the Elasticsearch [19]          API. Section 3 describes the PlayDrone crawler architec-
distributed real-time search and analytics engine using an         ture. and Section 4 measures its scalable performance. Sec-
indexing schema based on the Google Play store API to              tion 5 characterizes Android applications in Google Play.
make it easy to analyze and explore the Google Play store          Section 6 discusses library usage in Android applications.
metadata and content.                                              Section 7 describes our approach for efficiently detecting
   We have used PlayDrone to crawl the Google Play store           similar Android applications and our measurements of simi-
and analyze over 1,100,000 Android applications, including         larity among applications in Google Play. Section 8 presents
decompiling the source code for over 880,000 free Android          a study of secret authentication key usage and its problems
applications and analyzing over 100 billion lines of decom-        in Android applications. Section 9 discusses related work.
piled code. We demonstrate the usefulness of PlayDrone             Finally, we present some concluding remarks.
for analyzing application content by exploring four previ-
ously unaddressed issues in understanding Android applica-         2.   INTERFACING WITH GOOGLE PLAY
tions. First, we provide a characterization of Google Play
                                                                      To crawl the Google Play store, PlayDrone needs to
application content at scale. We discuss the relationship be-
                                                                   communicate with the Google Play store, which requires
tween application ratings and download frequency, discuss
                                                                   use of a Google account for all the necessary functionality.
how applications are categorized in Google Play and how the
                                                                   Using only a few Google accounts to crawl the entire store
choice of self-categorization can affect application visibility.
                                                                   might risk having the accounts disabled by Google, so we
We show how Google Play store content evolves over time,
                                                                   decided to harvest a large number of Google accounts. To
providing a measure of how often applications are released,
                                                                   do this quickly and efficiently, we had to address two prob-
updated, and removed. We also show that a small percent-
                                                                   lems. First, registering for a Google account requires solv-
age of free applications account for almost all downloads.
                                                                   ing CAPTCHAs. Second, registering for a Google account
   Second, we perform the first large-scale source code anal-
                                                                   requires phone verification when the same IP attempts to
ysis of library usage in Android applications. We show how
                                                                   register more than five accounts on a given day.
library usage differs between popular and unpopular applica-
                                                                      We addressed both issues by using a crowdsourcing Inter-
tions, including that native libraries are heavily used among
                                                                   net marketplace service to cheaply use other human users to
the most popular applications. As a result, Android systems
                                                                   register for Google accounts from a diverse set of IPs. Any
which only support Java-based applications are inadequate
                                                                   such service could be used, including dedicated CAPTCHA
to support the most widely-used Android applications [12,
                                                                   solver services such as Death by Captcha [15]. We used
40]. We show that over half of the free Android applications
                                                                   Amazon’s Mechanical Turk [1] for this purpose and deployed
use advertising libraries and discuss the size of the differ-
                                                                   a website, http://playdrone.io, for users to submit the
ent advertising networks. We also show that cross-platform
                                                                   registered Google account information back to us. Mechan-
frameworks and application generators make up a very small
                                                                   ical Turk is a service where registered users are paid small
fraction of the overall Google Play application content.
                                                                   dollar amounts to carry out trivial manual jobs. We posted a
   Third, we describe a new simple approach for efficiently
                                                                   task description on Mechanical Turk with the following sim-
detecting similar Android applications in the Google Play
                                                                   ple instructions: (1) Start your browser in incognito/guest
store. We use the structure of Android applications to an-
                                                                   mode. (2) Go on https://accounts.google.com/SignUp.
alyze similarity by considering application assets and re-
                                                                   (3) Fill out the requested information except “Mobile phone”
sources rather than requiring detailed source code analysis.
                                                                   and “Current email address” as they are not necessary. (4)
This provides a more scalable approach than code analy-
                                                                   Go to http://playdrone.io/accounts/new and enter the
sis approaches with comparable results. Our results show
                                                                   email and password of the account you created. (5) Answer
that roughly 25% of Google Play store application content
                                                                   with the returned confirmation code. The return confirma-
is duplicative, including various types of spam, application
                                                                   tion code allows the user to be paid for the work. Before the
rebranding, and application cloning.
                                                                   code is given, playdrone.io validates the submitted Google
   Finally, we present the first study of secret authentication
                                                                   account information to ensure that it is not duplicative and
key usage and its problems in Android applications. We
                                                                   can authenticate with Google services. Mechanical Turk
show that developers often store secret authentication keys
                                                                   prevents users from carrying out the same task twice, so
in their Android applications without realizing their creden-
                                                                   four copies of the task were created to benefit from dedi-
tials are easily compromised through decompilation. These
                                                                   cated users. We paid 10 cents per account, resulting in the
secrets are publicly available in Google Play. We show these
                                                                   creation of more than 500 Google accounts in just a few
keys can be used by malicious users to steal server resources
                                                                   hours for a little more than $50. Note that Google accounts
or user data available through services such as Amazon Web
                                                                   can be found on the black market for a similar price.
Services (AWS) or Facebook. Unlike compromised applica-
                                                                      Google exposes an internal, non-documented API to its
tions that only affect users who download and run them,
                                                                   Android Play clients to access the store and download ap-
these server vulnerabilities affect users without even run-
                                                                   plications over the air. PlayDrone replicates the behav-
ior of legitimate Android Play clients, each using a pre-
viously harvested Google account associated with Galaxy
Nexus device profiles. PlayDrone interacts with Google
Play servers through four different APIs. The first one is
the checkin API to associate a Google account with an An-
droid device, necessary to access the three other Google Play
APIs. Based on the device used, Google Play may make
available a different set of applications for the device. For
example, some applications may only be available to de-
vices in certain geographic locations. The search, details,
and purchase APIs are used to discover applications, fetch
application details, and retrieve binary download links, re-
spectively. We were fortunately able to leverage additional
information from non-Google sources [34, 24] to implement
most of the APIs.
However, because of the lack of documentation and source
code for the checkin API and our desire to make use of mul-
tiple Google accounts efficiently, we had to reverse engineer
that API ourselves. Google makes it difficult to derive the
checkin API by ensuring that communications between the
Google Play client and servers are over SSL, preventing the
capture of the wire protocol. However, since the Google
Play client and related service applications are compiled to
Dalvik bytecode, they were straightforward to disassemble
with baksmali [26]. We changed all https strings to http
ones and recompiled the client to send and receive unen-
crypted communications via an SSL proxy to the Google Figure 1: PlayDrone crawler architecture.
Play servers. This man-in-the-middle attack allowed the
capture of a real device registration over the wire and the
use and allows PlayDrone to leverage existing, well-tested
ability to reproduce it to reverse engineer the checkin API.
mechanisms such as Sidekiq, Redis, and Elasticsearch to fur-
Based on this API, we created a tool to register a fake An-
ther simplify its implementation. Second, to circumvent at-
droid device given an email password pair corresponding to
tempts by Google to limit crawling of the Google Play store,
a Google account. During the registration process, device
PlayDrone uses various techniques to hide its activities,
capabilities and metadata need to be sent to the Google
including using multiple Google accounts, rate limiting the
servers, including more than 50 data fields such as the mo-
number of requests for each account, and proxying requests
bile network provider, an IMEI number, the WiFi MAC
through a third-party service provider. Third, to analyze the
address, and OpenGL capabilities. We extracted this infor-
behavior of the Google Play store and its applications over
mation from a legitimate T-Mobile Galaxy Nexus device; all
time, PlayDrone leverages Git to store and track multiple
of our search results are therefore restricted to what would
versions of each Android application and metadata to allow
be accessible on such a device. The tool then uses this in-
the system to analyze how applications evolve as they are
formation, but randomly generates valid IMEI and MAC
updated from one version to another. Finally, PlayDrone
addresses to prevent device blacklisting by Google. A simi-
is designed with an easy-to-use web interface supported by
lar approach could be used for reverse engineering the other
Nginx and Elasticsearch to make it simple to search and per-
APIs if needed.
form various forms of analysis on the Android applications
and their metadata. For example, Figure 2 shows the use
3. CRAWLER ARCHITECTURE of PlayDrone to identify how the Gmail application code
Given a set of Google accounts and the APIs for com- has been updated.
municating with the Google Play servers, the PlayDrone PlayDrone uses the Redis key-value store [33] and the
crawler discovers and downloads Android applications with Sidekiq background processing framework [31] to efficiently
their metadata. Figure 1 shows the six components of the implement master-slave distributed computing. Sidekiq as-
PlayDrone crawler architecture: a Sidekiq job scheduler signs jobs to different slave machines. PlayDrone uses two
for distributing work to multiple machines, a Redis key- Sidekiq job queues, one for discovering Android applications
value store to store the jobs, an Amazon EC2 proxy, Git ver- in Google Play, and the other for downloading and process-
sion control repositories, an Elasticsearch distributed search ing applications. Redis runs on a master machine to store
and analytics engine, and an Nginx web server frontend. the job queues and track the use of Google accounts, which
These components work together to provide four key ben- applications need to be processed, and what machines have
efits. First, since crawling and analyzing the evolution of been assigned to process which applications. Although only
Google Play on a daily basis requires a fair amount of CPU a single master machine is used, PlayDrone leverages Re-
power and storage space, PlayDrone is designed using a dis very efficiently so that the architecture can scale out to
higher-level language that makes it simple to build a pow- support hundreds of slave worker machines.
erful distributed system that scales out by just adding more Discovering applications in Google Play is not straight-
servers. PlayDrone is written in Ruby, which provides an forward because Google does not provide any public list
excellent higher-level language ecosystem that is simple to of all the available applications in Google Play and limitsFigure 2: PlayDrone’s web interface showing the Gmail application and its Git diff.
the search results returned from querying Google Play to resides. This simple distribution mechanism takes better
no more than 500 applications. To overcome these prob- advantage of file locality as opposed to relying on a dis-
lems, PlayDrone uses a dictionary attack method involv- tributed file system, which would result in much worse file
ing roughly a million words as search terms to search Google system performance using Git and would add unnecessary
Play to find applications. To cover a broad range, words complexity to the system.
are used from multiple languages, including English, Ger- PlayDrone provides a plugin architecture to allow a user
man, French, Spanish, Swahili, Japanese, Italian, Danish of the system to write plugin middleware to perform various
and Swedish. A Sidekiq job is created for each search term, forms of processing and analysis on applications once they
making the discovery queue roughly a million jobs in length. have been downloaded. For example, we wrote a plugin
For each search job, PlayDrone sends a search request to for decompiling APKs into readable Java sources to enable
Google Play through its proxy. Because each search request easier comprehension of application behavior. The decom-
is a separate job, requests that need to be retried are iso- pile plugin uses apktool [35] to deflate the XML files and
lated in the event of a network issue or other problem. It is dex2jar [17] with a command-line version of JD-Core [37]
interesting to note that the Google Play API does not return for Java decompilation. The resulting Java sources are quite
any search results when hit directly from the PlayDrone readable and complete, though not directly suitable to re-
servers in Canada, but proxying the connection through an compile back into an APK. As another example, we wrote a
Amazon EC2 public IP in North Virginia causes the API to plugin for parsing the ./res/values/public.xml file to ex-
successfully return results. We do not know if the IPs we tract resource names and compute the MD5 hashes of asset
are using are banned, or if the filtering is based on IP geolo- and resource files in the application to facilitate detection of
cation, but this anecdotal evidence demonstrates the benefit similar applications as discussed in Section 7.
of our proxy approach. For each search request, Google Play PlayDrone stores the raw application metadata and de-
returns a list of applications in batches of 20 applications, compiled sources from crawling the Google Play store in
with a link to the next page if there are more results to be its respective Git repositories, with each commit tagged
fetched; the pagination stops at 500 results. Each appli- with the crawl date or the application version when ap-
cation in the list includes a link to a details page for the plicable. PlayDrone stores source code and application
application, which provides a description of the application. metadata in Elasticsearch, a distributed search and analyt-
When PlayDrone finds an application that it has not seen ics engine [19]. Elasticsearch has a simple web interface,
before, it stores the application unique identifier in Redis, allowing fast searching of the data and various forms of sim-
and adds the application to the Sidekiq processing queue to ple analysis before writing a middleware plugin to perform
be downloaded. more complete analysis of the data. A different index is
When a new application identifier is discovered, Play- used for each day of metadata from the Google Play store,
Drone downloads and processes the application. Play- making it possible to visualize the evolution of the Google
Drone uses Redis to atomically assign the application to Play store. For space reasons, only the most recent decom-
a machine for processing and instantiates a Git repository piled sources are indexed in Elasticsearch; older versions are
for the application on the assigned machine. PlayDrone stored in the respective Git repositories. Users can reindex
fetches the application’s details page, from which it extracts data in Elasticsearch from the Git repositories as they store
all of the application’s metadata and downloads and stores all the raw data collected from Google Play.
the application binary package (APK) into its Git reposi-
tory. Application metadata includes a list of related appli- 4. CRAWLER PERFORMANCE
cations, which PlayDrone uses to discover applications not
Because of the use of the Ruby ecosystem, the effort to
identified via the dictionary-based method. Only free appli-
build and deploy PlayDrone was fairly low. The entire
cation APKs are downloaded to avoid the costly expense of
application was less than 2000 lines of Ruby and HTML.
downloading all paid applications. Future processing of the
As a (unfair) comparison, GNU cat is 550 lines of code.
application is done on the machine where its Git repository
PlayDrone deployment is also quite simple and the sys-Details Search Purchase Number of applications
June 22, 2013 November 30, 2013
Throughput (req/s) 300
Free apps 691,517 884,217 (+28%)
250
Paid apps 195,703 223,259 (+14%)
200
150
All apps 887,220 1,107,476 (+25%)
100
50 Cumulative download counts (min-max)
0 June 22, 2013 November 30, 2013
Free apps 22G-85G 31G-116G (+37%)
10
Paid apps 111M-428M 126M-488M (+14%)
8
Latency (s)
All apps 23G-85G 31G-117G (+37%)
6
4
Table 1: Number of applications and cumulative download
2
counts on June 22, 2013 and November 30, 2013.
0
04:00 06:00 08:00 10:00 12:00 14:00 16:00 18:00 20:00
Time discover additional applications. During the first 90 min-
utes, the Search API is called at full capacity, artificially
Figure 3: A typical daily crawl from May 21, 2013 showing rate limited to 250 req/s to avoid getting our Google ac-
the throughput and latency of the Google Play API. counts flagged; we empirically measured the rate limit en-
forced by Google at 1000 req/min per account. The through-
put reaches maximum capacity because many words do not
tem setup is entirely automated with Chef [10] and Capis-
generate any results and the average API response is small
trano [9], which are tools written in Ruby. The amount
to parse. After 90 minutes, the response size gets larger and
of code we had to write to manage the entire system was
PlayDrone bottlenecks on CPU, parsing these lengthy re-
less than 550 lines of code, including configuration file tem-
sponses. When the Details API returns with a new version of
plates (e.g. upstart). PlayDrone is simple enough to be
the application that PlayDrone has not previously down-
understood and used by others, and yet can provide power-
loaded, the Purchase API endpoint is called to retrieve the
ful insights into Google Play. We have made PlayDrone
download link, and proceed to downloading the APK.
source code available on GitHub [38] for others to use.
Table 1 shows the number of applications PlayDrone
We deployed PlayDrone on ten servers on April 24, 2013,
discovered and downloaded from Google Play. By June 22,
each with Intel Xeon E3 turbo boosted at 3.8Ghz, 32GB of
2013, we indexed 887,220 applications. By November 30,
RAM, and 2x2TB drives. The initial crawling took around
2013, we indexed 1,107,476 applications, which is to the best
two days, limited by CPU due to the source decompilation.
of our knowledge the most extensive coverage of the Google
Once the initial crawling was complete on April 26, 2013,
Play store. Table 1 also shows cumulative download counts
the total size occupied by the Git repositories was 3.9TB
based on the download count ranges reported by Google
with 790,000 applications, an average of about 5MB per
Play. From June to November, The Google Play store grew
application. Subsequently, crawling Google Play for new
by 25% in the number of applications, and 37% in download
applications and application updates as well as identifying
counts. Based on the last official report from Google indi-
deleted applications took only several hours, enabling Play-
cating Google Play having 1 million applications as of July
Drone to crawl the entire Google Play store on a daily basis.
24, 2013 [39] and the rate of growth of Google Play content
Note that subsequent crawls after the initial crawl operate
shown in Figure 4, we estimate that our method covers over
in exactly the same manner as the initial crawl, but Play-
90% of the Google Play applications with a Galaxy Nexus
Drone does not need to download and decompile APKs for
on T-Mobile profile. To increase coverage, we could check in
applications that have not changed. After two months of
other types of Android devices to fetch, for example, applica-
crawling, the total size of the compacted Git repositories
tions that are restricted to tablets, or applications reserved
reached 5.3TB with roughly 960,000 applications, among
for a specific mobile carrier. Unless otherwise indicated, the
which 70,000 applications were removed from the Google
analysis of Google Play in the remainder of this paper fo-
Play store but archived by PlayDrone. We decommis-
cuses on the June 22, 2013 data collection.
sioned the crawler on June 22, 2013 to save resources. In
November 2013, we redeployed the crawler to validate that
our crawling method was still valid and analyze the evolu- 5. GOOGLE PLAY CHARACTERISTICS
tion of the Google Play store five months later. Using PlayDrone, we present aggregated characteristics
Figure 3 shows the throughput and latency of the Google of Android applications based on a comprehensive index of
API during a daily crawl using PlayDrone. A daily crawl Google Play application sources and metadata. Table 2
updates all the metadata of each known application, and shows the list of 887,220 applications available in the Google
discovers and downloads new applications. From 05:00 to Play store indexed by PlayDrone, separated into their re-
10:00, PlayDrone updates the metadata of all known ap- spective categories and whether they are free or paid. Game
plications in the system. The Details API endpoint is called applications are listed and categorized separately since they
once for each application. The response from Google servers are shown in a separate top-level directory in Google Play.
includes various metadata including the current number of Categories are listed from most to least number of appli-
downloads, the current version of the application, and a list cations, and each application can only belong to one cate-
of related applications. Because all application metadata is gory in Google Play. Overall, there are more than 3.5 times
stored in Git, PlayDrone bottlenecks at 50 requests per as many free applications as paid applications. The aggre-
second (req/s) due to disk I/O. Later in the afternoon from gate download counts of paid applications accounts for only
12:00 to 20:00, PlayDrone performs a dictionary search to 0.05% of total downloads from the store as shown in Table 1.Applications 10000
Category Free apps Paid apps Total apps 9000 Added
8000 Removed
Personalization 59,477 33,682 93,159 7000 Updated
Number of applications
Net added
Entertainment 72,685 16,772 89,457 6000
5000
Education 41,115 16,985 58,100 4000
Lifestyle 48,763 11,269 60,032 3000
Tools 47,608 12,092 59,700 2000
1000
Books & Reference 34,990 22,703 57,693 0
Business 41,701 2,675 44,376 -1000
-2000
Travel & Local 28,473 13,379 41,852 -3000
Music & Audio 33,221 4,550 37,771 -4000
-5000
Sports 19,906 4,889 24,795 Ap
ril
Ma Ma Jun Jun Jun No
v2
No
v
y4y7 e2 e6 e2 30
Productivity 18,575 5,557 24,132 27 2 4
Day
Health & Fitness 18,078 5,707 23,785
News & Magazines 21,919 1,260 23,179 Figure 4: Evolution of Google Play from April 26, 2013 to
Social 17,548 1,858 19,406 November 30, 2013. Missing bars represents lack of crawling.
Finance 16,731 2,191 18,922
Communication 14,725 2,999 17,724
by Google Play. Category names are confusing and overlap-
Media & Video 15,014 2,438 17,452
Shopping 11,547 678 12,225
ping. Since an application can only belong to one category,
Photography 8,407 2,331 10,738 the social and photography categories are mutually exclu-
Medical 7,137 3,405 10,542 sive, so a user browsing the latter category will find no sign
Transportation 8,099 1,340 9,439 of Instagram, arguably the most popular photo sharing ap-
Comics 3,798 1,721 5,519 plication. Similarly, business and productivity applications
Libraries & Demo 3,760 256 4,016 are categorized separately, health and fitness applications
Weather 2,810 563 3,373 cannot correspond to lifestyle ones, and music and audio
Total 596,087 171,300 767,387 applications must be categorized separately from media and
Games video applications. Given the large differences in the num-
Category Free apps Paid apps Total apps ber of applications in each category and the already confus-
Brain 36,533 8,938 45,471 ing category names, Table 2 may be useful to developers in
Casual 24,370 5,901 30,271
deciding which category to use for applications to increase
Arcade 22,517 6,309 28,826
Cards 5,589 1,619 7,208 their visibility by using a less populated category.
Sports Games 3,821 1,167 4,988 Figure 4 shows how the content of Google Play evolves
Racing 2,600 469 3,069 over time in terms of how often applications are released,
Total 95,430 24,403 119,833 updated, and removed from Google Play. Google removes
Grand Total 691,517 195,703 887,220 applications that do not comply with their terms and con-
ditions. On most days, more applications are added than
Table 2: Applications in Google Play as of June 22, 2013. removed, and more applications are updated than added.
During the May-June 2013 period, roughly 3000 new appli-
cations arrived daily on Google Play. This is far more than
We also measured that the top 10% of most downloaded ap- the Top New listing in Google Play, which is limited to 500
plications accounts for over 96% of the total downloads, and applications and provides an incomplete picture of new ap-
the top 1% of most downloaded applications accounts for plication content in Google Play. The November 2013 crawl
over 78% of the total downloads as of June 22, 2013. As of shows a 30% increase in application release and update rate.
November 30, 2013, the top 1% of most downloaded appli- The Google Play store is growing even faster than earlier in
cations accounts for over 81% of the total downloads. This the year, motivating the need for automated auditing and
suggests that a decreasing number of applications accounts quality control solutions.
for almost all application usage in Google Play, indicating Figure 5 shows a distribution of the average rating versus
the increasing difficulty of releasing a popular application. download count for applications in Google Play. Download
Other than games, personalization, a somewhat vague cat- counts are shown in bucketed ranges provided by Google
egory name, represents the largest category of applications, Play; exact download counts are not available. Free and
with over 90,000 applications. To find out more about this paid applications are shown separately. There are no paid
category, we ranked the most recurring terms in the titles applications with more than 5 million downloads. Users can
and descriptions of applications, discarding common nonde- rate an application with stars from 1 to 5, 5 being the highest
scriptive words such as not, the, can, it, or, etc. The top possible rating, and these ratings are aggregated by Google
three words among personalization applications were wall- Play per application to compute an overall average rating
paper, please, and like, accounting for 64,341 (69%), 35,953 for each application. For example, Figure 5 shows that for
(39%), and 26,563 (29%) applications, respectively. To com- applications with less than 500 downloads, there are applica-
pare with other categories, the proportions of applications tions with an overall rating as low as 1, applications with an
that contain these words across the rest of Google Play were overall rating as high as 5, and on average, paid applications
4%, 12% and 12%, respectively. This suggests that the per- have an overall rating of 4 with free applications having an
sonalization category may be infected with many useless ap- overall rating of greater than 4. One might expect that ap-
plications that users would consider as spam. This result plications with higher ratings would have higher download
also suggests that wallpapers deserve their own category. counts, but in fact the average of the overall ratings across
The problems with the personalization category are just all applications in any bucket of download counts was be-
one of the problems with the application categorization used tween 4 and 4.5. What did change was that as the downloadApplication Downloads # Ratings Rating
Free Paid TvQuran 1M-5M 13,675 4.93
5
Avg/min/max rating
4.5 Bi ety PDD 2013 RF 1M-5M 15,738 4.92
4
3.5
Holy Quran Maher Moagely 1M-5M 6,341 4.91
3 Slots Deluxe - Slot Machines 1M-5M 108,431 4.90
2.5 ÙÙ³Ø ÙÙ§Ø ÙµØØ ±Ø§ØٰأØÙ ©ØÙ¹Ø¯Ø£Ø 1M-5M 19,567 4.89
2
1.5 Alchemy Classic HD 1M-5M 37,706 4.89
1 Zombies...OMG! 1M-5M 46,236 4.89
00 -1k k-5k k-10k 0k-50 0k-10 00k-5 00k-1 M-5M M-10M0M-50 50M Quran - ÙÙ±ØÙÙ§Ø Ù¢Ø±ØÙÙ§Ø 1M-5M 17,666 4.89
k 0k 00k M M
Number of downloads My Prayer - ٪اØÙµØ 1M-5M 33,893 4.88
Cool Wallpapers HD 1M-5M 210,320 4.87
Figure 5: Ratings vs download counts for free/paid applica- GoToMeeting 1M-5M 4,696 2.41
tions on June 22, 2013. Outlook.com 10M-50M 78,049 2.39
TAMAGO hd 1M-5M 5,706 2.31
MOTOACTV 1M-5M 4,191 2.30
Screen Capture - No Rooting 1M-5M 2,963 2.28
counts increased, the rating for the lowest rated application Wet Lesbian 1M-5M 2,865 2.23
in a given download count bucket generally increased. For Ameba 1M-5M 35,933 2.21
example, there are free applications with only 1 star over- HRS App 1M-5M 5,778 1.99
all ratings with less than 50 thousand downloads, but there T-Mobile More For Me 5M-10M 1,763 1.84
are no applications with less than a 2.5 star overall rating DroidScale 1M-5M 5,450 1.67
with 10 million or more downloads. This increase in the
minimum overall rating as the download count increases is Table 3: Top 10 of the best and worse rated applications
even more pronounced for paid applications. Surprisingly with at least 1 million downloads on June 22, 2013.
though, there are still quite a few applications with very
low ratings despite their high download counts. 6. APPLICATION LIBRARY USAGE
Table 3 shows the top ten applications with the worse and Using PlayDrone to decompile applications, we present
best ratings which have at least a million downloads. The the first large-scale source code analysis of library usage in
ten worst rated list shows three applications that come pre- Android applications. One important question regarding li-
installed, namely the T-Mobile one, the Motorola fitness brary usage is how often native libraries are used in the
watch application, and the HRS hotel application prein- context of Android’s Java applications to improve their user
stalled on some HTC phones. Another interesting case is experience. A native library contains code compiled directly
the Outlook.com application that advertises in its descrip- for ARM and is invoked from the Java part of the applica-
tion to be the official Microsoft application for outlook.com. tion to improve performance or access low-level system calls.
The developer, “Microsoft + SEVEN”, has only one applica- Figure 6 shows the number and percentage of Android ap-
tion released under his account, while the official Microsoft plications that use native libraries versus download counts.
account, “Microsoft Corporation”, has 18 applications. We For non-popular applications, those with less than 50,000
were surprised that Microsoft hired SEVEN to develop their downloads, 14% of them on average have at least one native
outlook.com application and did not release it under the of- library. However, for popular applications, native library
ficial Microsoft account as releasing official applications un- usage increases significantly such that among applications
der other accounts trains users to be more vulnerable to with more than 50 million downloads, the vast majority of
phishing attacks. The worst rated application with at least them, 70% of them on average, have at least one native li-
one million downloads is DroidScale, which gives the users brary. For example, Instagram uses seven different native
the ability to turn their phones into a scale, enabling them libraries to optimize image processing and encoding perfor-
to weight regular household objects. We decompiled the mance, and Facebook uses nine different native libraries to
sources, to find that the weight is simply measured with access low-level system functionality, such as getting and
Random.nextDouble(), a randomly generated number. An setting the file descriptors limit of the current process.
ad-free version of the application is even offered for $0.99 As an application rises in popularity, developers are per-
that has 1000-5000 downloads. haps more willing to spend time and money to use native
The top ten best rated list shows half of the applications libraries to optimize the user experience of the application.
on the list being related to the Holy Quran. Such high rat- Although there are efforts to run Android on non-ARM plat-
ings can be explained by the target audience that prefers to forms for offloading and other reasons [12, 40], these systems
rate the content rather than the application. For example, rely on Java bytecode portability and do not support native
reading comments in the TvQuran application reveals un- library execution. Our results suggest that such approaches
happy users having sound issues or readability issues while are problematic in that they will be unable to run the most
still giving 5 stars. User comments and ratings are pub- popular Android applications. Despite Java’s portability,
licly available through Google+, so certain users may not these results indicate that the wide use of native libraries in
be comfortable putting a bad rating on a Holy Quran ap- popular Android applications may increasingly tie Android
plication. We also observe that some applications such as to ARM-based systems.
Slots Deluxe or Cool Wallpapers have 10 times more ratings Table 4 shows the breakdown of the most popular Java
count than other applications in the same download counts libraries used among free applications, separated into non-
bucket. While there might be some aggressive incentive from popular (With native libraries Without native libraries Advertising platform
100
% of applications using
286195
49978
101073
37804
65810
17120
18031
2912
2372
295
191
14
90 Name Non-popular apps Popular apps
80
native libraries
70 Google Ads 225,344 (35.73%) 25,946 (49.47%)
60 Google Analytics 64,799 (10.28%) 7,522 (14.34%)
50
40 Flurry 34,040 (5.40%) 6,477 (12.35%)
30 47813
Millennial Media Ads 23,120 (3.67%) 3,480 (6.64%)
16293
11576
20
7999
6102
3591
4862
1172
1373
258
210
10 MobFox 19,709 (3.13%) 1,219 (2.32%)
45
0 InMobi 17,432 (2.76%) 3,128 (5.96%)
5
00 -1k 5k 10k -50 -10 k-5 k-1 -5M -10 0
k 0k 00k M M -50M M RevMob 18,064 (2.86%) 1,018 (1.94%)
Number of downloads
Urban Airship Push 14,657 (2.32%) 525 (1.00%)
Figure 6: Native libraries usage compared to application Mobclix 12,315 (1.95%) 1,866 (3.56%)
popularity on June 22, 2013. Smaato 12,290 (1.95%) 241 (0.46%)
AirPush 10,773 (1.71%) 657 (1.25%)
most half of the non-popular applications using ad libraries SendDroid 9,907 (1.57%) 742 (1.41%)
while almost two-thirds of the popular applications use ad Adfonic 9,170 (1.45%) 435 (0.83%)
Jumptap 8,968 (1.42%) 570 (1.09%)
libraries. Ad libraries are most likely more common in popu-
HuntMads 7,275 (1.15%) 135 (0.26%)
lar free applications because there is a greater focus on mon- TapIt 7,131 (1.13%) 259 (0.49%)
etization for successful applications than many non-popular Umeng 5,742 (0.91%) 805 (1.53%)
free applications. Google is the most popular advertising TapJoy 3,358 (0.53%) 2,645 (5.04%)
platform, with almost half of the popular applications us- AppLovin 5,124 (0.81%) 824 (1.57%)
ing Google Ads. Among applications that use ad libraries, MoPub 4,187 (0.66%) 1,167 (2.23%)
Google dominates with roughly 75% market share. This LeadBolt 3,517 (0.56%) 475 (0.91%)
general trend of increased monetization of popular appli- Total 302,611 (47.98%) 34,348 (65.49%)
cations and Google’s dominant role is also seen for billing Social
libraries used for in-app purchases. Other than advertising, Name Non-popular apps Popular apps
Facebook SDK 77,489 (12.29%) 6,206 (11.83%)
social libraries are the next most popular with almost 15%
Twitter4J 41,606 (6.60%) 2,057 (3.92%)
of free applications using those libraries. The official Face- Total 92,495 (14.67%) 6,990 (13.33%)
book SDK is the most widely used, followed by Twitter4J, Cross-platform framework
an unofficial Twitter library. Name Non-popular apps Popular apps
Table 4 also shows the percentage of free applications PhoneGap 36,915 (5.85%) 606 (1.16%)
built using cross-platform frameworks or application gen- Adobe Air 12,761 (2.02%) 619 (1.18%)
erators. Almost 15% of non-popular applications are built Titanium 8,316 (1.32%) 138 (0.26%)
using these frameworks and generators, but only about 3% of Total 57,991 (9.20%) 1,363 (2.60%)
popular applications use these frameworks and generators. Application generator
Name Non-popular apps Popular apps
Beginning developers may find it useful to use application
Bizness Apps 10,011 (1.59%) 3 (0.01%)
generators to simplifying development, or use cross-platform App Inventor 9,560 (1.52%) 152 (0.29%)
frameworks to be able to deploy an application on both An- Andromo 6,294 (1.00%) 156 (0.30%)
droid and iOS platforms. However, the measurements sug- iBuildApp 4,149 (0.66%) 25 (0.05%)
gest that these generators and frameworks most likely lack Mobile by Conduit 3,989 (0.63%) 21 (0.04%)
the necessary functionality and degree of control for building Total 34,003 (5.39%) 357 (0.68%)
more sophisticated applications with richer user experiences Bug tracking
that are more likely to become popular and widely used. Name Non-popular apps Popular apps
BugSense 59,550 (9.44%) 4,251 (8.11%)
Acra 25,658 (4.07%) 1,450 (2.76%)
7. SIMILAR APPLICATIONS Total 84,896 (13.46%) 5,663 (10.80%)
Billing
Leveraging PlayDrone, we introduce a simple approach
Name Non-popular apps Popular apps
to identify similar applications in Google Play for the pur- Google Billing 27,846 (4.42%) 6,312 (12.04%)
poses of detecting duplicative content and application clones. Paypal 16,943 (2.69%) 374 (0.71%)
Similar applications are those that appear to share the same Authorize.net 8,464 (1.34%) 1 (0.00%)
source code origin, share common design and layout pat- Amazon Purchasing 3,356 (0.53%) 1,044 (1.99%)
terns, and offer comparable application level experiences to Total 44,798 (7.10%) 6,686 (12.75%)
the end user. Previous studies have shown Android applica- Audio/graphics engine
tion clones to be vectors in spreading malware [43] as well as Name Non-popular apps Popular apps
instruments to divert users and advertising revenues from le- FMOD 8,199 (1.30%) 1,705 (3.25%)
gitimate applications [23]. While prior research has focused Unity3D 8,158 (1.29%) 1,601 (3.05%)
AndEngine 7,098 (1.13%) 1,080 (2.06%)
on code analysis to identify similar applications, this can
libGDX 6,311 (1.00%) 1,395 (2.66%)
be problematic for obfuscated code or applications where Corona SDK 3,750 (0.59%) 396 (0.76%)
the core logic is written in multiple programming languages, Total 23,774 (3.77%) 4,222 (8.05%)
such as in PhoneGap and Adobe Air applications. Addition-
ally, code analysis methods are often too computationally Table 4: Application libraries usage on June 22, 2013.
expensive to scale to analyze all of Google Play.
Our scalable approach comes from a simple observation:
humans can typically just look at the screenshots of applica- of images. Android applications are structured such that
tions to determine if applications are similar. Humans recog- these visual aspects are embodied in resources and assets,
nize patterns by looking at the UI layouts or the similarity such as images, sounds, UI layouts, or application settings.Resources and assets are two different ways to embed visual 200000
180000 Asset hashes
Number of applications
elements in Android applications, the former having a locale- 160000 Resource names
aware naming hierarchy through the ‘R’ Java class while the Both
140000
latter provides raw access to files. Based on this observa- 120000
100000
tion, we leverage the structure of Android applications to 80000
use a feature set of resource names and asset signatures, the 60000
40000
latter generated by taking the MD5 hash of each asset of 20000
an application excluding its icon and XML files. This fea- 0
0.6 0.7 0.8 0.9 1.0
ture set is easy to identify and compute even for obfuscated
Score threshold
application code, making it fast enough to use with daily
crawls of Google Play. Figure 7: Similar apps vs score threshold (cutoff = 300).
Using PlayDrone to study 610,000 free applications down-
loaded and decompiled on May 5, 2013, we found roughly 58 100000
Cutoff 100
million unique resource names and 45 million unique asset Cutoff 300
Number of clusters
10000
Cutoff 1000
signatures. Because the most common resource names and Cutoff 3000
1000
asset signatures occur in widely-used application libraries,
their frequency is high and they are poor indicators of ap- 100
plication similarity. To address this issue, we use a simple 10
blacklist approach with a cutoff parameter C that ignores
1
resource names and asset signatures appearing in more than
1 10 100 300 1000 3000 10000
C applications. With a cutoff of 300, 45,000 resource names Cluster size (excluding victim application)
and 14,000 asset signatures are ignored, which represent
0.08% of the unique resource names and 0.03% of the unique Figure 8: Number of clusters of similar apps vs cluster size
asset signatures considered. (threshold = 0.8).
To determine whether two applications AppA and AppB
with respective feature sets A and B are similar, we use the
|A∩B| We then divided the similar applications taking into ac-
Jaccard index J(A, B) = |A∪B| . The resulting score is a real count developer information. Each application uploaded to
number [0, 1]. If the Jaccard index is above a certain thresh- Google Play is signed by a developer using a private key.
old T , the two applications compared are considered simi- We compared the ownership of each similar application by
lar. We compute the Jaccard index separately for resource examining both the developer name associated with the ap-
names and asset signatures, ignoring the blacklisted ones. plication account and the certificate included in the appli-
Similar applications are grouped into clusters. For simplic- cation package. If either of these attributes match, applica-
ity, we assume that applications typically derive from one tions are labeled as rebranded. If neither author attributes
other application, so that each application should only be match, applications are labeled as clones. Out of 158,204
included in at most one cluster. We therefore merge clusters similar free applications, 115,896 were rebranded and 42,308
whenever an application has multiple matches belonging to were clones. Sources of rebranding included changing the
different clusters. Each cluster is assigned a victim appli- languages displayed in the user interface and reusing code
cation, which is the application with the most downloads, from one application as a template for a new application,
under the assumption that it is also the one most likely to especially for wallpaper, trivia, and travel information ap-
have been the duplicated. We then merge the clusters based plications. Sources of cloning included use of automated
on resource names with those based on asset signatures. All tools and wizard services, copying open source applications,
of this is accomplished by first indexing all resource names contracting the same third party to develop applications
and asset signatures in Elasticsearch, then querying Elas- for a range of clients in a specific industry, and plagiarism,
ticsearch to match applications. The former is done once though the latter is difficult to detect without knowing the
per APK and takes a couple of hours while the latter takes relationships among developers. For a developer of an origi-
around 20 minutes on our cluster of ten machines. The nal application who therefore does know these relationships,
number of similar applications is the sum of the size of each PlayDrone can be useful to detect application cloning in
detected cluster, excluding their victim application. various ways, from identifying plagiarized applications to
Figure 7 shows the number of similar applications de- monitoring statistics over all clones to gauge the health and
tected when varying the score threshold T ranging from popularity of an open-source project.
0.6 to 1.0. A value of 1.0 represents an exact match of To evaluate the accuracy of our approach, we took a ran-
resources and assets, while 0.8 allows similar applications dom sample of 400 applications flagged as similar and man-
to have some differences. We compare the effectiveness of ually compared them to their corresponding victim applica-
using both resource names and asset signatures versus only tion. Out of 400 applications identified as similar, manual
using one or the other. Asset signatures alone detect fewer inspection indicated that 5% were false positives that in-
similar applications because many applications have no as- cluded similar resources and assets but actually differed on
sets at all. Figure 8 shows the distribution of clusters by account of visible design and functionality differences. We
sizes. The distribution shows that clusters with sizes larger also compared PlayDrone’s method of similarity detection
than 300 are infrequent, suggesting 300 as a suitable cutoff to a code analysis tool we built based on extracting a fea-
to exclude common application libraries. We base the rest ture set of Android SDK methods from the DEX bytecode
of our discussion on using C = 300 and T = 0.8. Using these of an application [41]. Running the same 400 applications
parameters, there were 158,204 free duplicative applications through the code analysis tool, only 79% of the manually
in Google Play, roughly 25% of the free application content. verified applications were correctly identified.PlayDrone’s better performance can be explained by directly embedding tokens in their SDKs. Unique % Valid
classifying code cloning techniques [32]. While most code denotes how many of the unique tokens from the June 22,
analysis methods are able to identify similar applications 2013 snapshot were still valid on November 11, 2013. To
with variations in identifiers, literals, types, whitespace, lay- test the validity of tokens, we sent authentication requests
out and comments (Type-1 and Type-2), they are less reli- to their respective providers. Note that these results repre-
able in detecting similar applications with changed, added, sent a conservative measure of the number of tokens in ap-
or removed statements (Type-3) and ineffective at detecting plications in Google Play as the simple search method does
similar applications implemented through different syntatic not detect tokens in obfuscated code because of its reliance
variants (Type-4). Because PlayDrone’s detection tech- on regular expression pattern matching.
nique is agnostic to the complexity of the code transforma-
tions used for cloning, it is the first system that can identify 8.2 Amazon Web Services
similar Android applications across all four clone types, in-
AWS provides various cloud computing resources that can
cluding Type-3 and Type-4 clones. This makes PlayDrone
be purchased by developers using AWS accounts and ac-
not only fast and efficient, but also a more robust system
cessed by the developers’ applications using AWS tokens
for detecting application similarity in Google Play.
associated with the respective AWS accounts. As shown in
Table 5, we found 308 unique AWS tokens from the June
8. AUTHENTICATION TOKENS 22, 2013 snapshot. Five month later, we tested the validity
The rise of the Web 2.0 architecture has seen a prolifer- of these tokens by sending an AWS API request to count
ation of cloud service APIs. Service to service communi- the number of storage buckets in the AWS Simple Storage
cation is usually authenticated with secret tokens that are Service (S3). We found 94% of the tokens were still valid
known only by the involved parties. When implemented five months later. These read-only API calls were carefully
as intended, secret tokens are never shared and are stored chosen to preclude any impact to AWS customer’s data or
on trusted servers where they can be properly safeguarded. resources. Amazon provides documentation describing best
However, as these service to service protocols have been practices and a variety of ways to configure AWS tokens
adapted to mobile applications, we have discovered using with different levels of privilege [2]. Despite this documented
PlayDrone that developers are now embedding secret to- flexibility, we were surprised to find that even though some
kens directly into applications. While developers may be- developers only intended their applications to use AWS to-
lieve their application sources are well guarded, the ease of kens to access AWS Simple Database or Flexible Payment
decompilation and the widespread availability of mobile ap- Services, the tokens embedded in the applications were root-
plications makes recovering secret tokens relatively simple. level credentials providing access to all the other AWS ser-
We discuss how we used PlayDrone to discover secret to- vices, including creating and shutting down Elastic Compute
kens used with Amazon Web Services (AWS) and several Cloud (EC2) instances or freely accessing S3 data.
OAuth providers and demonstrate the potential for abuse Exposure of the AWS tokens can provide access to exist-
of these tokens by malicious actors. ing AWS resources, potentially leading to a range of confi-
dentiality, integrity, and availability attacks, as well as the
8.1 Discovering Tokens capability to allocate new resources at the owner’s expense.
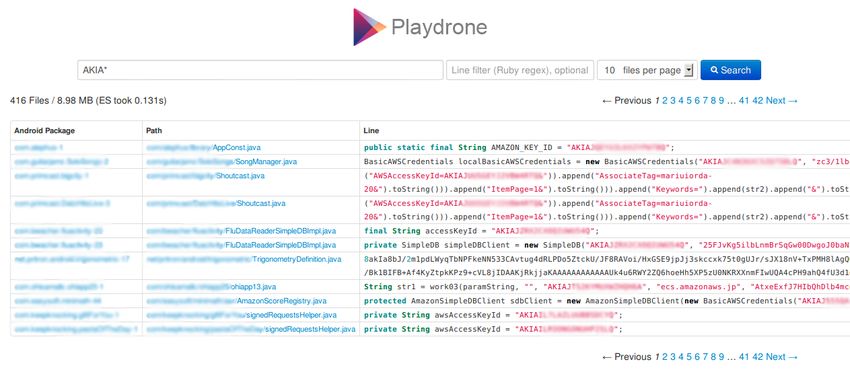
We used PlayDrone’s search engine to quickly probe ap- With 288 valid tokens, an attacker could potentially setup
plication source code by searching words such as “secret” a botnet of AWS EC2 instances. While AWS has a number
and found a large number of insecure tokens used for var- of mechanisms to thwart such activities [30], usage patterns
ious services because developers often use constant names on AWS are elastic and inherently unpredictable, which may
with the substring “secret” to identify their secret tokens. make it hard to detect stolen resources. Unless billing alerts
Our search results show that services often use tokens with are manually configured, billing statements will not reflect
service-specific formats. For example, the AWS API is ac- usage until the end of the billing cycle. Amazon recognizes
cessed with an AccessKeyId which starts with the substring the risks of embedding secret keys in Android applications
“AKIA”. Figure 9 shows a source search for all strings start- and actively advises developers against this practice in their
ing with “AKIA” revealing many AWS tokens. To extract Android SDK documentation [5]. Additionally, AWS pro-
authentication tokens, we created a flexible framework that vides mechanisms for Android developers to securely lever-
searches for secret tokens in the decompiled Java source files age AWS from their application, such as AWS Token Vend-
of applications using regular expressions. Tokens usually ing Machine [4] and AWS Web Identity Framework [3]. The
come in pairs, typically a client ID and its corresponding problem is that developers often find it simpler to embed to-
secret key functioning similar to a username and password. kens in their applications without being aware of best prac-
For example, in the case of AWS, requests are signed using a tices and understanding the resulting security risks.
40 character string SecretAccessKey. To discover AWS cre- Because of the potential for malicious use of the AWS to-
dentials, we configured PlayDrone to find pairs of strings kens in Google Play, we reached out to Amazon to warn
matching AKIA[0-9A-Z]{16} and [0-9a-zA-Z/+]{40} that them of this security risk. Amazon responded quickly by
are at most 5 lines apart. identifying their affected customers based on the list of to-
Table 5 summarizes various authentication tokens for widely- kens we provided, and reaching out and working with their
used services that we found using PlayDrone. Total Can- customers to resolve the security issues, though some mis-
didates denotes the number of tokens found across the entire takenly assumed that Amazon itself was scanning for secret
Google play store from the June 22, 2013 snapshot. Unique keys in Android applications [8, 11, 28]. We also reached out
Candidates denotes the number of different tokens. The dif- to Google to ask them to scan for AWS and other tokens in
ference between total candidates and unique candidates can applications as part of the Google Play application publica-
be explained by developer keys reuse, and various libraries tion process to help protect users and developers. GoogleYou can also read