D THEMATH A SOLUTION FOR STUDENT SUCCESS - Quality Enhancement Plan 2015 - York Technical ...
←
→
Page content transcription
If your browser does not render page correctly, please read the page content below

D THE
MATH
 A SOLUTION FOR STUDENT SUCCESS

Quality Enhancement Plan 2015

         York Technical College
         Reaffirmation Review
         October 27-29, 2015
York Technical College
                 452 South Anderson Road
                    Rock Hill SC 29730

                Quality Enhancement Plan

      Do The Math: A Solution for Student Success

           Dates of Reaffirmation Committee Visit
                   October 27 – 29, 2015

                        Prepared by:

Mrs. Kathy Hoellen, Dean for Center for Teaching and Learning
                   khoellen@yorktech.edu
                       (803) 327-8030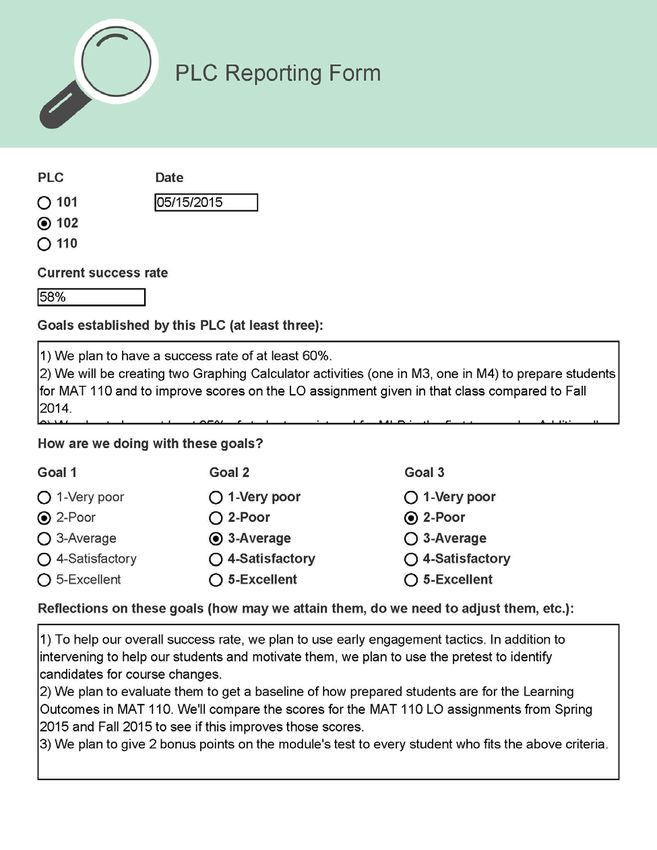
Contents

Executive Summary....................................................................................................................................... 3
York Technical College .................................................................................................................................. 4
An Institutional Process – Journey towards the QEP .................................................................................... 5
Key Issues Emerge....................................................................................................................................... 10
Assessing Student Learning......................................................................................................................... 13
Supplemental Instruction – A Model for Success ....................................................................................... 16
Creating an Environment to Support Student Learning ............................................................................. 17
Defining the QEP ......................................................................................................................................... 21
   Math Enrollment and Success Graphs .................................................................................................... 23
Implementation of the QEP ........................................................................................................................ 25
   Course Redesign...................................................................................................................................... 25
   Supplemental Instruction Lab ................................................................................................................. 34
   Faculty Success Strategies....................................................................................................................... 35
Anticipated Outcomes of the QEP .............................................................................................................. 38
QEP Oversight ............................................................................................................................................. 41
Assessment of the QEP ............................................................................................................................... 44
College Preparation for the Quality Enhancement Plan ............................................................................. 56
QEP Budget ................................................................................................................................................. 58
Closing ......................................................................................................................................................... 60
QEP Rubric Index ......................................................................................................................................... 61
Bibliography ................................................................................................................................................ 62
Appendices.................................................................................................................................................. 63
   Appendix A – State of the Strategic Plan ................................................................................................ 63
   Appendix B – ESSI Action Plan ................................................................................................................ 64
   Appendix C – General Research on Student Success .............................................................................. 68
   Appendix D – Faculty Survey................................................................................................................... 69
   Appendix E – Literature Review References ........................................................................................... 73
   Appendix F – SI Coordinator and SI Leader Position Description ........................................................... 75
   Appendix G – PLC Reporting Forms ........................................................................................................ 77
   Appendix H – Student Rating of the Learning Experience – Course/Instructor Evaluation ................... 81
   Appendix I – Faculty Performance Management System (FPMS) .......................................................... 83

York Technical College – Quality Enhancement Plan                                                                                                                 2

Executive Summary

York Technical College values learning and is dedicated to the improvement of learning
outcomes in every academic area of the organization. The College’s core mission of student
success is the foundation of its sustainability. Specifically, the mission, “building our community
through maximizing student success,” clearly articulates the College’s intent to keep student
success as its highest priority. The Quality Enhancement Plan (QEP), Do The Math, aligns with
the College’s mission and is focused on improving student learning outcomes and the
environment supporting student learning. The QEP is directly related to institutional planning
efforts involving extensive data review, analysis, and ongoing discussions with college
constituents. The College will intentionally connect the success of faculty to the success of
students through the following goals:

       GOAL ONE - Student Learning: Increase student learning in select high risk, high
       enrollment courses - Math 032 (Developmental Math), 101 (Beginning Algebra), and
       102 (Intermediate Algebra).

       GOAL TWO - Environment Supporting Student Learning: Increase faculty success
       in selected high risk, high enrollment math courses - Math 032 (Developmental
       Math), 101 (Beginning Algebra), and 102 (Intermediate Algebra).

Multiple strategies have been identified to achieve the goals. The improvement of student
learning includes early connections, active/collaborative learning, and integrated support
through supplemental instruction. Strategies for faculty success include strategic professional
development, clear performance criteria and measurement, and faculty communities.

York Technical College dedicates sufficient resources to initiate, implement, sustain, and
complete the QEP by allocating the necessary fiscal, human, and technical resources
necessary for implementation, assessment, and completion of the plan. Regular reporting will
provide stakeholders with progress status on goals, activities, and outcomes.

                The formula is simple: Increased Faculty Success + Increased Student Success
                                                                           = Community IMPACT

York Technical College – Quality Enhancement Plan                                                3
York Technical College

York Technical College (YTC), a member of the South Carolina Technical and Comprehensive
Education System, is a public, two-year, associate degree granting institution located in Rock
Hill, SC. The College is an open admissions institution, for qualified students, that awards
associate degrees, diplomas, and certificates. The College’s service area encompasses York,
Chester, and Lancaster counties, and includes the Catawba Indian Nation located on a rural
reservation in York County. Fall enrollment for 2014 was 5,061, of which 2,482 maintained full-
time enrollments.

York Technical College opened its doors in 1964 with a single building serving the needs of
many. At the time, it was called a “Technical Education Center,” and its focus was on workforce
development for industrial jobs. Today, the College offers a wide range of instruction in three
general career and academic areas: Industrial and Engineering Technologies; Health and
Human Services; and Business, Computers, Arts & Sciences which includes a university
transfer program. The College also offers corporate and continuing education, and customized
training for businesses, and has additional off-campus centers are located in Lancaster and
Chester counties.

York Technical College is unique within in the South Carolina Technical College System
because of its location in the Charlotte, North Carolina metropolitan area. Financial services,
technology, energy and healthcare industries expand beyond the border to drive the local
economy in York, Lancaster and Chester counties. York Technical College graduates gain skills
and find meaningful and financially rewarding employment in a myriad of fields within their local
communities.

                                  Building Our Community Through Maximizing Student Success

York Technical College – Quality Enhancement Plan                                              4
An Institutional Process – Journey towards the QEP
In 2008, York Technical College hired its third president, Dr. Gregory F. Rutherford. As with any
leadership change, a renewed vision is set for the College. As part of an inclusive and
participatory method for engaging the College’s faculty and staff, a series of listening sessions
were held where employees were able to share their concerns of the present state of the
College as well as their views on what efforts and initiatives would lead to its future success. As
such, more than 600 ideas, statements, and suggestions were generated and subsequently
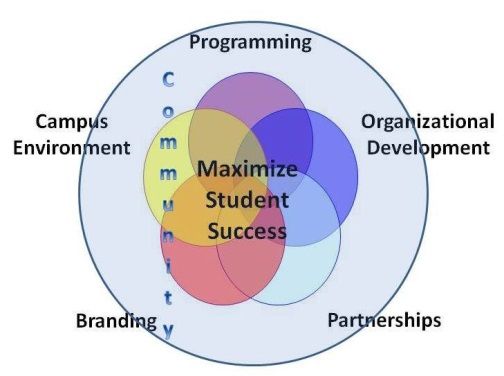
categorized for similarities. From there, emerged the College’s vision and strategic goals. The
six strategic focus areas are: student success, programming, campus environment, marketing
and branding, organizational development, and partnerships. Additionally, a simplified version of
the College’s mission statement was crafted – Building Our Community Through Maximizing
Student Success – in an attempt to ensure that the entire College community could clearly and
succinctly understand and articulate its mission.
As a result of the development of the strategic themes, additional dialogue and structured
engagement activities were held to address how to improve student success. These efforts
resulted in suggestions, varying in scope and focus from teaching and learning practices to
college-wide procedures and processes. For example, faculty and staff were concerned that
allowing students to register after the start of a semester disrupted the learning environment and
set students up for failure. As a result, the College made a procedural change and eliminated
late registration in 2009. Faculty also noted that students who do not attend class regularly are
more likely to fail. In 2010, the College implemented attendance guidelines with a maximum
absence of 10% and faculty discretion to encourage students to continue if faculty/student
discussion indicates the ability to succeed. These changes were not made solely based on the
recommendation of faculty, but based on a fundamental understanding that students need to be
in class in order to succeed. It was also a demonstration of the leadership’s willingness to
eliminate process and procedural barriers that potentially interfere with student success. While
these changes were in alignment with the premise of the College’s mission, they did not have a
significant positive impact on student success (Figure 1).
Six Strategic Focus Areas
York Technical College – Quality Enhancement Plan 5
Opening Fall to Opening Fall
                                   Student Success Rates
         100.0%
          90.0%
          80.0%
          70.0%
          60.0%
          50.0%
          40.0%
          30.0%
          20.0%
          10.0%
           0.0%
                     2006-07      2007-08     2008-09     2009-10      2010-11     2011-12      2012-13        2013-14
          Success     57.2%        59.6%       60.5%        57.7%       60.5%        59.1%       61.2%         60.9%

Figure 1: Fall to fall student success over an eight year period. The College’s success measure is a fall-to-fall student
success rate that tracks all students enrolled in a credit program in a given fall semester and then calculates the
percentage of those who graduate, return, or transfer to another institution in the following fall semester.

                                                                        How can we improve student success?

York Technical College – Quality Enhancement Plan                                                                        6
In recognition of the need for continuous improvement, the College reviewed its strategic goals
in 2012 and again sought feedback from its key stakeholders including faculty, staff, students,
Area Commission (governing board, and the YTC Foundation Board of Directors). These
participants provided input on the College’s perceived strengths, weaknesses, opportunities,
and threats (SWOT) as it related to the College mission and six strategic themes. A cross-
functional team reviewed the feedback to determine if the College should maintain or alter its
strategic direction. The team summarized its recommendations in a one-page document titled,
State of the Strategic Plan (Appendix A). The College’s six strategic goals (Figure 2) were
reaffirmed with a renewed focus on the key strategies to achieve the goals and for the continued
positive impact on the College’s most valuable assets, employees and students.
College’s most valuable assets, employees and students
York Technical College – Quality Enhancement Plan 7Strategic Goals Strategies
Student Success • Strengthen student connections with the College
through engagement opportunities both inside and
We will answer the question: what outside the classroom.
sustainable action improves student success, • Refine processes and provide optimum support
and customer service to prospective and current
and then we will do it. students.
• Deploy high expectation learning strategies that produce
measurable success.
• Drive process improvements measured by
outcomes in enrollment, retention, graduation,
and placement.
Partnerships • Reinforce partnerships with high schools and career
centers to provide a seamless transition to College.
We will seek mutually beneficial partnerships. • Broaden articulation agreements with four-year
institutions.
• Expand partnerships with business and industry to
promote workforce development.
• Build relationships with local, state, and federal
government entities.
• Foster relationships to increase resources.
• Cultivate our internal community.
• Strengthen alumni bonds and engagement with the
College.
Programming • Provide sustainable programs with value-added
outcomes.
Our programs will link where our students • Require integrated interdivisional planning and
want to go, where our employers want to go, development of new programs where appropriate.
and where our community wants to go.
Campus Environment • Provide an environment that serves the needs of the
College’s educational programs and support services.
Our campus and centers are more than • Create an environment that supports engagement and
parking and shelter for classes. They will learning everywhere.
• Provide a safe, secure, and universally-accessible
welcome us all, support our goals, and be an environment.
inspiration.
Branding and Marketing • Promote the College for its academic and technical
excellence in service to the community.
What we do is special, valuable, and magical. • Develop marketing tactics that are targeted to increase
We will tell our story. enrollment and maximize student success.
• Coordinate consistent and unified messaging for all
College communications, internally and externally.
Organizational Development • Build a culture of self-awareness, personal responsibility,
and strategic thinking.
We will improve ourselves, so we can • Cultivate an environment that supports the College’s
improve others. commitment to inclusion, collaboration, understanding,
and trust.
• Build a highly-skilled and diverse faculty and staff.
• Assure continuous improvement.
Figure 2: York Technical College strategic goals.
York Technical College – Quality Enhancement Plan 8As part of the efforts to improve student success through increased student engagement, in
2010, the college developed an action plan based on key takeaways from attending the
Entering Student Success Institute (ESSI) at the Center for Community College Student
Success at the University of Texas. Colleges that participate in the Survey of Entering Student
Engagement (SENSE) come together at the Institute to review data, learn strategies to improve
the entering student experience, and formulate an action plan for initiating appropriate
strategies. The YTC action plan (Appendix B) focused on three key strategies:
1. Create an inventory of promising practices of student engagement (Early
Connections, Integrated Support for Learners, and Active/Collaborative
Learning) and support the focus with professional development
opportunities in these areas.
2. Align and integrate college admissions, department-level orientation, and
faculty advising. Admissions personnel, academic departments, and
faculty advisors all have a unique role to play in guiding students toward
success.
3. Develop leadership of academic department chairs (especially as they
relate to and support #1 and #2 above). Expand department chair role
from manager to leader. Department chairs should provide leadership
and set expectations for higher levels of engagement in the classroom.
These strategies have been the focus of college-wide professional development activities and
meetings since 2011. Professional development for faculty has focused on effective teaching
practices such as early connections, integrated support for learners, and active/collaborative
learning.
While significant efforts were implemented to advance the strategic themes, the organizational
development theme did not have a similar concentrated focus or plan as with the other themes.
Organizational development research tells us that one of the most important components
necessary to improve organizational effectiveness is the involvement of employees in identifying
problems and proposing solutions (Jenkins, 2011). As such, in 2014, the College established a
team of faculty and staff (Table 1) to review input and institutional data, further engage the
College community, and identify key issues directly related to student and faculty success.
Ultimately, the Organizational Development team was charged with moving beyond
transactional changes to identify solutions that transform and significantly impact student
success.
York Technical College – Quality Enhancement Plan 9Table 1. Organizational development team.
Organizational Development Team
Name Department and Position at College
Jordan Baker Science, Instructor
Kiwanna Brackett Administrative Office Technology, Instructor
Ryan Crider English/Languages, Department Chair
Edie Dille Business and Information Technology, Associate Dean
Michael Graham Administrative Support for BCAS, Office Manager
Shannon Godwin Instructional Developer & QLC Member
Kathy Hoellen Center for Teaching & Learning, Dean & QLC Member
John McGill Arts and Sciences, Associate Dean
Ed Moore Building Construction Trades, Department Chair
Shelly Myers Center for Teaching & Learning, Administrative Specialist
Taunya Paul Developmental Studies, Department Chair
James Robson Counseling and Support Services, Dean
Edwina Roseboro-Barnes Human Resources, Director
Mary Beth Schwartz Institutional Effectiveness & Research, Director
Jared Smith Science, Instructor
Wesley Spinks Math, Department Chair
Debbie Tertinger Early Childhood Development, Instructor
Sonia Young Corporate & Continuing Education, Program Manager & QLC Member
Key Issues Emerge
The Organizational Development Team was committed to an in-depth analysis of the College’s
student success data, in comparison to the established student success goals (Figure 3). The
College’s key measure of student success is a fall-to-fall success rate; this measure tracks all
students enrolled in a credit program in a given fall semester and then calculates the
percentage of those who graduate, return, or transfer to another institution in the following fall
semester.
In-depth analysis of student success data
York Technical College – Quality Enhancement Plan 102013-14 Success Rates
w/ 2014-15 Goals
Opening Fall 100.0%
Opening Fall to Ending Fall 84.3% Goal: 96%
Opening Fall to Opening Spring 75.6% Goal: 86%
Opening Fall to Ending Spring 64.3% Goal: 76%
Opening Fall to Opening Fall 60.9% Goal: 70%
0.0% 20.0% 40.0% 60.0% 80.0% 100.0% 120.0%
Figure 3: 2013-2014 Fall to fall student success with retention goals.
A comprehensive review of student success and retention data found that some of the courses
with the highest enrollment are also the courses with the highest success risks. These courses
are also typically gateway courses (general educational courses serving as core requirements
for most academic programs regardless of discipline). Data for these high enrollment courses,
especially in English, mathematics, and science, show success rates that fall below the
College’s 70% goal (Figure 4). Thus, the team believed that an increase in faculty and student
success in high risk, high enrollment courses would have the greatest impact on overall student
success at the College and provide a focus area for an action plan. Ultimately, all academic
departments and programs benefit from improved student success in gateway courses.
High risk, high enrollment courses have greatest opportunity for impact
York Technical College – Quality Enhancement Plan 11Enrollment and Success Rates Twenty Largest Courses
(Fall 2014 & Spring 2015)
1600 90%
1400 80%
1200 70%
60%
1000
50%
800
40%
600
30%
400 20%
200 10%
0 0%
ENG PSY MAT MAT HSS COL ENG ENG MAT CPT SPC MAT SOC MAT BIO COL RDG HIS BIO ACC
101 201 101 032 205 101 100 102 102 170 205 031 101 110 210 103 100 201 101 111
Enrollment 1365 961 887 878 761 718 682 639 575 530 513 512 511 505 491 486 420 383 363 360
Success Rate 69% 76% 64% 64% 77% 82% 60% 75% 60% 72% 84% 58% 69% 64% 56% 77% 74% 76% 63% 64%
Average Success Rate: 70%
Figure 4: Fall 2014 & spring 2015 enrollment and success 20 largest courses.
As a result of the review of overall success in gateway courses, another key issue emerged -
success gaps within courses. Effective teaching has a positive impact on achievement gaps
(Haycock, 2001). Reviewing achievement gaps provides another perspective on success data
to better understand retention and persistence. Table 2 shows the range of student success in
the top ten courses with the largest enrollment.
Achievement gaps provide another perspective on student success
York Technical College – Quality Enhancement Plan 12Table 2. Success ranges for top ten largest courses.
Range of Success Rates for All Sections of Top Ten Largest Courses
(Fall 2014 & Spring 2015)
Fall 2014 Spring 2015
Low High Low High
COL 101 52% 100% 71% 100%
CPT 170 53% 90% 38% 85%
ENG 100 39% 92% 29% 84%
ENG 101 33% 96% 25% 100%
ENG 102 39% 95% 44% 100%
HSS 205 59% 93% 45% 100%
MAT 032 25% 91% 25% 86%
MAT 101 44% 100% 30% 81%
MAT 102 38% 80% 29% 77%
PSY 201 60% 96% 29% 100%
In order to influence student success, it is crucial to consider the wide range of student
achievement gaps within the courses. While it is recognized that there are multiple reasons for
achievement gaps, teaching effectiveness is in our collective sphere of control.
Assessing Student Learning
In recognition of the possible impact of gateway courses on student success, coupled with prior
initiatives implemented by the College’s Science and Mathematics Departments, the
Organizational Development Team wanted to explore what efforts could positively impact
student success. The team reviewed the data from the variety of faculty/staff and student inputs
(surveys, focus groups, meeting minutes, etc.), other Quality Enhancement Plans focused on
gateway courses, and research on student success, retention, and completion (Appendix C).
In 2012, the College’s Science Department implemented a pilot project that required mandatory
tutoring in BIO 101 (Biological Science I), BIO 210 (Anatomy & Physiology I), and BIO 211
York Technical College – Quality Enhancement Plan 13(Anatomy & Physiology II). These courses are typically considered high-risk gateway courses
that are heavily populated with first-time freshmen. The effort resulted in student success
increases of at least 10% per course. The average success rate for the 794 students in the
courses was 59%. In the course sections participating in the tutoring initiative, 136 students
attending less than six tutoring sessions and achieved 69% success. Conversely, the 28
students who attended six or more tutoring sessions achieved 85% success (Figure 5).
Comparison of BIO Success Rates in Groups of Students that
Utilized Tutoring Compared to the General Population of BIO
Students
90%
80%
70%
Success Rate
60%
50%
40%
30%
20%
10%
0%
6 Visits General Population
Figure 5: Comparison of BIO success rates based on tutoring sessions.
In the 2014-2015 academic year, the College’s Math Department followed the Science
Department’s initiative by implementing a tutoring initiative of their own. The department used
module exams as the basis for measuring improvements in student success.
Tutoring results in positive outcomes
York Technical College – Quality Enhancement Plan 14The module exam average score for students participating in mandatory tutoring increased in
every math course. (Table 3).
Table 3. Math success results comparing students with tutoring to students without tutoring.
Differences between Scores in Module One and Module Two by Original Score and Whether
Student Received Tutoring - Fall 2013
Changes in Average
Module Scores in MAT 101 MAT 102 MAT 110
Points
Students who Scored
Below 70 and Received +5.7 +4.9 +13.2
Tutoring
However, the Math Department experienced challenges with varying student consequences for
not attending the tutoring sessions, along with staffing issues in the tutoring center. Despite the
issues encountered, the Math Department’s project also resulted in positive outcomes.
Login data from the Academic Coaching & Tutoring (ACT) Center (Figure 6) show that math
assistance is consistently the highest requested subject in the Center.
Figure 6: Fall 2014 ACT student visits by subject area.
Building on the successes of the tutoring initiatives of the Math and Science Departments, the
Organizational Development team wanted to further explore methods that would integrate
academic support, but in such a way as to engage faculty and students with consistent,
successful interventions. The team was particularly interested in supplemental instruction
York Technical College – Quality Enhancement Plan 15initiatives found in the research to provide positive outcomes in student success (Arendale,
2001). This led the team to focus further research on supplemental instruction (SI) models.
Supplemental Instruction – A Model for Success
Supplemental instruction (SI) identifies and targets the integration of course assistance into high
risk courses, not high risk students. Data indicate that SI is correlated with higher mean grades,
lower failure and withdrawal rates, and higher retention and graduation rates (Dawson, P., van
der Meer, J., Skalicky, J., and Cowley, K. 2014). Because pre-screening is not required to
identify high risk students, SI eliminates the stigma normally associated with remediation in
traditional academic assistance programs. In fact, David Arendale states in Understanding the
Supplemental Instruction (SI) Model that “… a designation of “high risk” for a course makes no
prejudicial comment about the professor or the students.” Assistance is focused on eliminating
issues before they become problems for student success. Arendale (1994) further identifies
components of SI that contribute to student success, listed as follows:
1. The service is proactive rather than reactive.
2. The service is attached directly to specific courses.
3. SI leaders attend all class sessions.
4. SI is not a remedial program.
5. SI sessions are designed to promote a high degree of student interaction
and mutual support.
6. SI provides an opportunity for the course instructor to receive useful
feedback from the SI leader.
Tutoring and supplemental instruction differ significantly. Tutors have strong backgrounds in the
area they tutor and apply various approaches to teaching of the subject. They may tutor, both
individually and in small groups. However, they may not have taken the exact class with the
instructor for whom they are tutoring. On the contrary, supplemental instruction leaders work
closely with a specific set of classes. They attend the actual classes with the students they
support and work closely with the course instructor. SI leaders utilize lesson plans, but do not
re-teach the material from class; instead, they focus on difficult concepts, student collaboration,
and learning and studying strategies. SI leaders are trained on specific approaches to support
the students in the classes for which they provide assistance.
York Technical College – Quality Enhancement Plan 16Support should be “an extension of the classroom.” It is suggested to “remove the stigma
associated with accessing support by making support something that most or all students
receive” (Dadgar, Nodine, Bracco, & Venezie, 2013). Supplemental instruction combines these
strategies to provide inescapable engagement.
Creating an Environment to Support Student Learning
A plan to increase student learning is not complete without strategies to assess and improve
teaching effectiveness. It is equally important to identify strategies of effective teaching, and to
evaluate effectiveness based on student learning. A great deal of knowledge exists about the
practices of effective teachers. However, creating the environment for effective teaching by
aligning hiring, mentoring, professional development, and performance evaluation to support the
consistent use of effective practices is not always done or is not consistent.
Strengthening the student learning environment is a critical factor to improving student success.
While significant professional development opportunities centered around the College’s ESSI
student engagement plan existed, there had not been a focus on strategic implementation and
purposeful connection of professional development to student learning outcomes and
measurement. Consequently, significant results were not achieved. An effective plan to
improve student outcomes must be fundamentally driven by faculty and focused on student
learning. Therefore, the Organizational Development Team surfaced the need to better connect
professional development to the College’s performance planning and review process. This
connection supports individual connection of professional development to improvement planning
and will provide meaningful information on the impact of professional development, leading to a
more strategic use of professional development funds.
In alignment with the strategic themes, a focused plan for strengthening organizational
development became a key component of the College’s ongoing discussion. Leadership and
college-wide meetings included discussion of organizational development and its relationship to
student success. The team focused on addressing the following critical questions:
• If we were designing an organization focused on student success, what
would it look like?
• How would it be different from present practice?
• How does the organization and development of our people and functions
impact student success?
York Technical College – Quality Enhancement Plan 17A deeper exploration of retention and persistence improvement revealed the need to better
understand the prevailing philosophies of our faculty regarding teaching and learning, their
sources of motivation, and their comfort levels with implementing change. A faculty survey
(Appendix D), distributed in May 2014, was used to gather insight into faculty needs and
motivation. The survey was designed to establish a baseline in these areas and was sent to 362
full-time and part-time faculty who taught during the 2013-14 academic year. A total of 105
faculty responded for a response rate of 29%. “The ability to positively impact students’
learning” was the highest response to what motivates faculty to do their best work (Figure 7).
Respondents were asked to rank items as to the extent that they are motivators. On a six
point scale, where six denotes the highest motivation and one denotes the lowest
motivation, the top three motivators for all respondents were student-centered and could
be considered intrinsic in nature: ‘ability to positively impact students’ learning’, ‘positive
student feedback’, and ‘respect of colleagues.’
Average Score for Motivation – Six Point Scale FT PT
Ability to positively impact students' learning 5.78 5.75
Positive student feedback 5.47 5.44
Respect of colleagues 5.22 5.20
Opportunity for career growth 5.10 5.08
Financial incentives 4.83 4.90
Opportunity to integrate technology in ways that enhance the 4.81 4.67
teaching/learning process
Opportunity for professional development 4.78 4.64
Opportunity to mentor peers 4.17 4.20
Public recognition 3.80 3.82
Opportunity to secure grants to implement new teaching/learning 3.63 3.61
methodologies
Figure 7: Excerpt from Faculty Voices Report on faculty survey results.
In September 2014, the Organizational Development Team hosted a facilitator-led discussion
for the College community to explore feedback from the survey and to identify common themes.
A cross-functional representation of faculty and staff were invited along with members of the
Organizational Development Team and the Quality Learning Council. Sarah J. Shumpert,
Director of Instructional Support at Tri-County Technical College in Pendleton, SC, served as a
neutral facilitator for the discussion.
Following the discussion, the Organizational Development team organized the key issues into
three key categories: faculty optimization, professional development (teaching skills and
York Technical College – Quality Enhancement Plan 18strategies), and support for teaching and learning (Table 4). The team then took a closer look at
the feedback to define root causes and to map issues to current initiatives.
Table 4. Key Issues from discussion of faculty survey.
Key Issues from Facilitator-led Discussion of Faculty Survey
Faculty do not have enough time for planning and innovation.
Faculty Optimization
We do not use faculty talent efficiently and effectively highlighting individual strengths.
Teaching performance criteria and measurement are inconsistent.
We do not have a college process for preparing adjunct faculty.
Development
Professional
We do not plan faculty professional development based on performance goals.
Not all faculty and students are engaged in learning.
Teaching & Learning Support
Not all students have clear career goals and a clear academic path.
We have not identified important academic path milestones and are not connecting with
students at each milestone.
We are losing students through attrition.
Students do not voluntarily access support services outside the classroom such as
coaching and tutoring.
Supporting and developing faculty through clear performance criteria, focused competency
attainment, and faculty collaboration emerged as an important component of increased faculty
and student success. A literature review (Appendix E) supports the conclusion that teaching
effectiveness directly contributes to the overall success of students.
In a student survey issued in 2012, the College asked students what one thing the College
could do to enhance their learning experience. The largest category of responses (36.2%)
included a reference to teaching effectiveness. Having well-trained, motivated faculty is crucial
to student success. Moreover, it is visible within the body of publications on the topic that
college professors must maintain a high level of proficiency in order to provide the best learning
York Technical College – Quality Enhancement Plan 19environment for students. Ineffective teaching results in poor student learning, low faculty
engagement, and high faculty turnover (Lancaster et al, 2014). It is important to identify and
implement effective strategies that support the development of excellent teachers and to
successfully measure the results.
In The Heart of Student Success published by the Center for Community College Student
Engagement (2010), four key strategies are identified to strengthen the classroom experience:
1. Classroom Engagement
2. Integrated Student Support into learning experiences
3. Faculty Professional Development focused on engaging students
4. Institutional policies focused on creating the conditions for learning
Common practices among effective teachers include:
• High expectations for student learning
• Clear, focused instruction
• Closely monitored student learning progress
• Use of alternative teaching strategies when learning does not occur
• Student understanding of their progress
• High standards for classroom behavior
• Excellent personal interactions with students
• Multiple measures of learning
• Teacher’s ability to reflect and collaborate with colleagues
• Ongoing professional development and continuous improvement
As an example, Wallace Community College (Dothan, AL), found that a system of training and
clear accountability for faculty has positive impacts on faculty engagement and student success.
They have significantly closed student achievement gaps by closing teaching effectiveness
gaps through strategic professional development focused on effective teaching strategies,
professional collaboration through faculty learning communities (faculty groups who discuss
teaching and learning, test and develop new models of practice, try out teaching innovations,
and assess student learning results), and accountability through performance evaluation based
on student learning. They increased student retention by 16% and student success by 10% in
the 2012-2013 academic year.
York Technical College – Quality Enhancement Plan 20Defining the QEP
The Organizational Development Team reviewed multiple models of supplemental instruction
through research and collecting advice from other colleges. One in particular, a well-known and
successful model for supplemental instruction, from the International Center for Supplemental
Instruction at The University of Missouri – Kansas City, was reviewed. From this review, two
methods of SI delivery surfaced – voluntary and mandatory.
After researching SI models, the following considerations were discussed:
• Being strategic about courses selected for SI implementation.
• Students don’t do optional.
• If mandatory, how do you justify SI to exemplary students?
• If SI is mandatory only for students who fall below a certain success rate,
they may perceive it as punishment.
• You will need strong faculty support and training.
• It’s difficult to find student SI leaders in a community college since the best
students tend to complete on time.
• Done correctly, SI can provide additional help for students without the stigma
of remedial or traditional tutoring sessions.
• SI implementation is a lot of work initially, so consider appropriate staffing
such as an SI coordinator.
• Provide appropriate training for faculty and SI leaders.
Faculty found that in past initiatives where students were directed to utilize academic support
services, the most successful students are more likely to follow directions, while students who
most need the assistance, are less likely to participate. Discussions with colleges implementing
SI initiatives revealed similar challenges. Students “don’t do optional.” The question then
became how to integrate SI, make it mandatory, and not have it become another mandate
without accountability. One of the team members suggested we look at Claflin University; her
daughter was in a chemistry course where the SI component was scheduled with the class and
appears on the student’s academic class schedule. If we could connect the SI component to
the class for registration purposes, it would show as a class meeting on the student’s schedule.
Career and Technical courses often use this model to integrate classroom components with
York Technical College – Quality Enhancement Plan 21knowledge application experiences.
Upon review of the feedback from other institutions, the pilot tutoring efforts at the College, and
the opportunities for strengthening the learning environment, the Organizational Development
team decided that the implementation of a mandatory supplemental instruction program would
be ideal for the implementation of at York Technical College. While consideration for the project
focus was given to multiple high risk gateway courses in science, English, and math, the focus
was narrowed to improving faculty and student success in select math courses: MAT 032
(Developmental Math), MAT 101 (Beginning Algebra), and MAT 102 (Intermediate Algebra).
MAT 032 (Developmental Math), 101 (Beginning Algebra), & 102 (Intermediate Algebra) are key
gateway courses at York Technical College. Of all students graduating from the College in
2013-14, 60% successfully completed at least one of these courses. As noted previously in
Figure 4, these courses have high enrollment, but low success. Additional analysis
demonstrates that successful completion of these courses is necessary for subsequent
persistence and success.
The most recent college fall-to-fall success rate is 60.9% (fall 2013 to fall 2014). The College
analyzed the difference in fall-to-fall success rates for students who were successful in MAT
032, MAT 101, or MAT 102 in fall 2013 and compared them to those who were not successful in
the course. The differences are summarized in Table 5. The average fall to fall success rate for
those who were successful in one of these math courses was 68% compared to 37% for those
who were not successful. These differences are stark and provide further evidence that math
success is a key component for college success.
Table 5. Fall 2013 to fall 2014 success rates for MAT 032, MAT 101, MAT 102.
Successful in Course Not Successful in Course
Total Students Fall to Fall Success Rate Total Students Fall to Fall Success Rate
MAT 032 309 63.4% 207 30.9%
MAT 101 335 71.9% 173 33.5%
MAT 102 150 70.7% 134 50.7%
Total 794 68.4% 514 37.0%
Figures 8-12 show recent enrollment, success, and subsequent course success in the QEP
math courses.
York Technical College – Quality Enhancement Plan 22Math Enrollment and Success Graphs
MAT 032 - Enrollment and Success Rates
1200 90.0%
80.0%
1000
70.0%
800 60.0%
50.0%
600
40.0%
400 30.0%
20.0%
200
10.0%
0 0.0%
2010-11 2011-12 2012-13 2013-14 2014-15
Enrollment 907 981 873 1006 946
Success 59.6% 60.3% 60.6% 58.3% 64.1%
Five Year Average: 60.6%
Figure 8: MAT 032 enrollment and success.
MAT 101 Enrollment and Success Rates
1200 90.0%
80.0%
1000
70.0%
800 60.0%
50.0%
600
40.0%
400 30.0%
20.0%
200
10.0%
0 0.0%
2010-11 2011-12 2012-13 2013-14 2014-15
Enrollment 1094 1081 1011 1060 987
Success 61.9% 62.6% 64.8% 66.4% 63.4%
Five Year Average: 63.8%
Figure 9: MAT 101 enrollment and success.
York Technical College – Quality Enhancement Plan 23MAT 102 Enrollment and Success Rates
800 90.0%
700 80.0%
600 70.0%
500 60.0%
50.0%
400
40.0%
300 30.0%
200 20.0%
100 10.0%
0 0.0%
2010-11 2011-12 2012-13 2013-14 2014-15
Enrollment 644 707 659 700 649
Success 53.9% 64.1% 60.2% 51.6% 59.3%
Five Year Average: 57.8%
Figure 10: MAT 102 enrollment and success.
MAT 101 - Enrollment and Success after
Successful Completion of MAT 032
500 90.0%
450 80.0%
400 70.0%
350 60.0%
300
50.0%
250
40.0%
200
150 30.0%
100 20.0%
50 10.0%
0 0.0%
2010-11 2011-12 2012-13 2013-14
Enrollment 409 454 409 354
Success 62.3% 60.4% 62.3% 64.1%
Four Year Average: 62.3%
Figure 11: MAT 101 after successful completion of MAT 032.
York Technical College – Quality Enhancement Plan 24MAT 102 - Enrollment and Success after
Successful Completion of MAT 101
700 90.0%
600 80.0%
70.0%
500 60.0%
400 50.0%
300 40.0%
200 30.0%
20.0%
100 10.0%
0 0.0%
2010-11 2011-12 2012-13 2013-14
Enrollment 601 615 578 486
Success 56.7% 55.1% 51.4% 53.7%
Four Year Average: 54.2%
Figure 12: MAT 102 after successful completion of MAT 101.
These courses provide opportunities for a positive impact on the greatest number of students
and programs and were selected as the focus of the College’s Quality Enhancement Plan.
Implementation of the QEP
Once math and supplemental instruction were identified as focus areas, the team was faced
with developing a strategy for implementation. Several concerns emerged to include: how to
make SI mandatory and not have it appear punitive; how to offer enough SI sessions to
accommodate students’ varied academic and work schedules; how to make it a part of the class
so that even the more successful students benefit (since SI is not simply a re-teaching of class
material and develops skills and knowledge that benefit every student); and how to design
classes with the necessary support and make it sustainable.
Course Redesign
The integration of supplemental instruction into the selected math courses will require a course
redesign for each course. Members of the Organizational Development Team reviewed the six
redesign models from the National Center for Academic Transformation (NCAT). The group
decided to use components from the Supplemental, Replacement, and Emporium Models for
the redesign of the selected math courses. These proven strategies, combined with the NCAT
redesign roadmap, are guiding our course redesign process. The NCAT model focuses on
York Technical College – Quality Enhancement Plan 25whole course redesign and active learning. Math faculty are currently redesigning course learning modules with special attention to the focused outcomes. Additionally, the team decided to redesign the courses to a 2.5 hour/1.5 hour model where the class section meets 2.5 hours a week and the SI lab meets 1.5 hours a week. The selected 3.0 credit hour math courses - Math 032 (Developmental Math), MAT 101 (Beginning Algebra), and MAT 102 (Intermediate Algebra) - will be redesigned to include a 2.5 hour class with a 1.5 hour SI lab. This option preserves the three credit hour assignment for the courses and allows for the additional time each week for supplemental instruction. Since the lab time is connected to registration for the course, students who register for the math course will automatically be registered for the supplemental instruction component. The challenges of course redesign, schedule coordination, and timing, prevented implementation of the new courses in the fall 2015 semester. Key to the success of the redesign process is the immediate engagement of the SI Coordinator with faculty. During the redesign for SI, the SI Coordinator will train the faculty on the role of the future SI Leaders and how to best develop the course for inclusion of supplemental instruction. The specific roles and responsibilities for the SI Coordinator and SI Leaders are clearly defined in Appendix F. Phasing the redesign of math courses will allow the Math Department to provide appropriate release time for redesign and the opportunity to learn and share through each phase of the implementation. During the redesign phases, engaging students with math tutoring and success conferences will continue to be a foundational component of the learning environment. The Math Department recommended MAT 102 as the first course for redesign because it has the lowest success rates of the three courses and the fewest number of sections (approximately seven). The experience gained from MAT 102 will allow the team to learn valuable lessons for a more productive scale up. Additional SI training will occur in fall 2015 to prepare department faculty as well as the SI coordinator for the redesign. The first modified course, MAT 102, will be offered in the fall of 2016. The redesigned MAT 101 will be offered in the spring of 2017. MAT 101 generally offers 10-12 sections in a regular semester. The redesigned MAT 032 will be offered in the summer of 2017. MAT 032 generally has 20-25 sections in a regular semester but fewer in the summer, thus a summer implementation will support an easier transition. All redesigned MAT courses and sections will York Technical College – Quality Enhancement Plan 26
be implemented by fall 2017. As such, four years of data will be presented in the QEP Impact
Report in fall 2020. The Implementation of the redesigned courses is phased (Table 6) in order
to provide sufficient time for assessment and refinement of the strategies.
Table 6: Course implementation.
Implementation of Redesigned Courses
Fall 2016 Spring 2017 Summer 2017 Fall 2017
MAT 102 X X X X
MAT 101 X X X
MAT 032 X X
Table 7 provides a summary of the implementation plan organized by key tasks for each year of
the project
Table 7: Implementation plan and timeline.
Year One: 2015-2016
Goal Intended Timeline/
Strategy Supported Responsible Action Required Outcome Status
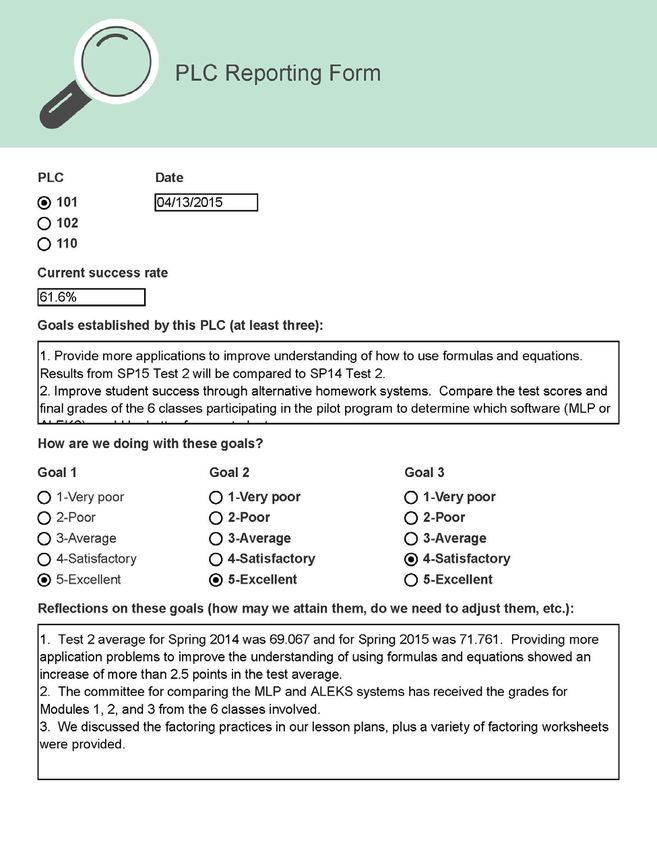
Establish Faculty 1,2 Math Establish faculty PLCs are active Spring 2015
Professional Department PLCs
Learning COMPLETE
Communities
Perform MAT 1 Math Collect and perform Complete Summer
exam question Department/ exam item analysis analysis with % 2015
analysis Assessment for MAT courses success and
Team weak areas
identified. COMPLETE
Learning
Outcomes goals
established.
Appoint QEP 1, 2 Organizational Identify team Committee and Fall 2015
Implementation Development members and teams in place
Team Team appoint to roles
COMPLETE
such as
Assessment Team
Write job 1 QEP Examine Position Fall 2015
descriptions for Implementation recommendations Descriptions are
SI Coordinator & Team/ HR from other colleges completed and
SI Leader & International ready to
Center for advertise
COMPLETE
Supplemental
Instruction and
write position
descriptions
Schedule SI 1 QEP Schedule and SI Coordinator Fall 2015
Coordinator Implementation provide training completes
COMPLETE
Training Team training
Identify/hire SI 1 QEP Conduct search SI Leaders hired Spring 2016
Leaders Implementation and hire SI Leaders
Team
York Technical College – Quality Enhancement Plan 27Goal Intended
Strategy Supported Responsible Action Required Outcome Timeline
Train SI Leaders 1 QEP Schedule and train SI Leaders Summer
Implementation SI Leaders trained 2016
Team
Redesign MAT 1 Math Redesign courses Courses are Fall 2015/
102 & revise Department, SI for 2.5 hour redesigned and Spring 2016
syllabi Coordinator, class/1.5 hour SI ready for Fall
accordingly Instructional Lab 2016
Development implementation
Develop SI 1 QEP Examine similar Observation Fall 2015
Leader Assessment rubrics, write & rubric written
Observation Team develop an and formatted DRAFT
Rubric observation form for use COMPLETE
Develop Faculty 2 QEP Examine similar Observation Fall 2015
Observation Assessment rubrics, write, & rubric written
Rubric Team develop and formatted COMPLETE
observation form for use
Develop surveys 1,2 QEP Develop perception Survey is Spring 2016
for Assessment surveys with developed and
students/faculty/ Team opportunity for ready for use
SI leaders useful feedback
Faculty training 1,2 QEP Identify training Participating Fall 2015/
on teaching Implementation needs, assess faculty have Spring 2016/
strategies & Team against existing professional Summer
coaching opportunities & development 2016
develop and/or plans & have IN
identify training to completed PROGRESS
cover gaps training
Schedule Math 1 Math Schedule courses Courses are on Spring 2016-
sections to Department/BC with labs in the schedule for Opening Fall
include SI labs AS Leadership registration Fall 2016 registration
scheduling system registration
Develop QEP 1,2 QEP Develop reports to QEP reports are Fall 2015
reports Assessment be used to keep ready for use
Team Implementation
Team and COMPLETE
constituents up-to-
date
Establish QEP 1,2 Math Establish PLC PLC members Fall 2015
success goals Department/ success goals are aware of
for PLCs QEP and working
COMPLETE
Assessment toward success
Team goals
Develop faculty 2 Individual Develop Plans are Fall 2015
performance faculty with performance plans complete and
plans including Department to include submitted within
professional Chair professional the College
development development and Performance
success goals as a Planning &
COMPLETE
part of the Review system
College's
performance
planning and
review process
York Technical College – Quality Enhancement Plan 28Goal Intended
Strategy Supported Responsible Action Required Outcome Timeline
Identify & equip 1 QEP Identify space, Math lab is Fall 2015 -
math lab space Implementation assess ready for SI Summer
Team/Math infrastructure sessions 2016
Department/Fa needs, modify
IN
cilities space as needed
PROGRESS
for infrastructure &
technology
Annual QEP 1,2 QEP Prepare and share QEP status Summer
Report Assessment annual QEP status report shared 2016
Team report with
Implementation
Team, QLC,
CASA, & EC
Year Two: 2016-2017
Goal Intended
Strategy Supported Responsible Action Required Outcome Timeline
Run MAT 101 & 1 Math Run classes with Courses are Fall 2016/
102 with SI Department SI labs implemented SPR & SUM
2017
Math Lab 1 QEP Infrastructure Lab Fall 2016
Implementation modifications and modifications
Team/Math technology are complete
Department/Fa additions and SI labs
cilities implemented
Redesign MAT 1 Developmental Redesign courses Courses are Fall 2016/
101 and 032 & Math, Math for 2.5 hour redesigned and Spring 2017
revise syllabus Department, SI class/1.5 hour SI ready for Fall
accordingly Coordinator, Lab 2017
Instructional implementation
Development
Gather feedback 1 QEP Implement surveys Data analysis Spring 2017
from SI Assessment and aggregate complete and
participants Team data feedback
shared with
QEP
Implementation
Team
Perform SI 1 SI SI Coordinator Observations Fall 2016/
Leader Coordinator/Ma uses observation complete and Spring 2017
Observations th Department tool to perform recorded
Chair observations of
each SI Leader
Perform faculty 2 PLC teams PLC members Observations Fall 2016/
observations observe and complete and Spring 2f017
provide feedback recorded
for team members
Provide training 1 SI Coordinator Schedule and SI Leaders Ongoing Fall
for SI leaders provide training for trained 2016/ Spring
SI Leaders 2017
York Technical College – Quality Enhancement Plan 29Goal Intended
Strategy Supported Responsible Action Required Outcome Timeline
Provide training 2 QEP Schedule and Faculty trained Ongoing Fall
for faculty Implementation provide training for and sharing in 2016/ Spring
Team/PLC faculty and/or PLCs 2017
Teams document outside
training
Establish QEP 1,2 Math Establish PLC PLC members Fall 2016/
success goals Department/QE success goals are working Spring 2017
for PLCs P Assessment toward success
Team goals
Develop faculty 2 Individual Develop Plans are Fall 2016
performance faculty with performance plans complete and
plans including Department to include submitted within
professional Chair professional the College
development development and Performance
success goals as a Planning &
part of the Review System
College's
performance
planning and
review process
Annual QEP 1,2 QEP Prepare and share QEP status Summer
Report Assessment annual QEP status report shared 2017
Team report with
Implementation
Team, QLC,
CASA, &
Executive
Committee
Year Three: 2017-2018
Goal Action Intended
Strategy Supported Responsible Required Outcome Timeline
Run MAT 032, 1 Math Run classes with Courses are Fall 2017/
101 & 102 with Department/ SI labs implemented SPR & SUM
SI Developmental 2018
Math
Gather feedback 1 QEP Implement Data analysis Ongoing on
from SI Assessment surveys and complete and schedule
participants Team aggregate data feedback Assessment
shared with Team
QEP determines
Implementation
Team
Perform SI 1 SI Observe each SI Observations Fall 2017/
Leader Coordinator/Math Leader complete and Spring 2018
Observations department chair recorded
Perform faculty 2 PLC teams PLC members Observations Fall 2017/
observations observe and complete and Spring 2018
provide recorded
feedback for
team members
York Technical College – Quality Enhancement Plan 30You can also read