Sea Level Rise Vulnerability in San Juan County, Washington
←
→
Page content transcription
If your browser does not render page correctly, please read the page content below

Healthy Beaches for People and Fish:
Protecting shorelines from the impacts of
armoring today and rising seas tomorrow

  Sea Level Rise Vulnerability in
  San Juan County, Washington
  Prepared by: A. J. MacLennan, J. F. Waggoner, J. W. Johannessen,
         and S. A. Williams, Coastal Geologic Services Inc.

               Prepared for: Friends of the San Juans
                           October 2013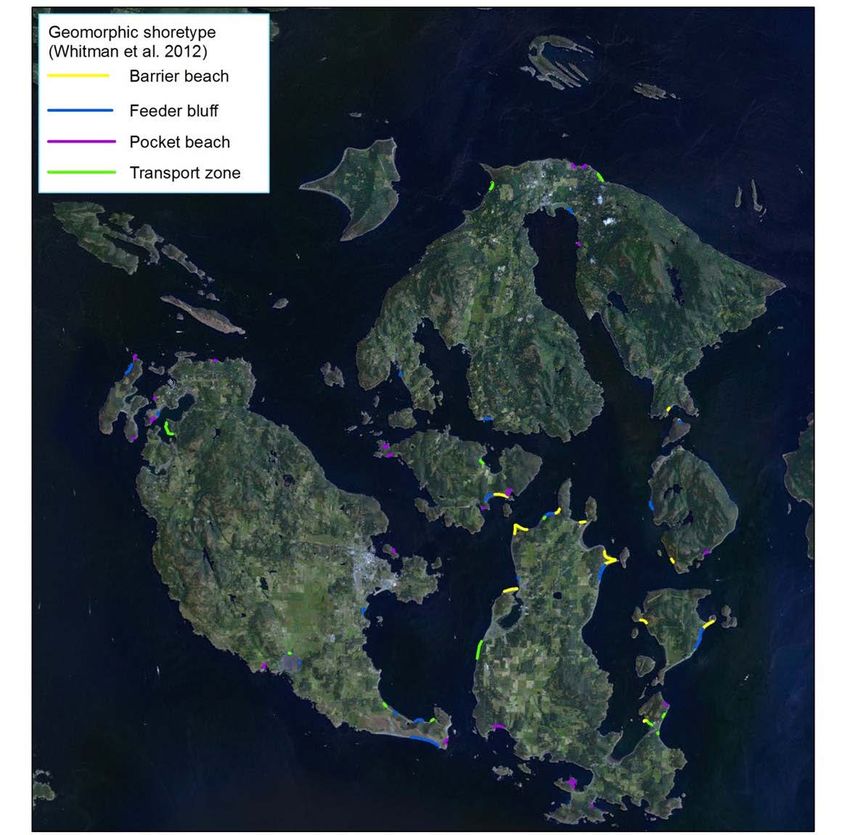
Healthy Beaches for People and Fish

The goal of the Healthy Beaches for People and Fish: Protecting shorelines from the impacts of armoring today
and rising seas tomorrow project is to improve the long-term protection of nearshore marine ecosystems by
developing new technical tools and identifying management strategies that specifically address sea level rise and
the cumulative impacts of shoreline armoring.

The Healthy Beaches for People and Fish project was completed by Friends of the San Juans in partnership with
Coastal Geologic Services, Salish Sea Biological and the Washington Department of Fish and Wildlife in 2014.
Project approach and work was guided by a technical advisory group, which included representatives from The
University of Washington, United States Geological Survey, Puget Sound Partnership, Skagit River Systems
Cooperative, Samish Indian Nation, San Juan County Public Works, San Juan County Salmon Recovery Lead
Entity, The Tulalip Tribes, Padilla Bay National Estuarine Research Reserve and the Washington State
Departments of Ecology, Natural Resources and Fish and Wildlife.

The project contained four distinct areas that informed management recommendations:
    •   A legal review of existing local, state and federal shoreline regulations and their ability to address sea
        level rise and cumulative impacts;
    •   Sea level rise vulnerability assessment for San Juan County;
    •   Forage fish spawning habitat research; and
    •   Surveys of coastal managers, regulators and researchers.

Reports and data products associated with this project can be found online
at www.sanjuans.org/NearshoreStudies.htm and include:

Friends of the San Juans. 2014. Healthy Beaches for People and Fish: Protecting shorelines from the impacts of
armoring today and rising seas tomorrow. Final Report to WDFW and the U.S. EPA. Friday Harbor, Washington.

Loring, K. 2013. Addressing Sea Level Rise and Cumulative Ecological Impacts in San Juan County Washington
Through Improved Implementation and Effective Amendment of Local, State, and Federal Laws. Friends of the
San Juans. Friday Harbor, Washington.

MacLennan, A., J. Waggoner and J. Johannessen. 2013. Sea Level Rise Vulnerability Assessment for San Juan
County, Washington. Prepared by Coastal Geologic Services for Friends of the San Juans.

Whitman, T., D. Penttila, K. Krueger, P. Dionne, K. Pierce, Jr. and T. Quinn. 2014. Tidal elevation of surf smelt
spawn habitat study for San Juan County Washington. Friends of the San Juans, Salish Sea Biological and
Washington Department of Fish and Wildlife.

Whitman, T. and S. Hawkins. 2013. The impacts of shoreline armoring on beach spawning forage fish habitat in
San Juan County, Washington. Friends of the San Juans. Friday Harbor, Washington.

This project has been funded in part by the United States Environmental Protection Agency under assistance
agreement PC 00J29801 to Washington Department of Fish and Wildlife. The contents of this document do not
necessarily reflect the views and policies of the Environmental Protection Agency, nor does mention of trade
names or commercial products constitute endorsement or recommendation for use. Match funding for the
project was provided by the Bullitt Foundation and the North Pacific Landscape Conservation Cooperative. In kind
match provided by FRIENDS of the San Juans, Coastal Geologic Services, Salish Sea Biological and technical
advisory group participants.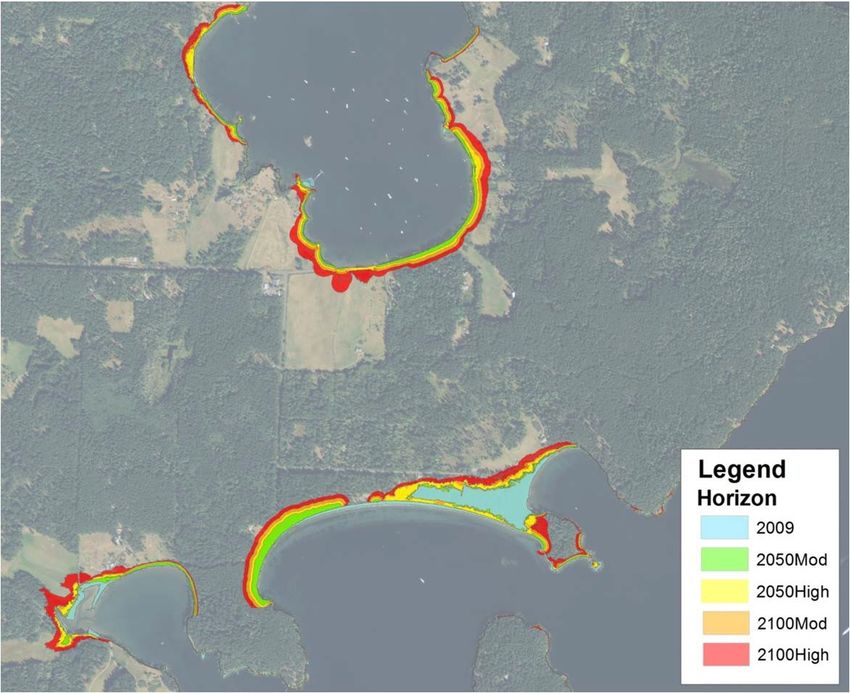
Sea Level Rise Vulnerability in San Juan County
Final Report, Page i                                                                                          COASTAL GEOLOGIC SERVICES, INC.

                                                                Table of Contents
Table of Contents ........................................................................................................................................... i
Table of Tables .............................................................................................................................................. ii
Table of Figures ............................................................................................................................................ iii
Acronyms and Abbreviations ....................................................................................................................... vi
1.0 Introduction ............................................................................................................................................ 1
2.0 Background ............................................................................................................................................. 2
    2.1 Coastal Erosion .................................................................................................................................... 3
    2.2 Coastal Flooding .................................................................................................................................. 4
    2.3 Coastline Response to SLR................................................................................................................... 5
    2.4 SLR in San Juan County ........................................................................................................................ 9
    2.5 Data Availability................................................................................................................................. 10
3.0 Methods ................................................................................................................................................ 11
    3.1 Shore Change Analysis....................................................................................................................... 12
    3.2 DSAS and Statistical Analysis ............................................................................................................. 14
    3.3 Estimating the Future Position of the Shoreline ............................................................................... 15
4.0 Results ................................................................................................................................................... 18
    4.1 Shore Change Analysis....................................................................................................................... 18
    4.2 Transgression Model Outputs ........................................................................................................... 21
    4.3 Vulnerable Infrastructure .................................................................................................................. 25
    4.4 Policy Recommendations .................................................................................................................. 29
    4.5 Data Interpretation and Intended Utility .......................................................................................... 31
5.0 Conclusions ........................................................................................................................................... 38
References .................................................................................................................................................. 39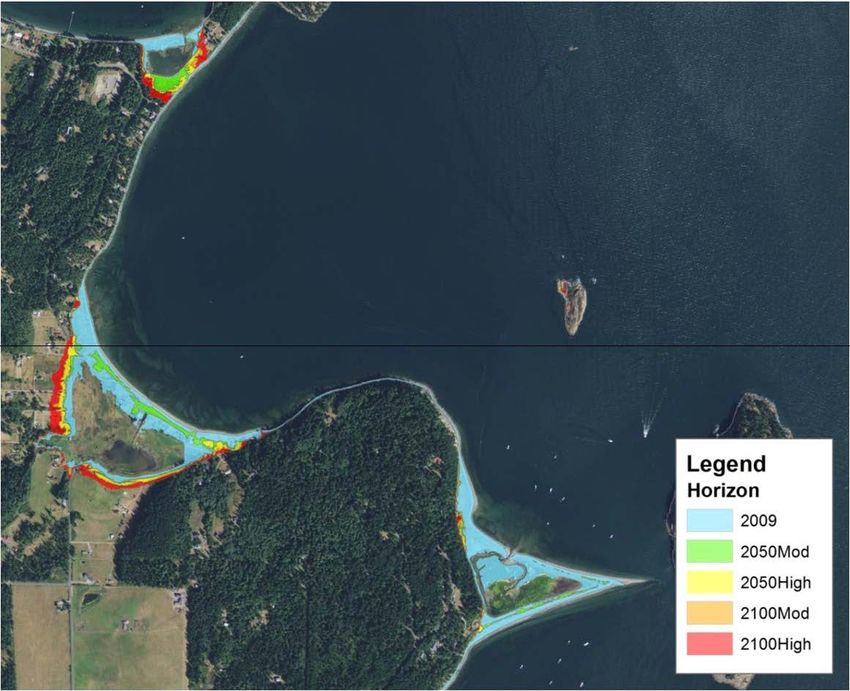
Sea Level Rise Vulnerability in San Juan County
Final Report, Page ii                                                                                        COASTAL GEOLOGIC SERVICES, INC.

                                                                   Table of Tables
Table 1. Members of the TAG and the entities they represent. Tina Whitman of Friends of the San Juans
managed the greater project. ....................................................................................................................... 2
Table 2. Shoretypes description, response to climate change and potential impacts................................. 3
Table 3. Moderate and high sea level rise projections by the National Research Council (NAS 2012).. ... 10
Table 4. Sampling design displaying shoreforms, stratification of shoreforms by exposure and
orientation. ................................................................................................................................................. 13
Table 5. Descriptive statistics for change rates (ft/yr) across geomorphic shoreforms (1960‐2009).
Negative numbers are the lowest rates, if less than zero represents erosion. .......................................... 19
Table 6. Average change rates (ft/yr) of geomorphic shoretypes sorted by exposure category............... 21
Table 7. Decadal iterations of Equation 1 and resulting estimated feeder bluff erosion (ft) based on
increasing SLR rates of various fetch categories and SLR scenarios (NAS 2012). ....................................... 21
Table 8. Final estimated erosion of shoreforms with short and long fetch for different SLR scenarios
(moderate, high) and planning horizons (2050, 2100). .............................................................................. 22
Table 9. Length (in miles) of road vulnerable to inundation or erosion associated with SLR scenarios
(moderate, high) and planning horizons (2050, 2100) in San Juan County. ............................................... 26
Table 10. Number of structures vulnerable to inundation or erosion associated with SLR scenarios
(moderate, high) and planning horizons (2050, 2100) in San Juan County. ............................................... 27
Table 11. Number of structures vulnerable to inundation on SJC Islands associated with SLR scenarios
(moderate, high) and planning horizons (2050, 2100) in San Juan County. ............................................... 28
Table 12. Number of structures vulnerable to erosion on SJC Islands associated with SLR scenarios
(moderate, high) and planning horizons (2050, 2100) in San Juan County. ............................................... 28
Table 12. Variables, data sources, and descriptions of each type of error included in the error analysis. 34
Table 13. Variables, data sources, range of measured error and cumulative error measures. ................. 35
Table 14. Standard deviation of shore change rates across different shoretypes and exposure categories
in San Juan County (1960‐2009). ................................................................................................................ 35
Table 15. Cumulative error margin for each shoretype and exposure category in San Juan County. ....... 35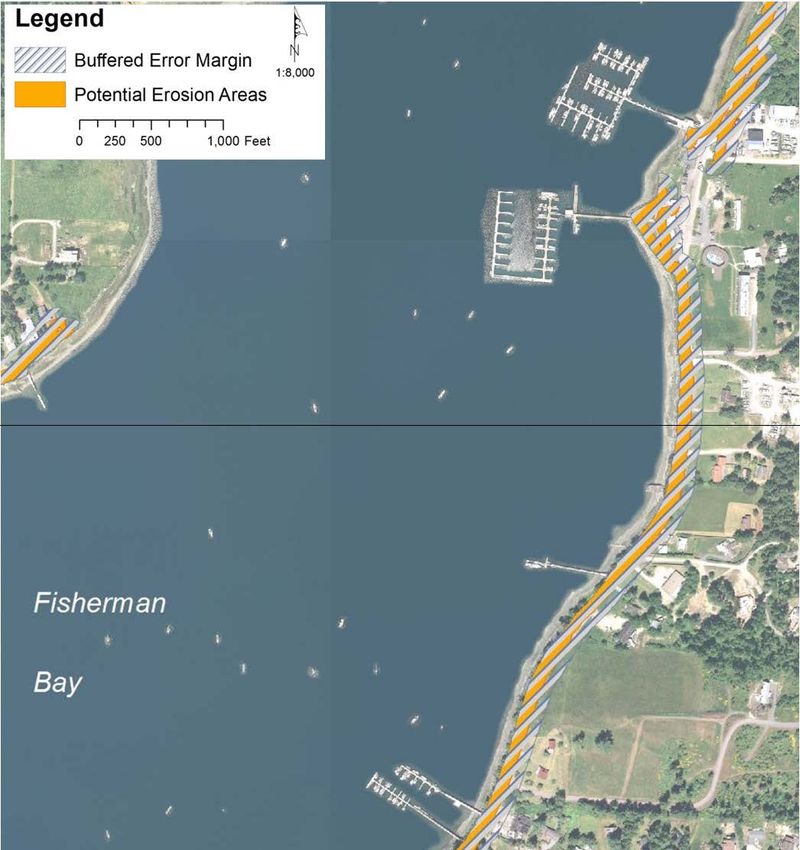
Sea Level Rise Vulnerability in San Juan County
Final Report, Page 3                                                                                      COASTAL GEOLOGIC SERVICES, INC.

                                                                Table of Figures
Figure 1. Active cross‐shore beach profile geometry for derivation of the two‐dimensional Bruun Rule of
beach erosion and Bruun Rule equation. ..................................................................................................... 7
Figure 2. Flow‐chart illustrating interactions of quasi‐three‐dimensional model (all lines) and a two‐
dimensional model ....................................................................................................................................... 8
Figure 3. Sequence of the major tasks of the sea level rise model for San Juan County. .......................... 12
Figure 4. Shoreforms sampled for shore change analysis (from Whitman et al. 2012). ............................ 14
Figure 5. Quadratic spline integration of SLR rates at 10‐year intervals for each scenario using data from
Friday Harbor NOAA tide station and NRC SLR projections (NAS 2012)..................................................... 16
Figure 6. Screen capture of bluff crest digitizing process. .......................................................................... 17
Figure 7. Minimum, maximum and average change rates across shoretypes. Minimum values represent
the lowest change rates, which if less than zero represent erosion. ......................................................... 19
Figure 8. Average change rates within shoretypes of variable fetch and shore orientation. Values less than
zero represent erosion or recession. .................................................................................................. 20
Figure 9. Average change rates of different shoretypes of different fetch categories. ............................. 20
Figure 10. Inundation mapping of northeast Lopez Island. ........................................................................ 23
Figures 11 & 12. Areas vulnerable to erosion and inundation on northwest Lopez Island in 2050, 2100. 24
Figure 13. Areas vulnerable to erosion and inundation on eastern Shaw Island across all scenarios and
planning horizons........................................................................................................................................ 25
Figure 14. Roads vulnerable to erosion or inundation associated with SLR in San Juan County. .............. 26
Figure 15. Building types vulnerable to erosion or inundation. ................................................................. 29
Figure 16. Example of buffered error margins to erosion vulnerability for the moderate SLR scenario in
2050 for Fisherman’s Bay, Lopez Island, as found in project GIS geodatabase to facilitate communicating
uncertainty in outreach efforts................................................................................................................... 36
Figure 17. Example of buffered error margins to erosion vulnerability for the high SLR scenario in 2100 for
Fisherman’s Bay, Lopez Island, as found in project GIS geodatabase to facilitate communicating
uncertainty in outreach efforts................................................................................................................... 37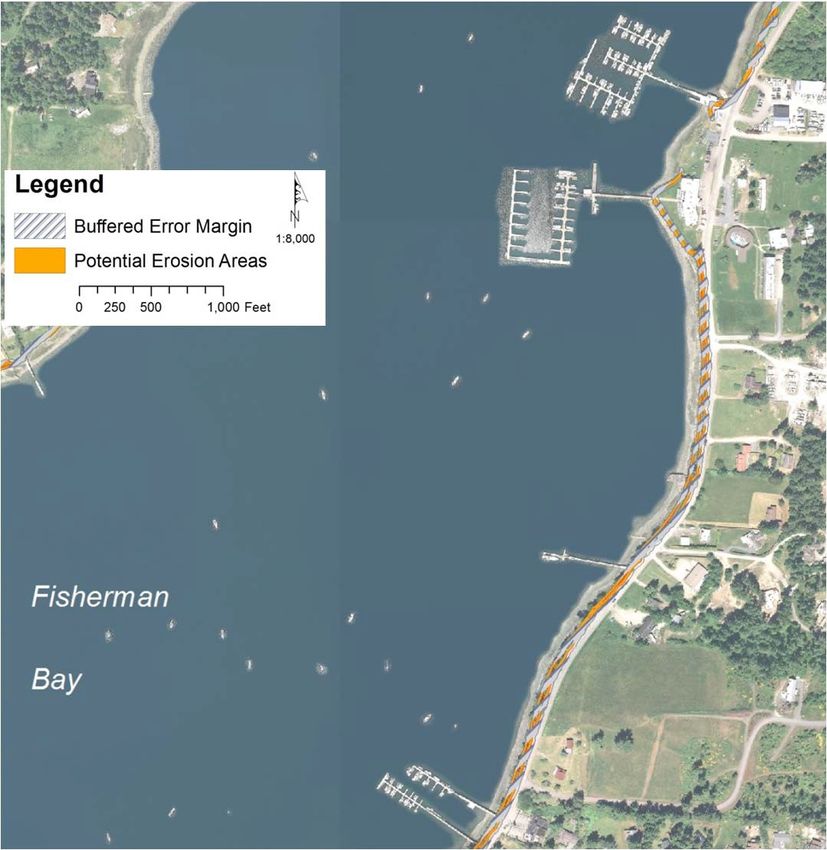
Sea Level Rise Vulnerability in San Juan County
Final Report, Page 4                                                          COASTAL GEOLOGIC SERVICES, INC.

                                                      Glossary
Accretion                    The gradual addition of sediment to a beach or to marsh surface as a result of
                             deposition by flowing water or air. Accretion leads to increases in the elevation
                             of a marsh surface, the seaward building of the coastline, or an increase in the
                             elevation of a beach profile (the opposite of erosion) (Shipman 2008).
Adaptation                   The adjustment of natural or human systems in response to actual or expected
                             phenomena or their effects such that it minimizes harm and/or takes advantage
                             of beneficial opportunities.
Adaptive capacity            A community’s ability to respond to actual or expected phenomena or their
                             effects, including the moderation of potential damages caused by them, taking
                             advantage of opportunities presented by them, and coping with the
                             consequences associated with them.
Anthropogenic                Caused or produced by humans.
Backshore                    The upper zone of a beach beyond the reach of normal waves and tides,
                             landward of the beachface. The backshore is subject to periodic flooding by
                             storms and extreme tides, and is often the site of dunes and back‐barrier
                             wetlands (Clancy et al. 2009).
Barrier beach                A linear ridge of sand or gravel extending above high tide, built by wave action
                             and sediment deposition seaward of the original coastline. Includes a variety of
                             depositional coastal landforms, including spits, tombolos, cuspate forelands, and
                             barrier islands (Shipman 2008).
Beach                        The gently sloping zone of unconsolidated sediment along the shoreline that is
                             moved by waves, wind, and tidal currents (Shipman 2008).
Bluff                        A steep bank or slope rising from the shoreline, generally formed by erosion of
                             poorly consolidated material such as glacial or fluvial sediments (Shipman 2008).
Conceptual model             A model, either numerical or diagrammatic, that summarizes and describes the
                             relationships and interactions between specified model components.
Drift cell                   A littoral [drift] cell is a coastal compartment that contains a complete cycle of
                             sedimentation including sources, transport paths, and sinks. The cell boundaries
                             delineate the geographical area within which the budget of sediment is
                             balanced, providing the framework for the quantitative analysis of coastal
                             erosion and accretion. See Johannessen and MacLennan (2007) for further
                             description of drift cells.
Embayment                    An indentation of the shoreline larger in size than a cove but smaller than a gulf.
Equilibrium profile          A “statistical average beach profile’ which maintains its form apart from
                             fluctuations including seasonal effects at a particular water level.

Erosion                      The wearing away of land by the action of natural forces. On a beach, the
                             carrying away of beach material by wave action, tidal currents, littoral currents,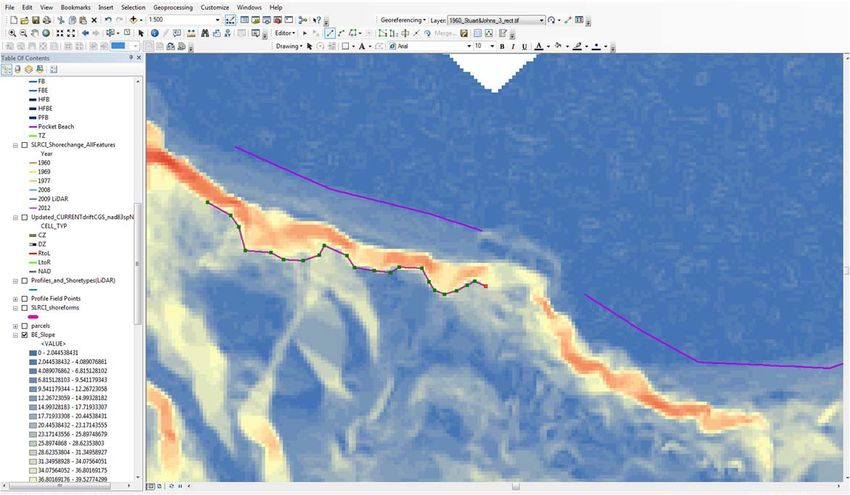
Sea Level Rise Vulnerability in San Juan County
Final Report, Page 5                                                           COASTAL GEOLOGIC SERVICES, INC.

                             or deflation (wind action) (opposite of accretion) (Shipman 2008).
Habitat                      The physical, biological, and chemical characteristics of a specific unit of the
                             environment occupied by a specific plant or animal. Habitat is unique to specific
                             organisms and provides all the physical, chemical and biological requirements of
                             that organism within a specific location (Fresh et al. 2004).
Longshore transport          Transport of sediment parallel to the shoreline by waves and currents (Shipman
                             2008).
Morphology                   The shape or form of the land surface or of the seabed and the study of its
                             change over time (Clancy et al. 2009).
Progradation                 Occurs on a shoreline that is being built forward or outward into a sea or lake by
                             deposition and accumulation as in a delta.
Protection                   Safeguarding ecosystems or ecosystem components from harm caused by
                             human actions.
Resilience                   The ability of an entity or system to absorb some amount of change, including
                             extreme events, and recover from or adjust easily to the change or other stress.
Risk                         A combination of the magnitude of the potential consequence(s) of climate
                             change impact(s) and the probability or likelihood that the consequences will
                             occur. The magnitude of the potential consequence(s) is the result of the climate
                             change impact(s) and the system’s vulnerability to the changes.
Sediment transport           Bedload and suspended transport of sediments and other matter by water and
                             wind along (longshore) and across (cross‐shore) the shoreline. The continuity of
                             sediment transport strongly influences the longshore structure of beaches.
Sediment Input               Delivery of sediment from bluff, stream, and marine sources into the nearshore.
                             Depending on landscape setting, inputs can vary in scale from acute, low‐
                             frequency episodes (hillslope mass wasting from bluffs) to chronic, high‐
                             frequency events (some streams and rivers). Sediment input interacts with
                             sediment transport to control the structure of beaches.
Shoreform                    A term often used in Puget Sound to describe a coastal landform. The term is
                             generally used to describe landscape features on the scale of hundreds to
                             thousands of meters, such as coastal bluffs, estuaries, barrier beaches, or river
                             deltas.
Vulnerability                The degree to which a system is susceptible to, or unable to cope with, adverse
                             effects of climate change, including climate variability and extremes.
                             Vulnerability is a function of the character, magnitude, and rate of climate
                             variation to which a system is exposed, its sensitivity, and its adaptive capacity.
Vulnerability                Risk‐based evaluation of the likely sensitivity and response capacity of natural
assessment                   and human systems to the effects of expected phenomena..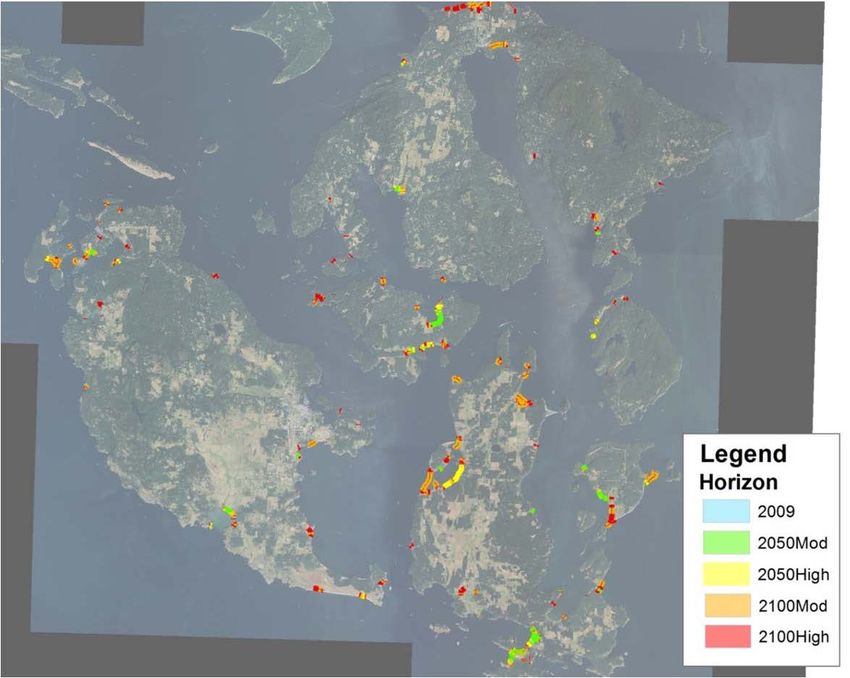
Sea Level Rise Vulnerability in San Juan County
Final Report, Page 6                                                       COASTAL GEOLOGIC SERVICES, INC.

                                           Acronyms and Abbreviations
BAB                           barrier beach
CC                            climate change
CGS                           Coastal Geologic Services
DEM                           digital elevation model
DOE                           Washington Department of Ecology
FOSJ                          Friends of the San Juans
GIS                           geographic information systems
HOWL                          highest observed water level
IPCC                          intergovernmental panel on climate change
LWD                          large woody debris
MHHW                         mean higher high water
MHW                          mean high water
MLLW                          mean lower low water
NA                            not applicable
NAD                           no appreciable drift
NRC                           National Research Council
PB                            pocket beach
PSNERP                        Puget Sound Nearshore Ecosystem Restoration Project
SCAPE                         soft cliff and platform erosion
SMP                           Shoreline Master Program
SLR                           sea level rise
SJC                          San Juan County
TAG                          technical advisory group
USGS                          United States Geological Survey
VLM                           vertical land movement
WDFW                          Washington Department of Fish and Wildlife
WDNR                          Washington Department of Natural Resources (also noted as DNR)
USFWS                         United States Fish and Wildlife Service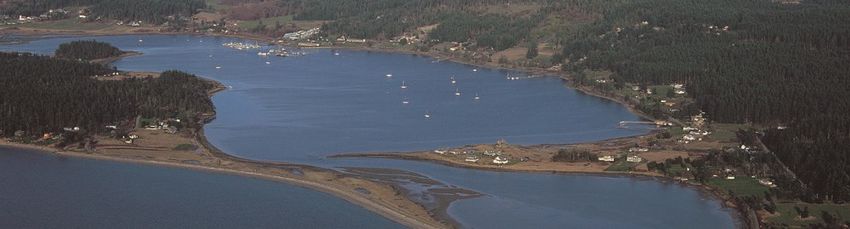
Sea Level Rise Vulnerability in San Juan County
Draft Report, Page 1                                                    COASTAL GEOLOGIC SERVICES, INC.

                                                  1.0 Introduction
Coastal areas are among the most heavily populated areas in the world. Shoreline development and
population growth are expected to continue into the future. Regional projections of population growth
in the Puget Sound region have estimated close to half a million more people will move to the region by
2030. Similar to regional projections, population growth projections for San Juan County predict that
several tens of thousands of people will move to the area in the coming decades.
Waterfront property, whether along high bluffs or on low sandy spits, constitutes the highest value real
estate in the region. Recent research has reported that millions of Americans live on land below
approximately 3 feet (1 meter) above high tide. No similar research has been conducted in the Salish Sea
region that aims to clearly outline areas of heightened vulnerability to implications of climate change,
despite the population density across thousands of miles of shoreline. Beaches and bluffs in the Salish Sea
are not only valued waterfront real estate but also provide critical habitat functions such as beach
sediment supply for wildlife and fish including ESA listed salmon populations, spawning areas for species
central to the marine food web, and shellfish harvesting. Additional human values associated with
nearshore areas include recreation, aesthetic, and spiritual values.
The objective of this study is to attain greater understanding of the areas within San Juan County that
are vulnerable to implications of sea level rise with the goal of providing better tools to resource
managers and planners in this coastal county. San Juan County has more shoreline than any other
county in the contiguous United States of America, and is comprised of almost all major coastal
landform types (shoretypes) found in the region (excluding large delta systems). The range of
shoretypes found in the county provides an opportunity to explore the variable climate change impacts
across different landforms and how different areas may require different management approaches.
Management strategies and planning recommendations will be proposed based on results in the
forthcoming stages of this project to reduce, avert and mitigate vulnerability associated with sea level
rise. Together these tools can form the foundation of a SLR adaptation strategy for San Juan County and
increase the effectiveness of existing management approaches. In addition, these results can be used to
identify additional long‐term restoration and conservation targets throughout the County.
Several technical elements of this project were developed in collaboration with the technical advisory
group (TAG) for the project. The project TAG provided much needed guidance and input on critical
decisions that formed the foundation for the technical approach that was developed. TAG members are
listed in Table 1.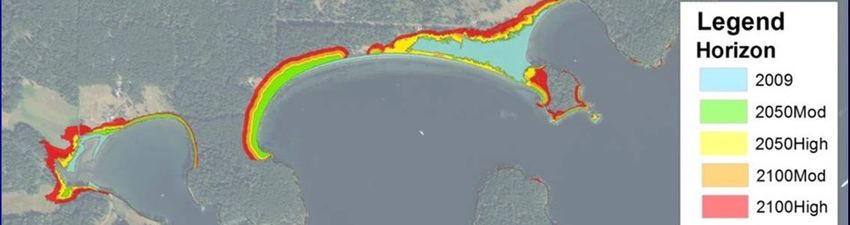
Sea Level Rise Vulnerability in San Juan County
Final Report, Page 2                                                              COASTAL GEOLOGIC SERVICES, INC.

Table 1. Members of the TAG and the entities they represent. Tina Whitman of Friends of the San Juans managed
the greater project.

 Last Name                First Name              Entity

 Shipman                  Hugh                    Shoreline Geologist, WA State Department of Ecology

 Grossman                 Eric                    Geologist, USGS

 Williams                 Terry                   Tulalip Tribes

 Mumford                  Tom                     Marine Biologist, DNR

 Dethier                  Megan                   University of Washington Friday Harbor Labs

 Lowry                    Dayv                    WDFW

 Wenger                   Barry                   Shoreline Policy and Planning

 Walsh                    Stan                    Skagit River System Co-op

 Hardison                 Prescott                Tulalip Tribes

 Shull                    Suzanne                 Padilla Bay National Estuarine Research Reserve

 Rawson                   Kit                     Tulalip Tribes

 Rosenkotter              Barbara                 WRIA 2 Salmon Recovery

 Vekved                   Dan                     San Juan County Public Works Engineer

                                                  2.0 Background
Sea level rise will produce a range of impacts from increased erosion of coastal bluffs, the inundation of
low lying coastal areas, and the landward translation of beach profiles, among other impacts (Huppert et
al. 2009). San Juan County is comprised of a wide variety of shoretypes (also referred to as shoreforms)
which will respond to the rise in sea level in different ways. Certain shoretypes are likely to be more
vulnerable to erosion, others to inundation, and some will be vulnerable to both. Certain shoretypes, such
as plunging bedrock shores, are unlikely to incur considerable impacts outside of a vertical rise in the
mean high water mark. Table 2 displays the projected risk by shoretype for the shoretypes that
occur in San Juan County (adapted from Shipman 2009).
Sea Level Rise Vulnerability in San Juan County
Final Report, Page 3 COASTAL GEOLOGIC SERVICES, INC.
Table 2. Shoretypes description, response to climate change and potential impacts.
Shoretype Description Geomorphic Response Potential Impact
Bedrock, resistant to Limited geomorphic Low vulnerability, shifts in
Rocky
erosion response ecological zonation
Increased erosion, mass Landslides and erosion,
Feeder bluff Steep, erodible slopes wasting, accelerated bluff modified habitats, increased
retreat sediment delivery to beaches
Erosion, flooding, storm
Low lying spits and
Erosion, overwash, barrier damage, altered backshore
barrier beaches, often
Barrier beach migration, breaching, habitats, possible
with back-barrier
shifting tidal inlets encroachment on back barrier
wetlands, dunes
wetlands
Sheltered estuaries and Marsh/habitat loss, channel
Marsh erosion/accretion,
lagoons, salt marshes, erosion, shoreline erosion,
Estuaries & lagoons changes in tidal prism,
often found landward of sedimentation, changes to
altered inlet dynamics
barrier beaches wetland configuration
Marsh erosion/accretion, Increased flood vulnerability,
Broad, low elevation
sedimentation changes, damage to dikes and levees,
Deltas alluvial features at river
altered riverine influence, marsh loss, vegetation shifts,
mouths
inundation, salinity intrusion decreased drainage
Areas of extensive
landfill, usually low Limited geomorphic
Artificial Storm damage, flooding
elevation, engineered response.
and hardened.
2.1 Coastal Erosion
Coastal erosion is anticipated to increase in association with SLR and CC as a result of increased storm
frequency and intensity, increased precipitation, increased wave heights, and high water events (storm
surges, National Academy of Sciences 2012). Variables such as substrate (geology), slope, fetch, and
shore orientation are likely to increase the vulnerability to erosion of certain shoreforms over others
(Huppert et al. 2009, Shipman 2009). For example, bluffs comprised of outwash sands are likely to recede
more rapidly than those comprised of more consolidated glacial till. Similarly, shores that are orientated
to the south directly face the predominant and prevailing wind and wave approach in the region,
resulting in greater vulnerability to increased wave heights and storm frequency, which are each
additional implications of climate change. Shores with greater fetch are also more vulnerable to storm
events, with more exposure to increased wave heights and high water events that exacerbate marine‐
induced erosion. Increased precipitation, another local implication of climate change (Mote et al. 2008),
will result in the added probability of landslides along coastal bluffs, which are known to have a
precipitation threshold (Chleborad et al. 2006).Sea Level Rise Vulnerability in San Juan County Final Report, Page 4 COASTAL GEOLOGIC SERVICES, INC. Coastal erosion is a natural process that occurs along coastlines throughout the world. Each coastal landform type exhibits different forms and rates of erosion based on local drivers, such as beach and upland substrate composition and geology. Coastal bluffs and cliffs are typically classified as erosional landform types where erosion is driven primarily by sea level rise, large storms, and wave energy. Bluffs typically recede through a combination of (bluff) toe erosion and subsequent mass wasting (commonly referred to as landslides). The effect of surface water and groundwater often exacerbates (Gerstel et al. 1997) bluff instability and triggers landslides. The rate at which a bluff retreats is dependent on several interacting variables (Shipman 2004). First order factors include climate and sea level rise. Second order drivers of erosion are more site‐specific and are commonly categorized as marine, subaerial or human induced erosion. Each driver of erosion may occur independently or simultaneously upon the bluff throughout time (Johannessen and MacLennan 2007). Marine‐induced erosion is the dominant type of erosion along coastal bluffs, which works in combination with bluff geology to shape the overall bluff profile. Bluff recession results in the landward migration of the shoreline which commonly results in structures becoming closer in proximity to the bluff crest and shoreline, often putting them at greater risk than either owners or insurers recognize. The Heinz Center (2000) estimated that over the next 60 years, erosion may claim one out of four houses within 500 feet of the shoreline. To the homeowners living within this narrow strip, the risk posed by erosion is comparable to the risk from flooding along low lying shores. Coastal bluff retreat tends to be episodic, with much of the long‐term bluff failure taking place during a few severe storm events that occur every 15‐40 years (Johannessen and MacLennan 2007). The arrival of storm waves concurrent with higher high tides, along with elevated water level due to low atmospheric pressure associated with storm fronts is a common cause of bluff toe erosion. However, it is often major precipitation events which trigger or cause mass wasting events (Tubbs 1974). The combination of these conditions commonly occurs during major El Nino events and over extended periods (months) can result in dramatic coastal erosion throughout the region (Chleborad et al. 2006, Johannessen and MacLennan 2007, Russell and Griggs 2013). The frequency of El Nino events are likely to increase as an additional implication of climate change. Although long‐term bluff retreat rates are low for most San Juan County shores, the episodic nature of bluff retreat can lead to considerable instantaneous recession, followed by little change for several decades. Therefore short‐term recession rates should be viewed with caution and are often a source of fear to new owners of coastal bluff properties. Little data is available on the variable retreat rates of bluffs throughout the Salish Sea and San Juan County. 2.2 Coastal Flooding As sea levels rise, the lowest lying areas will be regularly flooded by high tides. This gradual process of sea level rise exhibits considerable spatial variability due the combined effects of global (eustatic) sea level rise and vertical land movement (isostatic uplift or subsidence), the net effect of which is referred to as relative sea level rise. Relative sea level rise in Washington is variable due to spatial variability in vertical land movement throughout the state. Western Washington sits on the western edge of the North American continental plate which is converging with the (subducting) Juan de Fuca oceanic plate. This subduction zone, commonly referred to as the Cascadia subduction zone, generates many of the region’s largest
Sea Level Rise Vulnerability in San Juan County
Final Report, Page 5                                                       COASTAL GEOLOGIC SERVICES, INC.

earthquakes and far more subtle, locally variable vertical land movement. The northwestern Olympic
Peninsula is gradually uplifting, while south Puget Sound gradually subsides. San Juan County is located
at the hinge point between these two contrasts resulting in minimal vertical land movement. Therefore
local relative sea level rise rates in San Juan County are anticipated to be in line with global (eustatic) sea
level rise rates.
Water levels in San Juan County are variable at time scales ranging from daily tides (spring tide range of
approximately 12 ft) to decadal cycles (El Nino – Southern Oscillation, Shipman 2009). Elevated mean
sea level occurs several times a year, but is consistently much higher during El Nino events (on the order
of 0.5 – 1 ft or more). Shipman reports that a one foot rise in water level leads to an increase in the
number of high water events at a given elevation by roughly an order of magnitude, turning a 10‐year
event into an annual event, or a 100‐year event into a 10‐year event.
Inundation of low lying coastal areas is likely to occur episodically in association with storms that
coincide with high water events (storm surges). These will be determined by factors largely unrelated to
climate change – for example, the joint probability of large wave‐producing wind storms and unusually
high astronomic tides (Shipman 2009). Events such as this would result in overtopping of spits and
barriers by wave run‐up, the increased likelihood of breaches or formation of new tide channels and
barriers, the erosion of high marsh by wave action, and the inundation of low lying areas (Shipman
2009). Changes in the seasonal pattern of rainfall or increased peak run‐off from snow melt could
exacerbate flooding near rivers and streams (Huppert et al. 2009).
An increase in maximum wave heights has been documented along the coast of Washington and Oregon
(Ruggerio and Allen 2010). It is unlikely that this trend will result in a change in wave regime within the
more protected shores of San Juan County. The west shore of San Juan Island and the south shore of
Lopez Island are the only areas in which ocean swell persists and where increased wave height associated
with climate change is likely to occur.

2.3 Coastline Response to SLR
Coastal response to SLR has been a complex and intriguing area of research in the field of coastal
geomorphology since the 1960s. More recently, the widespread acceptance of the acceleration of sea
level rise and anthropogenic climate change by scientists has led to concern worldwide. Planners and
managers in coastal countries are developing a wide range of approaches to address these issues.
Leatherman (1990) and Cooper and Pilkey (2007) stressed that understanding shoreline response to sea
level rise is essential to inform policy makers, the coastal management community, and stakeholders
(Defeo et al. 2009). The following section is comprised of a brief review of different approaches that have
been used to understand how shorelines will respond to sea level rise and an analysis of which
approach(es) would be appropriate for application or could inform the tools developed as part of this
effort.
Several different approaches ranging from models to indices have been developed and applied at a
range of scales to assess the vulnerability and response of different shores to sea level rise. Because
coastal systems operate on a range of scales in space and time, understanding coastal response to SLR
clearly requires an appropriate scale of investigation. The spatial scale of the most commonly applied
models range from countywide assessments of variable resolution, to high‐resolution site‐specific
modeling. The level of detail applied in each study is typically a function of data availability and the
Sea Level Rise Vulnerability in San Juan County
Final Report, Page 6                                                      COASTAL GEOLOGIC SERVICES, INC.

purpose of the study. Most models incorporate some measure of background (historic) retreat rates,
topography (LiDAR), and regional SLR projections. Higher resolution models might also include
shoretype (shoreline classification), geology (bluff lithology), wave data, bathymetry, and rate of sea
level rise. Although site‐specific, high resolution models are not appropriate for use in this study due to
the county‐wide scale and data limitations, however the fundamental principles and relationships
driving the models can shed light on the most relevant variables to incorporate into this study.
The Bruun Rule (Bruun 1962, Schwartz 1967) has long been used to predict the effects of sea level rise on
coastal recession. Based on conservation of mass principles, the Bruun model is used to predict the
horizontal translation of the shoreline associated with a given rise in sea level. It provides a plausible
process through which sea level rise may drive beach erosion. Its application has been the subject of
considerable debate as it has several limitations and fundamental assumptions. The Bruun Rule assumes
that the observed shoreline recession is controlled primarily by SLR and is not subsumed by other
factors such as reduced sediment supply (Cooper and Pilkey 2007, Davidson‐Arnott 2005). The Bruun
Rule has been adapted by several researchers (Figure 1) to better predict SLR and account for additional
variables or limitations in the assumptions (Dean 1990, Davidson‐Arnott 2005, Leatherman, Zhang and
Douglas 2000, Zhang, Douglas and Leatherman 2004, Stive 2004, Esteves et al. 2009, and Lymbery, Wisse,
and Newton 2007) and generally includes the following assumptions:
     •   a two dimensional, equilibrium profile
     •   sandy substrate
     •   height and limit of the onshore boundary (of the beach profile) should not include any
         significant change or increase in the elevation
     •   does not account for cross‐shore or alongshore sediment transport
     •   shoreline recession is controlled primarily by SLR and is not subsumed by other factors such as
         reduced sediment supply (Cooper and Pilkey 2007 and Davidson‐Arnott 2005)

An adapted Bruun model (Nicholls 1998) was recently applied to several pocket beaches along the west
shore of San Juan Island (Grilliot 2009). The SLR projections used in this application were from the IPCC’s
Fourth Assessment Report and are now considered to be outdated as they under‐estimate future SLR.
Results showed only the high sea level rise scenario will result in large transgression and erosion of the
backshore. Data limitations, resource constraints, and the model’s assumptions preclude appropriate
application of the Bruun Rule throughout San Juan County.
Sea Level Rise Vulnerability in San Juan County Final Report, Page 7 COASTAL GEOLOGIC SERVICES, INC. Figure 1. Active cross‐shore beach profile geometry for derivation of the two‐dimensional Bruun Rule of beach erosion and Bruun Rule equation. DB is the elevation of the shore above sea level, DC is the depth of closure, a is the rise of sea level, and l is the distance from the shore to the ‘closure point’ (Schwartz 1967). Many studies have projected beach response to sea level rise by integrating historic trends derived from air photo analysis with SLR projections. One approach developed by Leatherman (1990) and recently (built upon and) applied to the coast of California (Revell et al. 2011) links shoreline response with historic trends and local sea level change during a specified time period (e.g. through 2100). Historic trends were integrated into Revell et al.’s work from Hapke and Reid (2007) and other rigorous studies of erosion along the coast of California. Change rates were classified by shoreline type, wave exposure and other variables (e.g. bluff lithology). Additionally, a general hypothesis based on the relationship between SLR and shoreline recession is proposed and applied as a multiplier; therefore this model accounts for inherent variability in shoreline response based on differing coastal processes, sedimentary environments and exposure (Leatherman 1990). For some cases shoreline change rates were multiplied by the ratio between the historic and projected SLR rates. Another commonly applied approach is the Coastal Vulnerability Index (CVI). This index incorporates six variables into the Index score, which rates the relative vulnerability of a reach of shore to SLR. The variables include geomorphic shoretype, coastal slope, relative SLR rate, erosion or accretion rate, mean tidal range, and mean wave height. This model has been applied at a very coarse resolution to much of the coast of the United States by the US Geologic Survey (Hammar‐Klose and Thieler 2001). The rates of shore change were based on dated, low resolution data sets. The study area did not include most of the
Sea Level Rise Vulnerability in San Juan County
Final Report, Page 8                                                           COASTAL GEOLOGIC SERVICES, INC.

shores of the Salish Sea and appeared to stop west of Dungeness Spit in the Strait of Juan de Fuca,
thereby excluding San Juan County.
Sea level rise inundation models are commonly applied using the “bathtub model” or “single‐value
surface model”, whereby digital elevation data (typically LiDAR data) and tidal surfaces are used to
create future shorelines representing different SLR projections. This type of mapping has only two
variables, the inundation level and the ground elevation. Upland slope is the controlling variable. This
method is preferred for immobile substrates such as rocky or armored shorelines, especially along
sheltered coasts with very low wave energy (Leatherman 1990). This method has been applied as part of
several efforts to understand SLR implications in the Salish Sea including MacLennan et al. (2010), Glick
et al. (2007), Peterson (2007), and City of Seattle Public Works (2012), among others.
Recently a geomorphologic model, SCAPE (Soft‐Cliff and Platform Erosion), was developed, which
provides mesoscale outputs for informed coastal management (Figure 2, Walkden and Hall 2005,
Dickson et al. 2007, and Walkden and Hall 2011). This processed‐based numerical model incorporates
feedback mechanisms (such as colluvium buffering wave attack or decreasing slope resulting in less
recession), which enables dynamic equilibrium forms to emerge and brings model stability (Dickson et al.
2007). Similarly, positive feedback also exists such as where the beach profile is excessively steep,
positive feedback drives change toward more gentle slopes again (Walkden and Hall 2011). The model is
designed for beaches with a low volume of sediment; on the order of 30 m3/m or less, which is generally
the case for San Juan County shores.

Figure 2. Flow‐chart illustrating interactions of quasi‐three‐dimensional model (all lines) and a two‐dimensional
model (solid lines only, Walkden and Hall 2011).
Analyses of SCAPE model results have documented a strong relationship between the rates of bluff
retreat and SLR. SCAPE model outputs differ from those of the Bruun model, which proposes an
equilibrium profile that is migrated upward and landward, maintaining its shape relative to still water.
Sea Level Rise Vulnerability in San Juan County
Final Report, Page 9                                                     COASTAL GEOLOGIC SERVICES, INC.

The SCAPE model outputs result in new equilibrium profiles that become increasingly steep under higher
rates of SLR. Increased beach slope can be explained by the zone of wave attack moving landward faster
than the beach can equilibrate under drastically accelerated SLR (Ashton et al. 2011, Walkden and Hall
2011). Where a bluff is present lesser areas of the beach are available to be flattened by wave action,
resulting in profile steepening (Ashton et al. 2011). These results are not contradictory, but show the
assumption of an unchanging equilibrium form under drastically accelerated SLR may be unrealistic for
bluffs that are resistant enough to erosion and mass wasting that recession cannot keep pace with rapid
SLR (Walkden and Hall 2011). However, the bluffs are locally less resistant to erosion then those of most
European and other areas researched. The geology of the majority of the lower bluffs in San Juan
County would likely not hinder profile adjustment; however there is little data on this topic.
In contrast to the Bruun model, the SCAPE model predicts that in the absence of SLR the bluff will recede
at a lower velocity while the Bruun model suggests that no coastal recession will occur. The SCAPE model
assumes that time required for the beach profile to reach equilibrium is associated with the rate of sea
level rise. Although that time required for the new equilibrium profile to form may also be dependent on
storm frequency and time lags in shore response are likely to occur (Walkden and Hall
2011, Ashton et al. 2011, Brunsden 2001). Comparison of SCAPE predictions with those made using the
modified Bruun Rule show that SCAPE predicts a complex suite of responses and lower overall sensitivity
of soft‐rock shores to SLR (Dickson et al. 2007).
The Scientific Committee on Ocean Research (SCOR ) Working Group 89 (1991) recommended a number
of guidelines for use when employing coastline response models. SCOR (1991) suggested an application
of an order‐of‐magnitude assessment to the model output; meaning that results of the model are not
absolute. As with any predictive model, error associated with each variable incorporated into the model
calculations can be compounded or magnified in the final outputs.

2.4 SLR in San Juan County
Data
A number of oceanographic and meteorlogical processes can elevate regional sea level leading to high
water events and coastal flooding. El Ninos, low atmospheric pressure, and storm surge caused by strong
wave forcing in enclosed areas can all elevate sea levels above the standard tidal range for hours to
months. Recorded water level data shows eight extreme high water events that exceeded the 10%
annual exceedance probability levels at the Friday Harbor NOAA tide station (station 9449880,
benchmark sheet published 2003). Storm and high water events are likely to result in the greatest
flooding and inundation hazards to coastal communities, rather than the more gradual long term rise in
sea level (Russell and Griggs 2013). Mean higher high water (MHHW) at Friday Harbor is +7.76 ft MLLW.
The highest observed water level at Friday Harbor was measured at 3.4 ft above MHHW or + 11.1 ft
MLLW. However, this is a still water level and does not account for wave run‐up.
A recent guidance document for assessing SLR vulnerability recommended assessing regional sea level
trends from the closest tide gauge. The Friday Harbor station, run by NOAA records, indicates a relative
rise in sea level of 1.13 mm/yr with a 95% confidence interval of +/‐ 0.33 mm/yr between 1937 and 2006.
This is equivalent to a change of 0.37 ft in 100 years. This is only slightly lower than global SLR trends as
tide gauge measures have documented a 1.7 mm/yr (+/‐ 0.5) rise in sea level. These data contrast more
recent SLR measures from satellite altimetry since 1993, which shows an increased rise to 3.1 mm/yr.
Sea Level Rise Vulnerability in San Juan County
Final Report, Page 10                                                         COASTAL GEOLOGIC SERVICES, INC.

SLR Projections
A recent review of regional sea level rise projections was reported by the National Research Council for
the coasts of California, Oregon, and Washington (National Academy of Science 2012). Standard
projections and ranges were reported to capture the range of model outputs from multiple emissions
scenarios across three planning horizons; 2030, 2050, and 2100.
The NRC projections are generally rooted in IPCC projections based on multiple numerical models forced
by different emission scenarios, as well as simple climate models. IPCC data was augmented, updated and
applied to the Pacific Coast the by the NRC and included the following refinements:
     •   local steric and wind‐driven contributions to SLR were estimated using general circulation
         models,
     •   the land ice contribution was adjusted for gravitational and deformational effects and
         extrapolated,
     •   sea level finger printing, and
     •   contributions from VLM data (at the state scale) estimated.
The Technical Advisory Group (TAG) supporting this study recommended early in the research design
process that two sea level rise scenarios be applied in this study: a moderate and a high projection. The
TAG also recommended that the SLR projections be applied for two planning horizons (2050 and 2100).
The NRC scenarios were specifically created for Seattle, Washington, but did not include vertical land
movement data specific to Seattle (per Mote et al. 2008) that would preclude appropriate translation for
San Juan County (without VLM data the Seattle SLR projections work well for San Juan County). The
moderate projection reported represents the IPCC A1B scenario, and were adapted to the Pacific Coast
from gridded data by Pardaens et al. (2010). The high projections used the averaged values for the A1FI
model outputs. All NRC‐ regional SLR projections were originally reported in cm relative to year 2000,
but have been translated to feet for use in this study. Table 3 shows these values. Unmitigated CO2
emissions may generate greater warming than what has been estimated. Since 2000 the growth rate of
actual CO2 emissions has tracked the most pessimistic (i.e. the fastest growth rate for CO2 emissions or
the High SLR scenarios) of the IPCC scenarios (Pew Center on Global Climate Change 2009).

Table 3. Moderate and high sea level rise projections by the National Research Council (NAS 2012). Moderate
scenario = mean SLR for the Pacific Coast from Pardaens et al. (2010) for the A1B scenario. High scenario = upper
extent of the means for B1 and A1FI.

 SLR Projections                                    Year 2050                              Year 2100

 Moderate (IPCC A1B) Scenario                         0.54 ft1                               2.03 ft

 High (IPCC A1FI) Scenario                            1.57 ft                                4.69 ft

2.5 Data Availability
Although considerable data is available for San Juan County, data sets relevant to this specific
application are somewhat limited. Valuable data sets for this application include: geomorphic
shoretypes, shore orientation, previously georeferenced historic air photos (from MacLennan et al.
2010), San Juan County structures and roads (vector data), and recent (2009) LiDAR data. High quality
mapping of geomorphic shoreforms that integrates data from several local and regional mapping efforts
(Whitman et al. 2012) is a valuable data set for this utility. Georeferenced vertical aerial photography
Sea Level Rise Vulnerability in San Juan County
Final Report, Page 11 COASTAL GEOLOGIC SERVICES, INC.
covers a large portion of the county at scales ranging from 1:6,000‐1:12,000. Structure and road vector
data created by San Juan County Public Works Department can be used to identify threatened
infrastructure. LiDAR data is available for much of the county from 2009.
Several data limitations exist that precluded the application of a more detailed transgression model.
These data shortages include: wave data, higher resolution geologic mapping, complete LiDAR coverage
flown at a low tidal height, and bathymetric data. There is a general absence of wave data for much of
the Puget Sound/Salish Sea region. Wave data could help develop a model that would account for wave
run‐up, although some might argue that run‐up is not a major driver of beach morphology in the fetch‐
limited environment of San Juan County. A fetch model was created for this project, and the outputs
were linked with shoreform mapping. Geology mapping for San Juan County is coarse (1:100,000) and
only represents surface geology. Surface geology is typically not consistent with the geology of the base
of the bluff or overall bluff stratigraphy, both of which are relevant to bluff recession rates. Higher
resolution geology data could also aid in the identification of pocket beaches (and other shoretypes) that
may be naturally limited in their ability to transgress due to bedrock exposures. The current LiDAR
data set does not include the northernmost portion of the County, and omits Stuart, Johns, and Waldron
Islands. In addition, it was flown at a tidal height that precluded slope measures across approximately half
of the county shores. Bathymetric mapping (multibeam sonar) in combination with wave data,
would be an optimal data set for helping to fully understand the variable wave environments of San
Juan County, as well as understanding how beaches will translate.
3.0 Methods
The SLR model for SJC entailed six major steps each of which entailed detailed analysis, and applied
concepts and calculations from best available science documents, most of which was applied in GIS. The
six steps listed below and shown in Figure 3 are described in detail in the following section of the report:
1. Digitize shoreline features from current and historic georeferenced air photos from a
stratified sample of geomorphic shoretypes across the county.
2. Calculate shoreline change rates for each shoreform and statistically analyze the results.
3. Apply a multiplier for increased erosion based on shoretype and stratification variables
(as necessary).
4. Project the future position of the shore by integrating the vertical change in sea level
(based on the most current projections for the region) with the extrapolating
background (historic) erosion rates to each shoretype.
5. Create erosion and inundation vulnerability polygons for both a moderate and a high
SLR scenario across two planning horizons (2050 and 2100).
6. Apply spatial queries to identify potentially at risk infrastructure (structures and roads)
within each of the hazard polygons and highlight areas from which specific management
strategies should be applied.Sea Level Rise Vulnerability in San Juan County Final Report, Page 12 COASTAL GEOLOGIC SERVICES, INC. Figure 3. Sequence of the major tasks of the sea level rise model for San Juan County. 3.1 Shore Change Analysis The first step in conducting the shore change analysis element of this study was to identify representative shoreforms of each geomorphic shoretype. The stratification structure of the sample of shoreforms required that half of the shoreforms of each type were exposed to less than 5 miles of fetch and half were exposed to 5 miles or more of fetch. Approximately half of each exposure category was oriented to the southern quadrants and half to the northern quadrants. Erosion rates were calculated from at least 12 of each shoretype, which represents approximately 2% of each shoreform type (Table 4). Shoreforms selected for shore change analysis were required to be primarily unarmored, and free of other potential sources of interference to change rates, such as bedrock islets directly offshore. Historic, vertical aerial photography of high resolution and with visibility of the upper beach and bluff with a low georeferencing error (root mean square (RMS)
Sea Level Rise Vulnerability in San Juan County
Final Report, Page 13                                                          COASTAL GEOLOGIC SERVICES, INC.

Table 4. Sampling design displaying shoreforms, stratification of shoreforms by exposure and orientation, and
hypothetical “likely acceleration rate”.

Shoreforms                                                    Exposure                     Orientation

13 Feeder Bluffs                                                                       3 Southern quadrant
                                                          5 with 5 mi fetch
                                                                                       4 Northern quadrant

12 Transport Zones                                                                     3 Southern quadrant
                                                          5 with 5 mi fetch
                                                                                       4 Northern quadrant

12 Barrier Beaches                                                                     4 Southern quadrant
                                                          6 with 5 mi fetch
                                                                                       4 Northern quadrant

21 Pocket Beaches                                                                      6 Southern quadrant
                                                         11 with 5 mi fetch
                                                                                       4 Northern quadrant
Sea Level Rise Vulnerability in San Juan County Final Report, Page 14 COASTAL GEOLOGIC SERVICES, INC. Figure 4. Shoreforms sampled for shore change analysis (from Whitman et al. 2012). 3.2 DSAS and Statistical Analysis The Digital Shoreline Analysis System (DSAS) is a free software application that was developed by the Environmental Systems Research Institute (ESRI) and USGS. DSAS computes rate of change statistics for a time series of shoreline vector data. DSAS automates the shore change process allowing for greater efficiency and reduces the opportunity for error. Prior to running the software, baselines were created from which transects would be drawn perpendicular to the shoreline. Baselines were created by exporting sample shoreform reaches of the WDNR Shorezone shoreline (WDNR 2001) and buffering those reaches landward of the feature digitizing. Cumulatively over 300 transects were placed at 82‐foot (25‐meter) intervals across the sampled shoreforms. DSAS then calculated the distance between each
Sea Level Rise Vulnerability in San Juan County
Final Report, Page 15                                                     COASTAL GEOLOGIC SERVICES, INC.

shoreline feature and calculated an end point rate (EPR), which equates to the measured distance
between the two features divided by the number of years between those features (e.g. 1960 and 2009).
EPR measures were then analyzed within each individual shoreform and across each shoretype.

3.3 Estimating the Future Position of the Shoreline
This element of the vulnerability assessment is complex and although considerable uncertainties exist
regarding when shorelines will reach the predicted locations, they will inevitably retreat to the vicinity of
the predicted locations. The estimated future position of the shoreline for each planning horizon is the
cumulative product of the background rate of erosion, the predicted degree of acceleration resulting
from the increasing rate of sea level rise, combined with the vertical change in sea level across the
number of years in that planning horizon.
Modeling Inundation
The first step in applying this approach was to transpose the shoreform mapping from the WDNR best
available science high water shoreline (2001 WDNR) to a shoreline that is linked with a vertical datum.
This was conducted by first creating a MHHW digital elevation model (DEM) using VDatum (v 3.1 Spargo
et al. 2006) with grid‐spacing of 100 ft. Each portion of the grid represented the difference between
NAVD88 and MHHW at that location. The grid size (100 ft) was selected to both maximize processing
time while also minimizing the different between adjacent grids. Very little difference (< 0.01 ft) was
seen between grids at this resolution. Since VDatum only performs conversions for in‐water locations,
portions of the grid on land were not calculated. An interpolation of nearby in‐water values was used to
“extend” the conversion grid over the land. The conversion values were then applied to the LiDAR data to
produce a new digital elevation model (DEM) in MHHW datum.
The MHHW shoreline was then linked to shoreform data by applying a mapping technique referred to as
a euclidian allocation to accurately transpose the shoretype boundaries so as to pair shoreform data
with other variables such as fetch.
The inundation areas for each SLR horizon where created from the MHHW DEM. The lower limits of the
inundation polygons were the highest observed water level (HOWL) for 2009, which was +3.4 ft above
MHHW (for Friday
Harbor, http://tidesandcurrents.noaa.gov/data_menu.shtml?stn=9449880%20Friday%20Harbor,%20WA
&type= Bench%20Mark%20Sheets). A contour line was generated using GIS for that elevation and
additional contours to represent the upper boundary of the inundation polygons from both the
moderate and high scenarios for 2050 and 2100. The lines were then converted to polygons that
represent all regions between successive inundation steps (2050 moderate, 2050 high, 2100 moderate,
and 2100 high). The contours were retained for further use in determining erosion hazard zones.
Modeling Bluff Recession
Accelerated erosion rates were calculated using an equation well‐cited in peer reviewed literature and
was also described in the background section of this report. Recent research conducted by Ashton et al.
(2011) and Walkden and Hall (2011) documented a strong relationship between SLR rate and bluff
recession rate. This equation was used to predict future erosion based on future rates of SLR. SCAPE
simulations run across a wide range of model parameter space including variations in wave height,
period, tidal range and rock strength revealed that a simple expression could be used to relate the rate
of SLR and the equilibrium recession rate (Ashton et al. 2012, Walkden and Dickson 2008).
You can also read