An initiative of the Women and Girls Foundation with support from Henry L. Hillman Foundation
←
→
Page content transcription
If your browser does not render page correctly, please read the page content below
An initiative of the Women and Girls Foundation with
support from Henry L. Hillman Foundation

                                                       1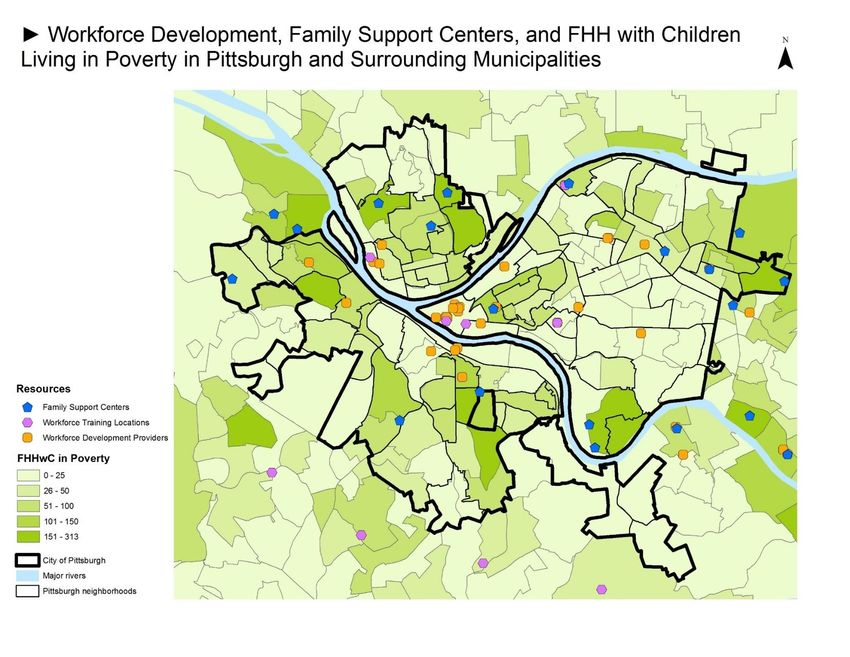
IN PITTSBURGH:
PERCENTAGE OF HOUSEHOLDS LIVING IN POVERTY THAT ARE HEADED BY SINGLE MOMS

                                                                            2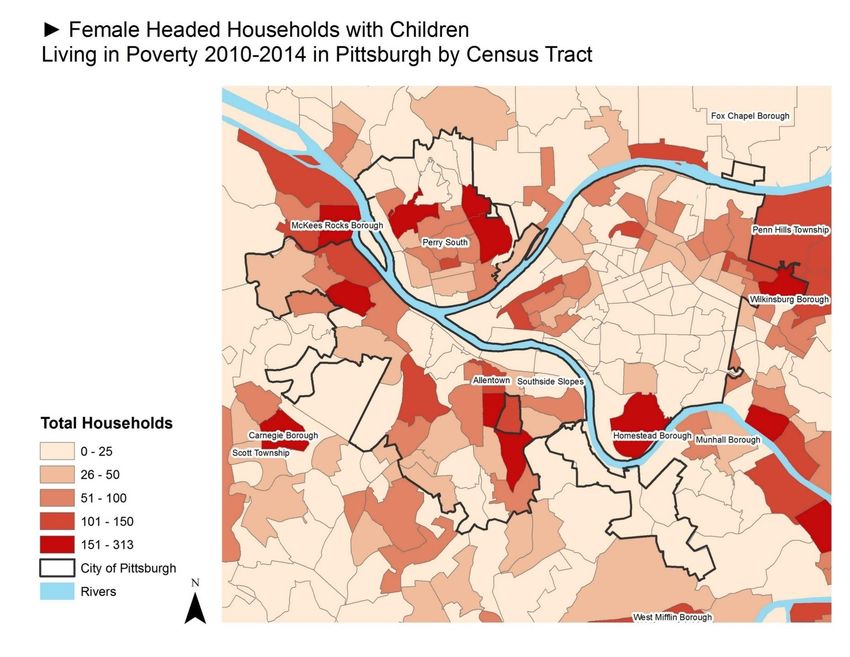
IN PITTSBURGH:
PERCENTAGE OF HOUSEHOLDS LIVING IN POVERTY THAT ARE HEADED BY SINGLE MOMS

            2005:                                2016:
             75%                                  77%

                                                                            3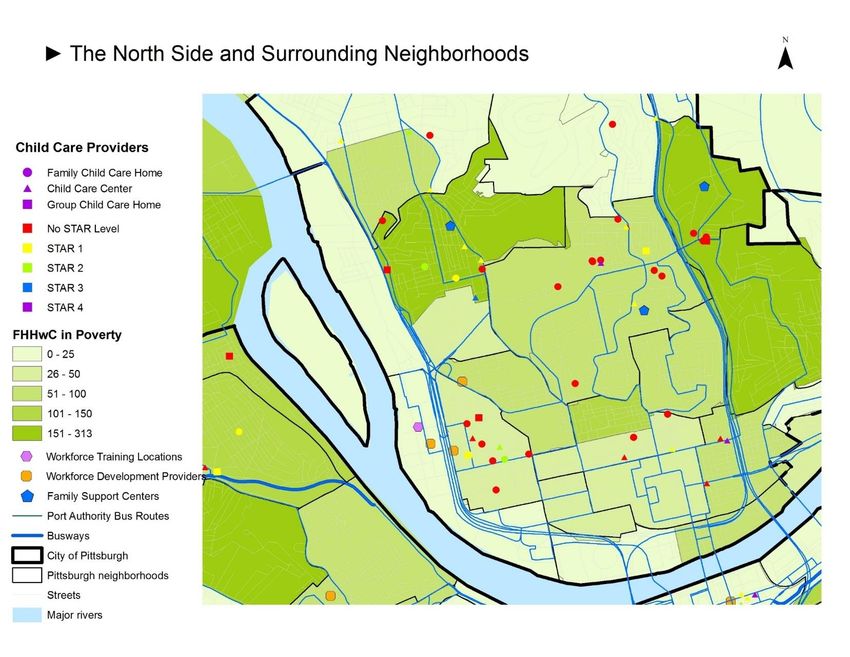
THIS IS NOT A LOCAL PHENOMENON
NATIONALLY WOMEN’S POVERTY RATES = 30% HIGHER THAN MEN’S

   Native American, Black,
    & Hispanic women:
   ≥ 2x the poverty rate of
        White women.

 More than 1 in 4 Native
   American & Black
 women live in poverty.

      Source: IWPR analysis of American Community Survey microdata (Integrated Public Use Microdata Series, Version 5.0).   4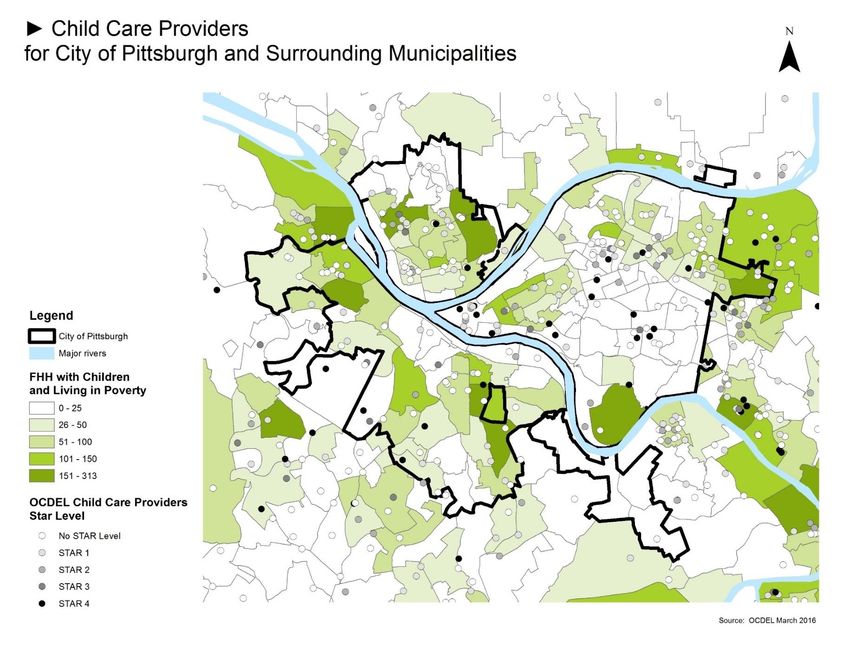
POVERTY & RACE:

           Pittsburgh                         Pittsburgh                   Pittsburgh
        All Households                     Poor Households            Poor Female Headed
                                                                          Households

             Other, 6%                       Other, 9%                         Other, 6%

                                                                                           White, 27%
                                                         White, 31%
Black, 26%

                         White, 67%
                                                                      Black, 68%
                                      Black, 60%

                                                                                                        5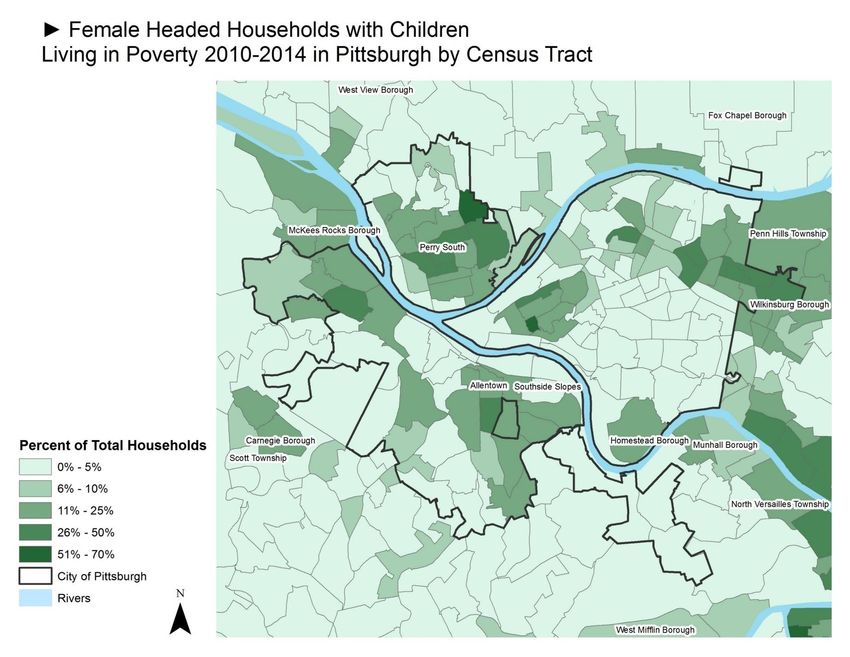
IF WE CAN WORK TOGETHER TO
IMPROVE POVERTY RATES FOR
WOMEN IN OUR CITY, WE CAN
  CREATE A BLUEPRINT THAT
  OTHERS CAN USE IN THEIR
      COMMUNITIES.
               ……..CREATING A RIPPLE EFFECT

                                              6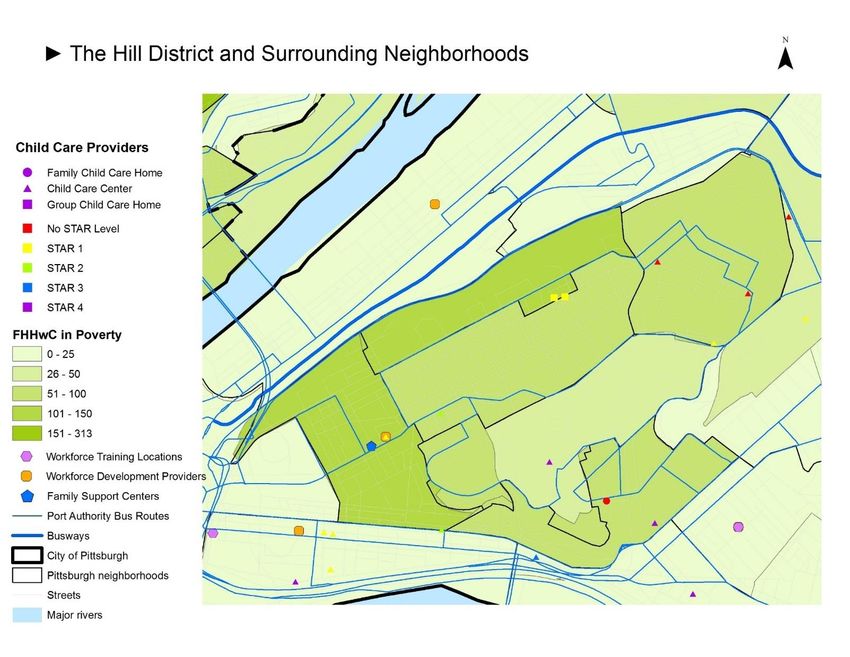
COMMUNITY VOICES
Qualitative Data & Survey Analysis conducted by
The Women and Girls Foundation

DATA ANALYTICS & MAPPING
Analytics provided by
Allegheny County Department of Human Services
Office of Data Analysis, Research, and Evaluation

                                                    7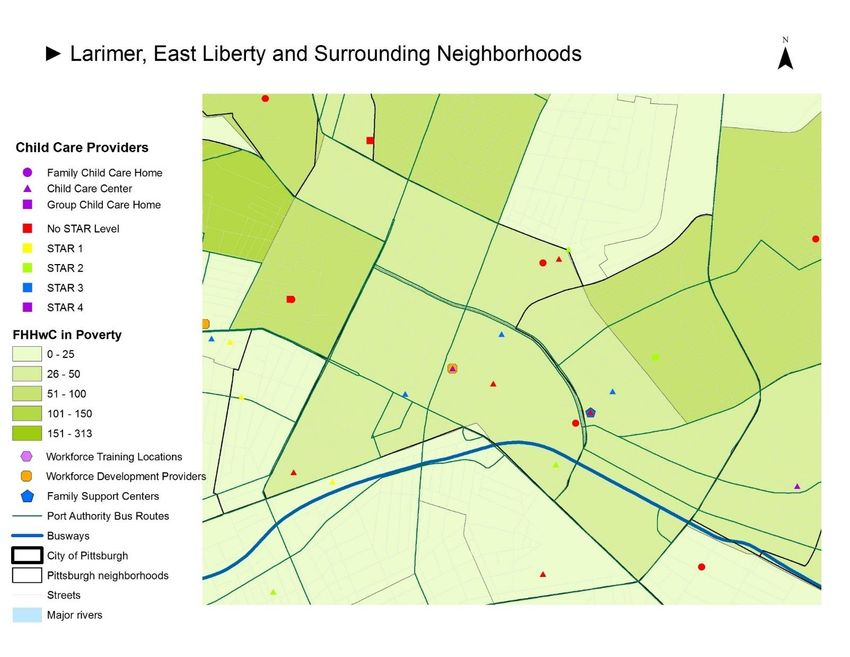
SURVEYED INDIVIDUALS AT 22 FAMILY SUPPORT CENTERS
•   Braddock Family Care Connection        •   Turtle Creek Family Care Connection
•   Clairton Family Center                 •   Wilkinsburg Family Center
•   Duquesne Family Support Center         •   Wilkinsburg Family Support Center
•   Greater Hazelwood Family Center        •   Lawrenceville Family Care
•   Hill District Center for Nurturing     •   Connection East Allegheny Family Center
    Families                               •   Northview Heights Family Support
•   Hilltop Family Care Connection             Center
•   Lincoln Park Family Center             •   Highlands Family Center
•   McKeesport Family Center               •   Sto-Rox Center
•   Prospect Park Family Center            •   East Hills Family Center
•   Providence Family Support Center       •   Homewood-Brushton Family Center
•   Steel Valley Family Center             •   Latino Family Center

                                         COMMUNITY VOICES
                                                                                    8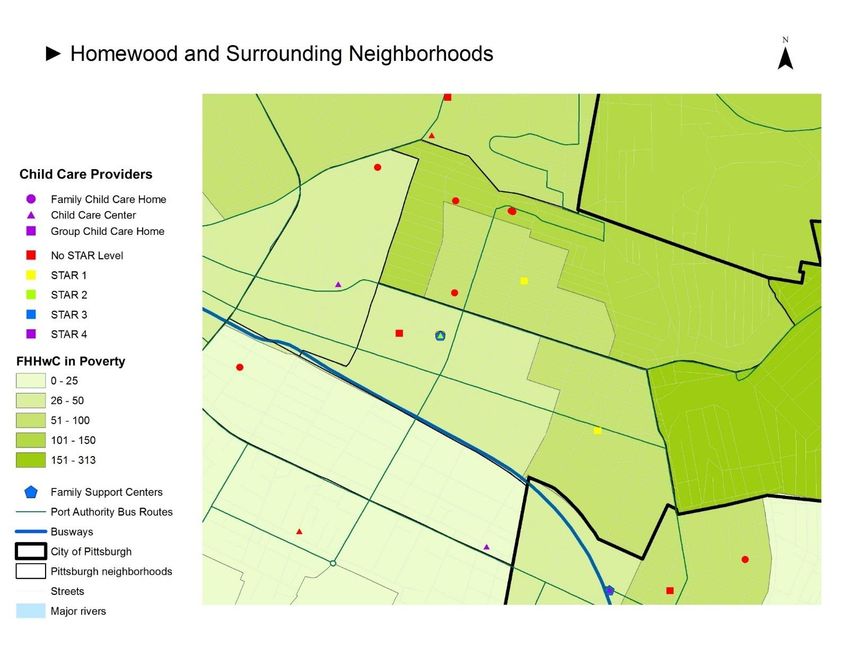
9

10 CENSUS TRACTS HAVE 32% OF PITTSBURGH’S
SINGLE MOTHERS LIVING IN POVERTY
                                                                               Single Mothers in
                                                  Single     Single Mothers
                                                                                  Poverty (of
   Tract          Neighborhood/Municipality     Mothers in    in Poverty (of
                                                                                 Households in
                                                 Poverty     all Households)
                                                                                   Poverty)
   1306                      East Hills            301            41%                93%

   3001                      Knoxville             300            30%                76%

   2620                 Spring Hill‐City View      210            35%                84%

   2609                  Northview Heights         201            64%                85%

   5623                     Glen Hazel             192            24%                57%

   2902                       Carrick              164            16%                76%

   2715                  Marshall‐Shadeland        152            21%                92%

   1301                  Homewood North            146            29%                69%

   5625                      Sheraden              133            22%                100%

   1803                      Allentown             129            20%                100%

           Total for These Neighborhoods          1,928           28%                81%

                                                  5,992           10%                60%
            Total for City of Pittsburgh
                                                                                                   10
11
10 CENSUS TRACTS WITH HIGHEST RATE -
SINGLE MOTHERS LIVING IN POVERTY ARE
30-70% OF ALL HOUSEHOLDS
                                                                                       Poor Single Mothers in
                                        Single Mothers     Poor Single Mothers in
    Tract   Neighborhood/Municipality                                                  Poverty (of Households
                                          in Poverty     Poverty (of All Households)
                                                                                            in Poverty)
    511           Terrace Village            98                     70%                         97%

    2609        Northview Heights            201                    64%                         85%

    509          Bedford Dwellings           149                    50%                         73%

    1306             East Hills              301                    41%                         93%

    1016              Garfield               109                    40%                         73%

    2503         Central Northside           101                    37%                         83%

    2507        California‐Kirkbride         59                     36%                         83%

    2620        Spring Hill‐City View        210                    35%                         84%

    1204              Larimer                63                     35%                         70%

    3001             Knoxville               300                    30%                         76%

                                                                                                                12
In your opinion, considering the last 5 years, has the overall quality
of life in your community…
Improved
10%
Worsened Stayed the
61% Same
29%
13When you think specifically about single mothers in your
neighborhood, what do you see as the top 3 barriers to their
economic security?
Top 3 Barriers
100%
90%
80%
70%
60%
50%
40%
30%
20%
10%
0%
Childcare Transportation Jobs Education
* Surprisingly only 1% mentioned housing.
15WHAT WE HEARD –
CONCERNS AROUND CAREGIVING
“Child care and housing are affordable
“Stress levels are insane.” in our neighborhood, but very low
quality.”
“My sister had breast cancer at age 31 and “Paid Family Leave
had two young kids - she faced long-term would be awesome!”
economic effects from taking time off work.”
“As a single mom myself, I had to take care of my son
with appendicitis. I had to use all my vacation time at
once, despite this being frowned upon. We need to
strengthen services for families. Healthy mothers =
Healthy Babies. Healthy means financially stable.”
16How would you rate access to childcare in your community?
Good
5%
Satisfactory
19%
Unsatisfactory
66%
17CHILDCARE FACILITIES IN THE CITY OF PITTSBURGH
Of the City’s 223 childcare
facilities:
▪ 54% are Center-based
▪ 46% are home-based
▪ 118 (53%) are unrated
▪ Only 36 (16%) have a high-
quality rating (STAR 3 or 4)
▪ There are only 21 subsidized
programs for children at risk of
school failure
18CHILD CARE FACILITIES IN SELECTED NEIGHBORHOODS
BY STAR QUALITY RATING
1 1 1
1 Out of 68 facilities:
2
3
1 1
3 Only 12 have a high-
2 2
8 quality rating
2 40 are unrated
4 STAR 4
STAR 3
6 22
6 STAR 2
STAR 1
2
No STAR
Level
EastLiberty/Larimer Hill District Homewood Northside
Total 12 10 10 36
Facilities
19CHILD CARE FACILITIES IN SELECTED NEIGHBORHOODS
& PROGRAMS FOR CHILDREN AT RISK OF SCHOOL FAILURE
1 Out of 68 facilities,
3 2 only 7 offer
subsidized high-
quality programs for
children at risk of
school failure in these
35 neighborhoods
9
9 8
TRUE
HeadStart / PreKCounts
FALSE
No Program
EastLiberty/Larimer Hill District Homewood Northside
Total 10
12 10 36
Facilities
2021
CURRENT CAPACITY CANNOT
ACCOMMODATE NEED
Facilities Offering Children 0-5
Population of
Neighborhood PreKCounts /HeadStart per
Children Age 3-5
Programs Facility
East Liberty/Larimer 217 3 72
Homewood 350 1 350
Hill District 238 2 119
Northside 561 1 561
Total 1,366 7 195
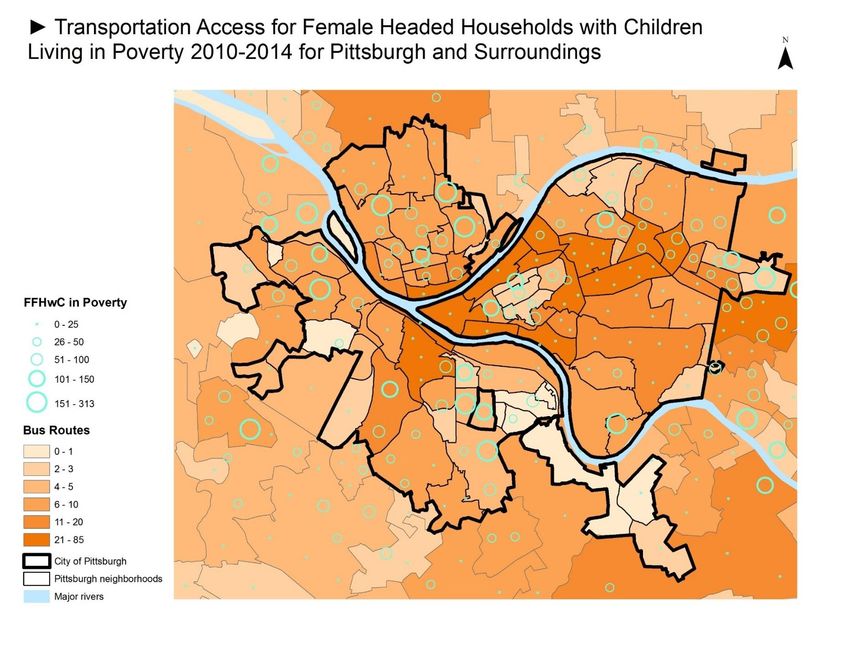
22WHAT WE HEARD – CONCERNS REGARDING
TRANSPORTATION & EMPLOYMENT
“Transportation is very limited “The maternity clinic was just shut
with the port authority system, down, forcing mothers to take 2
especially on the weekends and buses to access good health
facilities.”
in the evenings.”
“If I could change anything, I would have more
sources of employment, and not just construction
jobs, jobs for women. Not saying that women can't
do construction, but...women are the majority of the
people we serve, the poor, and they want access to
jobs to take care of their families.”
“There's a reproductive health care center in town
but otherwise you have to go all the way to
children's hospital, and again, transportation is a
major issue to accessing health care.”
23How would you rate access to transportation in your community?
Decent/Good
10%
Satisfactory Unsatisfactory
24% 66%
2425
How would you rate access to jobs in your community?

               Good
                5%

                  Satisfactory
                      33%
                                 Unsatisfactory
                                     66%

                                                  * 0% responded “Good”

                                                                          26
27
TRAINING SERVICES

                                       Training Services Offered
                                                                                 Specific       Total
     Location
                             Pre-                     Employment                Population    Providers
                                       Job Training                 Retention
                          Employment                    Support

     Allegheny County        97%           73%           73%          64%           35%        45 (100%)

     City of Pittsburgh      97%           81%           71%          64%           29%        31 (100%)

  Source: Allegheny County Department of Human Services, Office of Data Analysis, Research, and Evaluation
  (2016).                                                                                                    28
WIA/WIOA WORKFORCE
DEVELOPMENT TRAININGS, 2014-2016
Female Male Total
% of % of
Race N N N % of Total
Total Total
Black 49 18% 79 29% 128 46%
White 38 14% 85 31% 123 45%
Other/Unknown 11 4% 20 7% 29 11%
Total Participants 94 34% 182 66% 276 100%
Females made up 1/3 of participants
Source: Allegheny County Department of Human Services, Office of Data Analysis, Research, and Evaluation
(2016). 29EMPLOYMENT POST-TRAINING
Female Male Total
% of Female % of Male % of All
N N N
Participants Participants Participants
Total Participants 94 100% 182 100% 276 100%
Entered Unsubsidized Employment 37 39% 120 66% 157 57%
Training Related to Employment 28 30% 92 51% 120 43%
39% of female participants reported employment post-training,
compared to 66% of males
Source: Allegheny County Department of Human Services, Office of Data Analysis, Research, and Evaluation
(2016). 30UPDATED INFORMATION FROM PARTNER4WORK ON
WORKFORCE TRAININGS
Individual Training (traditional post- Cohort Training (employer-driven
2016 Training
secondary institutions) technical training)
Share of Completion Placement Share of Completion Placement
participants rate rate participants rate rate
Women 34% 61% 75% 42% 95% 70%
Men 66% 79% 85% 58% 79% 61%
Source: Partner4Work
31TITLE 1 PROGRAM OUTCOME MEASURES BY GENDER
(2015-2016 PROGRAM YEAR)
Allegheny County
Job Placement Rate Retention Rate Avg 6-month Earnings
Dislocated Worker Dislocated Dislocated
Adult Program Adult Program Adult Program
Program Worker Program Worker Program
Total 84.6 88.2 84.9 88.7 $13,939 $16,858
Male 84.9 86.8 84.5 87.9 $14,375 $18,832
Female 84.3 90.0 85.2 89.5 $13,592 $14,579
City of Pittsburgh
Job Placement Rate Retention Rate Avg 6-month Earnings
Dislocated Worker Dislocated Dislocated
Adult Program Adult Program Adult Program
Program Worker Program Worker Program
Total 87.2 81.9 86.9 93.8 $13,454 $15,719
Male 84.9 76.1 85.9 92.9 $13,927 $17,861
Female 89.3 89.8 87.6 94.6 $13,120 $14,129
Source: Partner4Work
32PARTICIPATION AND AVERAGE WAGE FOR WORKFORCE
DEVELOPMENT EMPLOYED GRADUATES
Female Male
Total N Avg.
92% of employed
% of % of Participants Wage/hour graduates earn over
N N $15/hour
Industry / Area Total Total
Management 4 1% 1 0% 5 $32.69 Males are mainly employed
Accounting 2 1% 0% 2 $19.62 in commercial
Technology 3 1% 18 7% 21 $17.75
driving,
Commercial driving 8 3% 126 46% 134 $17.29
Healthcare 56 20% 1 0% 57 $16.86
manufacturing,
Construction 1 0% 13 5% 14 $16.00 technology and
Manufacturing 0% 20 7% 20 $15.49 construction
Paralegal 1 0% 1 0% 2 $14.00 Females are mostly
Administrative support 18 7% 0% 18 $12.77 employed in healthcare
Personal care 1 0% 0% 1 $10.00
and administrative
Counseling and mental health 0% 1 0% 1 $10.00
Other 0% 1 0% 1
support
Total 94 34% 182 66% 276 $16.82
Source: Allegheny County Department of Human Services, Office of Data Analysis, Research, and Evaluation
(2016). 33Average Commute Time
to Training Providers With Highest Female Enrollment
Travel Time on Public
Female
Provider Location Transportation from Select
Participants
Neighborhoods*
Downtown
CCAC 31 min 17 to 44 minutes
Pittsburgh
Downtown
Kaplan Career Institute 22 min 20 to 27 minutes
Pittsburgh
min 1:20 to 1:38 hr
All State Career School West Mifflin 6
(multiple transfers)
Steel Center Area Vocational Technical min 1:15 to 1:28 hr
Jefferson Hills 5
School (multiple transfers)
Source: Google Maps estimates, arriving by 9:00 am
* North Side, Homewood, Larimer/East Liberty, Hill District
3435
36
37
38
How would you rate access to money/capital to start a new
business in your community?

               Good
                5%

                 Satisfactory
                    22%

                                Unsatisfactory
                                    66%

                                                 * 0% responded “Good”

                                                                    39
How would you rate access to affordable housing in your
community?
Satisfactory
19%
Unsatisfactory
81%
* 0% responded “Good”
40How would you rate access to reproductive healthcare in your
community?
Unsatisfactory
15%
Decent/
Good
40%
Satisfactory
45%
41PUBLIC POLICIES
42• Said that having paid sick days would have
a positive impact on their community.
90%
• Said that having paid family leave
would have a positive impact on their
81% community.
• Said that increasing the minimum
wage would have a positive impact on
76% their community.
Public Policies with Broad Community
Impact
43How likely is it that you or someone in your family would face significant economic
hardship if you had to take unpaid time off from your job to deal with a serious illness,
to care for a new child or to care for a family member who is ill?
44CLOSING THE GENDER WAGE GAP
WOULD CUT POVERTY IN HALF
Poverty Rate for Families with and without Equal Pay
29%
15%
11%
5%
2% 1%
Single Mothers Other Single Women Married Women
Current If working women earned the
same as comparable men
Source: IWPR calculations based on the Current Population Survey Annual Social and Economic supplements, 2010-2012, for 45
calendar years 2009-2011; all in 2012 dollars.OPPORTUNITIES FOR IMPROVEMENT
Currently workforce – transportation – and
childcare are disconnected.
Currently there are no WIA/WIOA trainings
for child care workers. And not enough
“star” childcare centers in communities.
Currently few employers provide paid sick
days or paid family leave.
Currently few SFHH have access to start-
up capital to start a new business. 46HOW CAN WE WORK TOGETHER TO
CREATE A FEMISPHERE?
Put women at the center of development efforts.
Think of them when creating new workforce opportunities.
Connect trainings and jobs to transportation and childcare.
Advocate for workforce policies to support working families –
paid family leave, paid sick days, increased minimum wage.
When we are “investing” in communities, let’s make sure
we are investing in women.
47Thank You!
An initiative of the Women and Girls Foundation with
support from Henry L. Hillman Foundation
48You can also read


