Nursing Facility Task Force: The Massachusetts Nursing Home Industry at a Crossroads - Executive Office of Health and Human Services - Mass.gov
←
→
Page content transcription
If your browser does not render page correctly, please read the page content below
Nursing Facility Task Force:
The Massachusetts Nursing
Home Industry at a
Crossroads

Executive Office of Health and Human Services
September 2019

Agenda
Oath, Welcome, and Introductions
Open Meeting Law and Conflict of Interest Policy
Task Force Members’ Goals
Proposed Agendas for the Task Force
Presentation: “Nursing Home Industry at a Crossroads,”
including overview of recent Nursing Facility investment
packages
1
Potential Topics for the Task Force
Topics
Intro, goals and setting the stage
Oath, Welcome, and Introductions
Open Meeting Law and Conflict of Interest Policy
September
Task Force Members’ Goals
(9/20/19)
Proposed Agendas for the Task Force
Presentation: “Nursing Home Industry at a Crossroads,” including recent Nursing Facility
investment packages
Current State: Services & Payment Methodology
Overview of long-term and elder care continuum
October
MassHealth Rates 101, including general background, overview of MDS assessment,
reimbursement for specialized services, etc.
Topics
November Strategies to strengthen the long-term and elder care service continuum
Workforce initiatives, e.g., recruitment, training, retention
MassHealth reimbursement system
Strategies to align service capacity with current and future demand
December Other policy issues relevant to the sustainability of nursing facilities and broader
continuum
Closing
January
Review draft of Task Force Report
2
In 2018, EOHHS partnered with the industry to provide a short-term
stabilization package
Beginning October 1, 2018 and totaling $25M annually, the short-term
stabilization package includes:
̶ $9M rate adjustments for facilities with high or improved quality scores,
including additional funding for facilities serving a high portion of MassHealth
members
̶ $6M investment to increase rates for care provided to complex member
populations with serious mental illness, including those with co-occurring
substance use disorders, or with intellectual or developmental disabilities
̶ $7M broad-based rate increase for all facilities due to an adjustment to
nursing component of rates
̶ $3M additional investment to support direct care staff through increased
wages, benefits, bonuses, overtime or other benefits
The Department of Public Health modified its regulations to allow nursing homes
to co-locate other services and lines of business within their campus/ facility
and to expedite voluntary closure process
3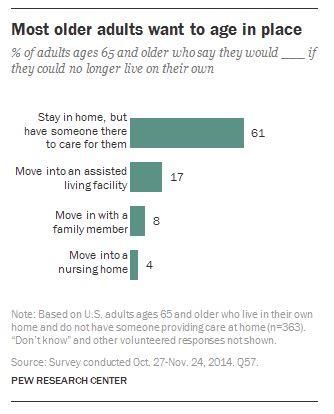
In SFY20, EOHHS is implementing a $56M investment in the nursing
facility industry
Beginning November 1, 2019, MassHealth will implement an investment package totaling
~$56 million (M) per year:
~$15M in targeted investment distributed to all facilities that meet criteria established in the
FY20 budget with an equal per diem payment
̶ $6M investment for facilities with 3+ Medicare stars, in addition to existing quality
add-ons
̶ $4.5M investment in critical access facilities with high Medicaid occupancy
̶ $4M investment in complex patient populations
̶ $0.5M investment in geographically isolated communities for facilities in the Cape
or Islands
~$35M investment for an inflationary adjustment to rebase nursing facility rates to
2014 cost base year (nursing, operating, and capital components)
~$6M investment to modernize the rate structure by simplifying the capital component of
the rate. The current capital rate structure will be replaced with four different geography-
based capital rates. This change will reduce administrative burden and lead to further
investment in high Medicaid occupancy facilities.
4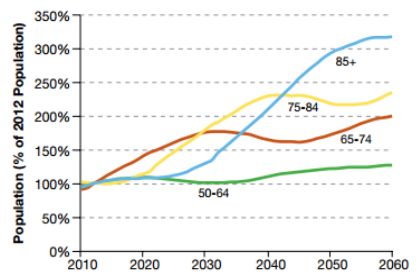
Massachusetts demographics about older adults
Older adults represent >15% of the
MA Population Growth by Age Groups
Massachusetts population
– Massachusetts population over 60: 1.4M (21.2%)
– Massachusetts population over 65: 1.0M (15.1%)
Access to healthcare among the Medicare
population in Massachusetts:
– 23% are Medicare managed care enrollees
– 17% are dually eligible for Medicare and
Medicaid
Disability in Massachusetts
– 22% of adults 65 to 74 years old report a
disability
– 48% of adults 75+ years old report a disability
Low Income Adults in Massachusetts
– About 1 out of 4 elder households have an
annual income below $20K
Source: Massachusetts Department of Elder Affairs Annual Legislative Report FY 2018; University of Massachusetts Boston Center for Social and Demographic Research on Aging (2017)
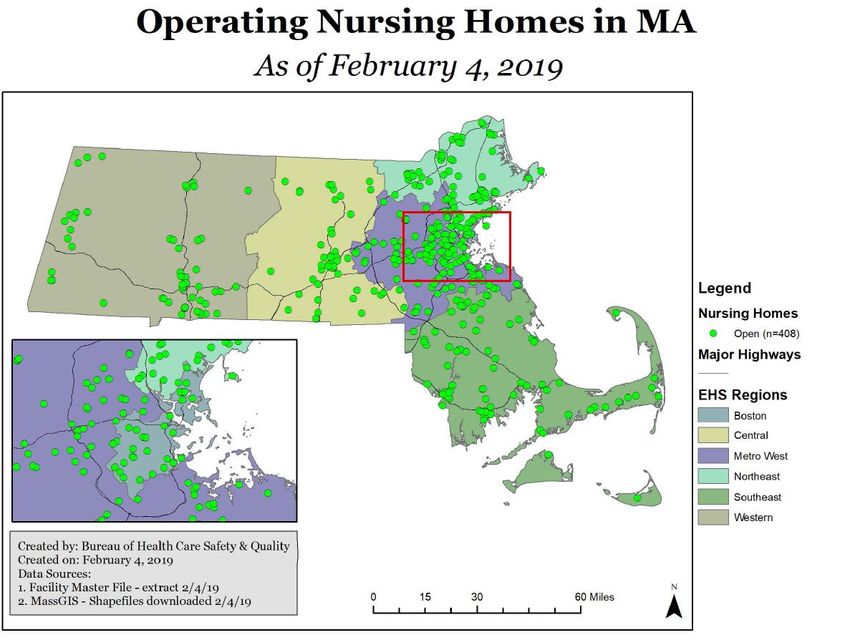
5As of early September, 2019, there were 383 operating nursing homes in Massachusetts Source: Massachusetts Department of Public Health (September 2019) 6
Nursing Homes and Long-Term Care Facts: Massachusetts
The nursing home industry is facing many challenges – broader than MassHealth
reimbursement
Compared to several decades ago, Massachusetts residents tend to
live longer as the statewide one-year mortality rates have continued to
decline.
At the same time, the older population has become younger as the
“baby boom” cohort ages and enters the 65+ group.
– For example, the percentage of persons between 65-74 increased
from 49.8% to 55.3% between 2011-2015.1
Many older adults want to age in the community instead of institutional
care in a nursing home
– 87% of adults age 65+ want to stay in their current home and
community as they age. Among people age 50 to 64, 71% of
people want to age in place.2
– Most older adults want to age in community; only 4% choose
moving to a nursing home.3
More individuals receive long term care services in non-institutional
settings:
– For example, of all persons receiving long term care services
through MassHealth4, only ~18% were receiving them in nursing
homes.
1. UMass Boston Gerontology Institute. Healthy Aging Data Report: Highlights from Massachusetts, 2018.; 2. AARP PPI, "What is Livable? Community Preferences of Older Adults,"
April 2014; 3. Pew Research Center Aging in Community; 4. Persons who received long term care services through Fee-For-Service Medicaid 7Nursing Homes and Long-Term Care Facts: Massachusetts, Cont.
The nursing home industry is facing many challenges – broader than MassHealth
reimbursement
Medicare (federal) policy changes have modified payment methodologies and increased
focus for ACOs on reducing admissions/length of stay in SNFs, leading to decreased
utilization and reimbursement of nursing homes
– Medicare reimbursement and utilization for nursing homes has decreased 25%
($300M) since 2011
– Additional reimbursement changes that will impact facilities become effective October
2019
54% growth in assisted living residences and expansion of publicly funded community-
based supports have created more choice and contributed to lower occupancy in and
accelerated closures of nursing homes
– Almost one in six nursing homes has an occupancy rate under 80%. The average
occupancy rate is 87%.
8More individuals are served at home and in the community (+11%) than
reside in nursing homes (-2%)…
Annual MassHealth Members, SFY16-18 Growth
270,000 267K Home/community:
Personal care,
260,000 11%
home care, and
249K other in-home &
250,000 community supports
239K
240,000
230,000
50,000
39.2K 38.3K 37.9K
40,000 -2%
Nursing Facility
0
SFY 16 SFY 17 SFY 18
Sources: MassHealth program data
9…and MassHealth has increased home and community-based supports by
over $900 million over 2 years
MassHealth Home & Community Based Program Spending, SFY15-17*
+9.3%
$5.5B Spending on home &
$5.0B community supports has
$4.6B
increased $900M from
SFY15 to SFY17
Total dollars spent on
community supports rose
from 45% in 2009 to 70%
in 2016
* Including EOHHS sister
agency waivers (e.g., Frail
Elder Waiver)
SFY15 16 17
Sources: MassHealth Balancing Incentive Program data
10Despite the declining number of members residing in nursing homes,
MassHealth has invested in short-term stabilization strategies
Massachusetts Nursing Home Spending & Members MassHealth spending
SFY 2015 to 2017 MassHealth members
Spending, $M Members, 000s Growth rate
Spend
1,380M 40K
$1,376M
+1.4%
1,375 39K
$1,370M
1,370 39
1,365
38K Members
1,360 $1,358M 38K
38
-3.2%
1,355
0 0
SFY 2015 2016 2017
MassHealth increased total nursing home expenditures by 1.4% from 2015-17 even
as the number of MassHealth members in nursing homes decreased by 3.2%
Sources: MassHealth program data
11The growth of the Assisted Living Residence Industry contributes to the
decline in the number of nursing facility residents
MA Assisted Living Residence Units, 2006-2019
• Assisted living
+54% 17.6K residences (ALRs)
15.8K provide choice and
greater independence
13.0K than nursing homes.
11.5K
• ALRs do not provide
24 hour nursing care
• In certain cases,
assisted living
residents receive
publicly funded
supports to support
their needs
2006 2010 2015 2019 to date
Sources: Elder Affairs program data
12As more individuals are served in non-institutional settings, nursing home
occupancy from 2014-17 dropped substantially
Massachusetts Nursing Home Occupancy Rate, 2014 - 2019
90%
• Recent and projected
89% 89%
increases in the avg.
occupancy rate is the result 88%
87%
of: 87%
86%
• Nursing home closures 86%
in 2017, 2018, and 85%
85% 85%
anticipated closures in
84% 84%
2019 (2,012 beds total) 83%
83%
• Occupancy across the industry
82%
is projected to increase over
the coming year to ~89% due 81%
to additional closures 80%
CY14 CY15 CY16 CY17 CY18 4/1/19 By end of
CY19
13All counties in Massachusetts have an average nursing home occupancy
rate below the efficient occupancy state standard of 94-96%
Nursing home Occupancy Rate by County, April 20191
Standard nursing
Essex facility rates are based
86% on an assumption that
Franklin** the average NF
90%
Middlesex occupancy is 94-96%
86%
Berkshire Hampshire** Worcester Suffolk
78% 86% 88% 90%
Norfolk
Hampden 86%
88%
Plymouth
Bristol 88%
89%
Barnstable
87%
Occupancy by County Key
90%
Dukes2
85%
Nantucket**
73%
1Self
reported beds out of service (BOOS) were included in calculation of occupancy rates
2Thereare very few NFs Dukes, Nantucket, Franklin, and Hampshire. So their occupancy may fluctuate a lot from quarter to quarter.
Source: SNF Census April 2019
14One in six nursing homes operates with occupancy under 80%
Nursing Home Occupancy Rate by home, April 2019 1
100%
90% 16% of NFs There are 366
haveIn summary
The current structure of the nursing home industry is not sustainable.
Long term reforms are required; increased MassHealth funding alone will
not solve these challenges.
The Baker-Polito administration made programmatic and financing changes in
FY19 and FY20 to support short-term stabilization in direct response to
the industry’s request.
In FY20, EOHHS will implement the FY20 State Budget and infuse an
additional $56M in the industry.
In addition to the Task Force, EOHHS continues to engage in a multi-year
effort to propose long-term reforms to the nursing home industry including:
– Strategies to evolve the current nursing home model and footprint in the
context of a changing community based long term care industry
– Restructured rates to simplify a complex and antiquated (20+ year)
methodology with the goal of reimbursing quality, geographical differences,
and member complexity
– Implement a revised uniform acuity classification
16You can also read