Antibiotic use and hygiene interact to influence the distribution of antimicrobial resistant bacteria in low income communities in Guatemala - Nature
←
→
Page content transcription
If your browser does not render page correctly, please read the page content below
www.nature.com/scientificreports
OPEN Antibiotic use and hygiene interact
to influence the distribution
of antimicrobial‑resistant bacteria
in low‑income communities
in Guatemala
Brooke M. Ramay1,2,7, Mark A. Caudell2,3,7, Celia Cordón‑Rosales1*, L. Diego Archila1,
Guy H. Palmer2,4, Claudia Jarquin1, Purificación Moreno1, John P. McCracken1,
Leah Rosenkrantz5, Ofer Amram2,6, Sylvia Omulo2 & Douglas R. Call2,4
To examine the effects of poor sanitation and hygiene on the prevalence of antimicrobial-resistant
bacteria, we surveyed households in two rural and two urban communities in Guatemala (N = 196
randomly selected households). One adult (≥ 18-years old) and, when available, one child (≤ 5 years-
old) provided a stool sample. Up to 48 presumptive Escherichia coli isolates were collected from each
stool sample (n = 21,256 total) and were subjected to breakpoint assays for ten antibiotics. Mixed-
effects logistic models were used to identify potential factors influencing the likelihood of harboring
antibiotic-resistant bacteria. For nine out of ten antibiotics, the odds of detecting resistant bacteria
decreased by ~ 32% (odds ratios, OR 0.53–0.8, P < 0.001) for every unit of improvement of a hygiene
scale. Hygiene differences between households had a greater impact on prevalence compared to
antibiotic use differences. The likelihood of detecting resistant isolates was lower for five antibiotics
among households that boiled raw milk before consumption (OR 0.31–0.69), and higher for nine
antibiotics in urban households (OR > 1.89–9.6). Poor hygiene conditions likely obscure effects of
individual antibiotic use, presumably due to enhanced microbial transmission. Consequently, efforts
to improve antibiotic stewardship should be coupled with improving hygiene conditions.
Antimicrobial-resistant infections contribute to hundreds-of-thousands of deaths w orldwide1. To address this
threat, public and private organizations are engaged in programs to improve surveillance for antimicrobial-
resistant organisms, to improve antibiotic stewardship, and to identify novel therapeutics, all of which are consid-
ered priority actions for combating antimicrobial resistance (AMR)2–4. The strategies adopted to limit AMR will
vary globally, particularly across countries with different degrees of wealth and development. The most effective
intervention will likely depend on prevailing conditions. For example, high-income countries and low-income
countries can differ in antimicrobial resistance patterns, antimicrobial use practices, access to healthcare services
(human and animal), sanitation and regulation i nfrastructures5–9.
Studies conducted within high-income countries, particularly those concerning healthcare f acilities10–12 and
the agricultural s ector13–15, have associated reductions in antimicrobial use and improved stewardship with
decreases in the prevalence of antimicrobial resistance. In contrast, studies examining global patterns of AMR
find that antibiotic use is not positively correlated with resistance in all cases and may instead be correlated with
1
Center for Health Studies, Universidad del Valle de Guatemala, 181 Avenida 11‑95, Guatemala City 01015,
Guatemala. 2Paul G. Allen School for Global Animal Health, Washington State University, Pullman, WA 99164,
USA. 3Food and Agriculture Organization of the United Nations, United Nations Complex, UN Avenue, Gigiri, PO
Box: 30470, Nairobi 00100, Kenya. 4Nelson Mandela African Institution of Science and Technology, P.O.BOX 447,
Arusha, Tanzania. 5Department of Geography, Simon Fraser University, Burnaby, BC V5A 1S6, Canada. 6Elson
S. Floyd College of Medicine, Washington State University, PO Box 1495, Spokane, WA, USA. 7These authors
contributed equally: Brooke M. Ramay and Mark A. Caudell. *email: ccordon@ces.uvg.edu.gt
Scientific Reports | (2020) 10:13767 | https://doi.org/10.1038/s41598-020-70741-4 1
Vol.:(0123456789)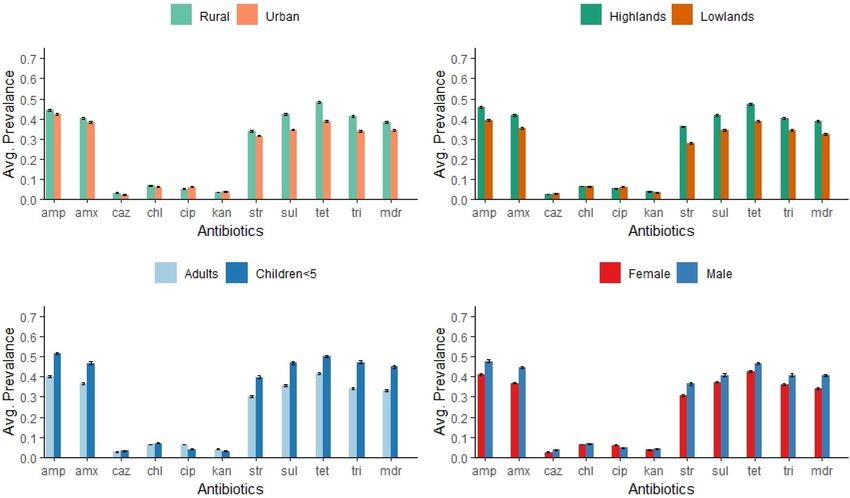
www.nature.com/scientificreports/
Figure 1. Map of selected communities. Base layers for map were downloaded from © OpenStreetMap
contributors https://www.vdsgeo.com/osm-data.aspx and licensed under Creative Commons Attribution-
ShareAlike 2.0. The map was created using ESRI ArcGIS. "Release 10." Redlands, CA: Environmental Systems
Research Institute.
indicators of transmission, including access to clean water5 and open defecation6. This lack of association between
antibiotic use and AMR in some settings may result from conditions in less-wealthy countries where the preva-
lence of antimicrobial resistance is more closely correlated with general transmission of b acteria16. Collignon et al.
recently demonstrated that at a country-scale, several factors including poor infrastructure likely contribute to
the overall prevalence of antibiotic-resistant pathogenic Escherichia coli in a c ountry5. At a local scale, it has been
postulated that if the frequency of transmission is high, the specific effect of antibiotic use on the prevalence of
resistant bacteria can be o vershadowed16,17, possibly due to transmission decoupling antibiotic selection events
from the distribution of antimicrobial-resistant bacteria. If correct, we should observe a stronger correlation
between antibiotic use practices and the prevalence of antibiotic resistant bacteria when transmission is limited.
To test how antibiotic use and transmission factors interact to influence the distribution of antimicrobial-
resistant bacteria in communities where these factors vary, we studied the distribution of antibiotic-resistant
Escherichia coli in four communities from the western highlands and lowlands of Guatemala. Study communities
were identified to represent presumed variance in transmission rates between urban and rural areas determined
by differences in sanitation, hygiene and population density. Highland and lowland communities were selected
to maximize variation in the presumed prevalence of illnesses that drive antibiotic consumption and associated
healthcare practices when experiencing vector-borne febrile illness, diarrhea, and respiratory illness. If there
is a significant interaction between antibiotic use and transmission factors, this has important implications for
how public health policies should direct resources to limit the prevalence of antibiotic-resistant bacteria in these
communities.
Methods
Study design, population, and sample size. We executed a repeated-measures study that included a
cross-sectional questionnaire and stool sample collection in October/November of 2017 (phase 1) and March/
April of 2018 (phase 2). Within the department of Quetzaltenango (pop. ≈155,000), two municipalities were
selected by convenience (from a total of 24) to represent differences in climate, altitude, and ethnic cultural
practices; all presumed to result in differences in the transmission and incidence of infection and resulting
antibiotic use (Fig. 1). The municipality of San Juan Ostuncaclo is situated in the highlands and is primar-
ily inhabited by the “Maya-Mam” indigenous ethnic group. The urban city center of San Juan Ostuncaclo was
paired with the rural community of Monrovia predominantly inhabited by Maya-Mam small-holder farmers
who speak “Mam”18. We selected two communities in the lowland municipality of Coatepeque (average eleva-
tion 149 m): the urban community of El Jardin and the peri-urban (“rural”) community of La Unión. In both
lowland communities, predominant inhabitants include the Spanish-speaking Mestizo. Both the lowland and
highland municipalities have high rates of poverty, although markedly higher in the highlands community (73%
in San Juan Ostuncalco, and 43% in Coatepeque19).
Scientific Reports | (2020) 10:13767 | https://doi.org/10.1038/s41598-020-70741-4 2
Vol:.(1234567890)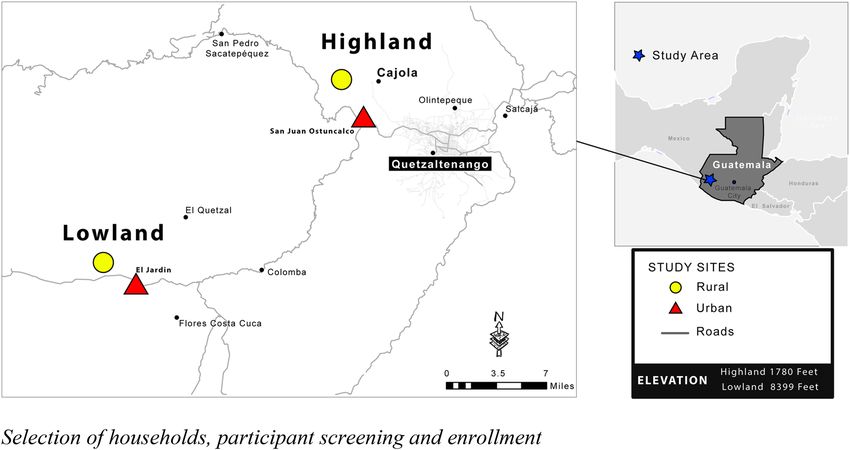
www.nature.com/scientificreports/
Variable name Questionnaire/study design definition Categories
Independent measures
AMR risk models
0-Child
Adult_child Participant is a child or an adult
1-Adult
0-Rural
Rural_urban Sample is from rural or urban community
1-Urban
A binary variable indicating whether the household reported diarrhea in the past 14 days (phase 1) and/or diarrhea between study 0 = No
Diarrhea
periods (phase 2) 1 = Yes
0 = No
Boiled milk Whether the household boiled milk before consuming
1 = Yes
Scaled variable Scale range
Created by summing three question categories 1) ever used antibiotics; 2) antibiotics used in last 14 days (phase 1); 3) antibiotics used
between study phases. A smaller number of individuals answered yes to all study questions, so the scale was collapsed into three catego-
ries (0, 1, 2) with
Antibiotic use scale Scale 0–2
Level (0) = No to all three questions
Level (1) = Yes to one of the three questions
Level (2) = Yes to two or more of the questions
A linear scale indicating increasing levels of household sanitation including whether feces were present on floor (reverse-coded), whether
the floor was dirt (reverse-coded), whether the household had a clothes washer, an improved toilet, a private toilet, whether river water
Household hygiene scale Scale 1–9
was used in household (reverse coded), ownership of animals (reverse coded), whether protozoa were detected in fecal samples (reverse-
coded) and whether trash was disposed in an appropriate location
Table 1. Description of variables entered into multivariate models.
Selection of households, participant screening and enrollment. We consulted several data sets
to generate lists for random selection of households. In 2016, the Ministry of Health and Social Assistance
(MSPAS) in collaboration with the Universidad del Valle de Guatemala, carried out a census of households
in both lowland communities. 2017 MSPAS census information was available for Monrovia. Census informa-
tion was not available for San Juan Ostuncalco. Instead, we used Google Earth satellite imagery20 to identify
city-blocks within the urban center that included rooftops. We then randomly selected 25% of these blocks.
Each door/gate for each block was approached to document the number of households behind each e ntrance21.
Households were subsequently numbered and random selection was used to identify households for poten-
tial enrollment. Following selection, household representatives, participants and child guardians were taken
through informed consent in Spanish or Mam by bilingual field technicians. Informed consent was obtained
from participants and from parents and child guardians of child participants. One adult and one child five years
old or younger (if available) were randomly selected (“participants”) from the list of household residents. The
study protocol was approved by Washington State University in Pullman Institutional Review Board (15895-
001), the Universidad del Valle de Guatemala-Center for Health Studies Ethics committee (159-01-2017), and
the Guatemalan Ministry of Health Ethics Committee (10-2017). All research was performed in accordance with
the relevant guidelines and regulations of these institutions.
Survey instruments were based on similar s tudies17,22 and included components from water sanitation and
health (“WASH”) defining poor sanitation as meeting one of the following conditions set out by the Joint Moni-
toring Programme for Water Supply, Sanitation and Hygiene (JMP) of WHO and UNICEF: unimproved JMP
toilet (pit latrine without slab/open/blind well), shared toilet, toilet not cleaned within the last four weeks, or the
last time a child passed stool it was not disposed of in t oilet23. See Supplement pgs. 2–4 for more information on
selection criteria and questionnaire development.
Stool collection kits and explicit instructions for stool collection were given to study participants enrolled
in phase 1, the same participants were approached for a second stool sample collection in phase 2. Participants
were instructed to pass stool into any clean and dry container, directly into the study-kit stool collection con-
tainer, or onto the Kraft paper provided in the study kit (see Supplemental “Instructions for Stool Collection”).
Households were contacted by study personnel within 24 h of initial study contact to collect stool samples. These
were then transported in cooler boxes with ice packs and stored under refrigeration for a maximum of 5 days
until they were shipped to a reference laboratory at the regional hospital in Quetzaltenango where isolates of
presumptive E. coli were obtained. Isolates were then tested for their susceptibility to ten antibiotics by using
breakpoint assays16,17,24. For these assays, bacteria are grown on agar plates with fixed concentrations of antibi-
otic and they are considered “resistant” when growth occurs, or susceptible when growth does not occur. See
Supplement pgs. 3–5 for information on isolation of E. coli, breakpoint assays, and validation of assays relative
to classic agar diffusion assays.
Statistical analysis. Selected independent variables were based upon results from reviews of antimicro-
bial resistance in low- and middle-income countries (e.g., the WHO Global Action Plan25) and from our own
ethnographic work (i.e., recurrent practices we observed that likely impacted transmission/selection). Included
variables represent the general categories of antibiotic use and access, hygiene and sanitation, sickness, and
demographics (Table 1). See Supplement pgs. 5–6 for additional information on variable selection.
Model specification proceeded by entering independent variables into a mixed-effects logistic regression
model that was clustered at the individual level. We specified models for all resistance phenotypes and a multidrug
Scientific Reports | (2020) 10:13767 | https://doi.org/10.1038/s41598-020-70741-4 3
Vol.:(0123456789)www.nature.com/scientificreports/
Number of households Adults Adult isolates Children Children isolates Total isolates
San Juan Ostuncalco, highland,
49 49 3,975 22 1,645 5,620
urban
Monrovia, highland, rural 50 50 4,362 32 2,600 6,962
El Jardin, lowland, urban 48 48 3,952 7 472 4,424
La Unión, lowland, rural 49 48 3,076 17 1,174 4,250
Total 196 195 15,365 78 5,891 21,256
Table 2. Number of presumptive E. coli isolates across locations and by adult (≥ 18-years old) and children
(≤ 5-years old).
Highlands Lowlands Total
n = 153 n = 120 n = 273
Demographics
Proportion of adult participants in study population 65% 80% 71%
Average age of adults 40 (± 16) 42 (± 17) 41 (± 16)
Average age of children 2 (± 1) 2 (± 1) 2 (± 1)
Females 74% 78% 74%
Indigenous ethnicity 72% 9% 44%
Adult participant: no formal education 31% 20% 27%
Adult participant: literate (reads) 47% 68% 57%
Household characteristics
JMP unimproved toileta 11% 23% 16%
Shared toilet, not on premise 53% 57% 55%
> 3 people per sleeping roomb 33% (48/146) 43% (31/91) 37% (87/237)
Dirt floors 30% 32% 30%
Household consumes any type of milk 45% 57% 50%
Household consumes raw milk only 37% 28% 33%
Raw milk boiled before consumption 37% 22% 30%
Milk storedc in household: raw milk, boiled 11% (6/56) 35% (9/26) 18% (15/82)
Milk storedc in household: packaged milk 38% (5/13) 79% (24/34) 61% (29/47)
Antibiotic use by participant
Ever used antibiotics 41% 86% 61%
Used antibiotics in the past 14 days 0% (0/70) 11% (8/75) 5% (8/145)
Used antibiotics between study phasesb 11% (9/84) 30% (14/46) 18% (23/130)
Table 3. Characteristics of the study population, n = number of individuals; ± = standard deviation. a Pit latrine
without a slab or platform, hanging latrines or bucket latrines. b Underreporting, total number of responses
indicated in parenthesis. c “Stored” means that the milk was not consumed immediately upon purchase.
resistance phenotype (MDR), which we defined as resistance to three or more antibiotic classes. Results were
summarized as odds ratios (OR), which we converted to percentage change in odds to facilitate interpretation
(e.g., an OR of 1.45 equals a 45% increase in the odds of exhibiting prevalence). When specifying interactions
between antibiotic use and hygiene/sanitation, continuous variables entered into interactions were first mean-
ulticollinearity26. To minimize attention to potentially spurious correlations, we restricted our
centered to limit m
inferences to variables that were significantly associated (P < 0.05) with resistance to ≥ 3 antimicrobial resistance
phenotypes. Model fit was good to adequate and tests of model fit are provided in Supplement pg 6 and Table S2.
Results
Descriptive results. A total of 196 households across all four communities (Table 2) participated in the
study. Stool samples were obtained from 195 adults and 78 children accounting for 273 individuals from 196
households provided 480 stool samples collected during the study period. The average age of adult participants
was 41 years (± 17 sd), and the average age of children was 2 years (± 1) (Table 3).
The majority of enrolled households in these communities were characterized as having poor sanitation
(89%, n = 237/265), including 16% of households having an JMP unimproved toilet and about half of households
sharing a toilet that was not located on the premises (55%). Unimproved toilets were more common in rural
areas (29%) versus urban areas (2%). More toilets were reported as shared and located outside the household in
rural areas 73% compared with 33% in urban households. Thirty-seven percent of households were defined as
“overcrowded” (> 3 people per sleeping room). Lowland regions had higher overall report of antibiotic use (see
Table 3), and higher reported prevalence of diarrhea in phase 1 versus highland communities (17% versus 1%).
Scientific Reports | (2020) 10:13767 | https://doi.org/10.1038/s41598-020-70741-4 4
Vol:.(1234567890)www.nature.com/scientificreports/
Figure 2. Mean (+ standard error) of antimicrobial resistant bacteria isolated from fecal samples collected from
different locations, ages, and gender. Coatepeque and San Juan Ostuncalco, 2017–2018. Antibiotics included
amp (ampicillin), amx (amoxicillin), caz (ceftazidime), chl (chloramphenicol), cip, (ciprofloxacin) and kan
(kanamycin), str, (streptomycin), sul (sulfamethoxazole), tet (tetracycline), tri (trimethoprim). MDR indicates
resistance to three or more classes of antibiotics. Standard errors account for within subject correlation.
Finding 1: The relative distribution of antimicrobial‑resistant bacteria differed between loca‑
tions, ages, and sexes. A total of 21,256 g-negative, lactose-fermenting bacteria (presumptive E. coli) were
isolated from 273 individuals sampled. The prevalence of resistance to ampicillin, amoxicillin, streptomycin,
sulfamethoxazole, trimethoprim, tetracycline, and the MDR resistance phenotype was about four times higher
(> 30%) compared to ceftazidime, chloramphenicol, ciprofloxacin and kanamycin (< 8%). Breakpoint and disc
diffusion assay results indicated the two methods provided a consistent estimate for the proportion of resistant
strains across ten different antibiotics (n = 99 isolates; r = 0.99; see Supplement Fig. S1). In general, the mean
prevalence of antimicrobial-resistant bacteria was higher in rural compared to urban areas, the highlands com-
pared to the lowlands, in children relative to adults, and for men relative to women (Fig. 2).
Finding 2: Antimicrobial resistance was associated with increasing frequency of antibiotic use,
household hygiene levels, milk consumption, and diarrhea. Antibiotic use was associated with a
higher likelihood of harboring detectable antimicrobial-resistant bacteria, but almost exclusively in households
classified as Level 2 in the antibiotic use scale (Table 1) which reported consuming the most antimicrobials
frequently. This group comprised 11% of the sampled population (see Table 1 for variable definition). For these
individuals there was a ≈50–113% increase in the likelihood of detecting bacteria resistant to all antibiotics with
the exception of kanamycin, which was associated with an 83% decrease (Table 4). In contrast, lower levels of
antibiotic use (≈50% of the sampled population) were associated with ≈50–70% lower odds of detecting bacteria
resistant to chloramphenicol, ciprofloxacin, and kanamycin but were associated with 54% increased odds of
detecting bacteria resistant to sulfamethoxazol.
For household hygiene, every unit increase in the hygiene scale (i.e., better hygiene) was associated with a
≈30–50% decrease in odds of detecting resistance to all antibiotics (Table 4). The sole exception to this trend
was kanamycin, where increasing household hygiene was associated with a 31% increase in odds of detecting
kanamycin resistant bacteria. Individuals who reported a diarrheal episode had substantially higher odds of hav-
ing bacteria resistant to ceftazidime (234%), kanamycin (475%) and sulfamethoxazole (49%), but significantly
reduced odds for detecting bacteria resistant to chloramphenicol (73%) and streptomycin (70%). Households
that reported drinking cow or goat milk and boiling it before consumption had lower odds of resistance than
households who (1) drank raw milk (2) drank powdered milk (3) drank boxed (packaged) milk (4) did not drink
milk at all. These households were associated with a ≈ 40–70% decrease in odds of having bacteria resistant to
ceftazidime, chloramphenicol, ciprofloxacin, or tetracycline.
Adults had ≈ 60% reduced odds of harboring bacteria exhibiting resistance to most antibiotics compared to
children. This significant difference did not hold for the less frequently encountered resistance phenotypes includ-
ing ceftazidime, chloramphenicol and kanamycin. Adults had significantly higher odds of (125%) of exhibiting
Scientific Reports | (2020) 10:13767 | https://doi.org/10.1038/s41598-020-70741-4 5
Vol.:(0123456789)www.nature.com/scientificreports/
Household hygiene Participant had Household boiled Adult/child Rural/urban
Antibiotics Level 1a,b AB use Level 2 AB use scale diarrhea milk Adult = 1 Urban = 1
Ampicillin 0.89 (0.68–1.18) 1.53*** (1.21–1.95) 0.69*** (0.63–0.77) 1.04 (0.86–1.25) 0.82 (0.52–1.29) 0.42*** (0.26–0.67) 2.10*** (1.31–3.37)
Amoxicillin 1.05 (0.80–1.38) 1.72*** (1.35–2.18) 0.77*** (0.70–0.84) 0.96 (0.80–1.15) 0.69* (0.45–1.06) 0.46*** (0.30–0.72) 1.56* (1.00–2.44)
Ceftazidime 0.91 (0.48–1.73) 0.65* (0.39–1.07) 0.58*** (0.46–0.73) 3.34*** (2.12–5.26) 0.38** (0.16–0.89) 0.77 (0.35–1.70) 2.78** (1.14–6.77)
Chloramphenicol 0.23*** (0.13–0.39) 1.82*** (1.17–2.82) 0.69*** (0.59–0.80) 0.27*** (0.18–0.40) 0.40*** (0.21–0.75) 1.21 (0.64–2.29) 3.31*** (1.67–6.55)
Ciprofloxacin 0.54** (0.31–0.93) 2.10*** (1.34–3.32) 0.51*** (0.41–0.63) 1.28 (0.90–1.82) 0.31*** (0.14–0.70) 2.25** (1.01–5.03) 5.96*** (2.50–14.22)
Kanamycin 0.28*** (0.15–0.51) 0.17*** (0.09–0.31) 1.31*** (1.10–1.55) 5.75*** (3.69–8.96) 0.85 (0.44–1.65) 1.24 (0.63–2.43) 1.25 (0.61–2.59)
Streptomycin 1.28* (0.96–1.72) 1.81*** (1.41–2.31) 0.80*** (0.72–0.88) 0.70*** (0.57–0.85) 0.73 (0.45–1.18) 0.40*** (0.24–0.65) 1.35 (0.83–2.22)
Sulfamethoxazole 1.54*** (1.15–2.07) 1.53*** (1.21–1.95) 0.56*** (0.50–0.62) 1.49*** (1.23–1.80) 0.93 (0.55–1.59) 0.45*** (0.26–0.78) 1.70* (0.99–2.93)
Tetracycline 0.96 (0.73–1.27) 1.59*** (1.26–2.01) 0.75*** (0.68–0.82) 0.92 (0.76–1.12) 0.62** (0.39–0.97) 0.52*** (0.33–0.83) 1.11 (0.69–1.77)
Trimethroprim 0.95 (0.72–1.27) 1.23 (0.96–1.57) 0.69*** (0.62–0.76) 1.14 (0.95–1.38) 0.93 (0.59–1.47) 0.43*** (0.27–0.69) 1.44 (0.90–2.31)
MDR 0.95 (0.71–1.27) 1.67*** (1.30–2.13) 0.62*** (0.56–0.69) 1.05 (0.87–1.27) 0.66 (0.40–1.11) 0.36*** (0.21–0.62) 2.21*** (1.31–3.74)
Table 4. Multivariate analysis of the correlates of antibiotic resistance. Across all antibiotics, the number of
observations is 21,256 and the number of groups (individuals) is 273. Coefficients are provided with 95%
confidence intervals. See Table 1 for variable definitions. a ***P < 0.01, **P < 0.05, *P < 0.1 b See Table 1 for
definitions. c Constant indicates the predicted mean odds ratio (OR) when all variables are 0.
resistance to ciprofloxacin. For participants residing in urban areas, there was a significantly increased odds of
detecting bacteria resistant to ampicillin (110%), ceftazidime (178%), chloramphenicol (231%), ciprofloxacin
(496%) and the MDR phenotype (121%) (Table 4).
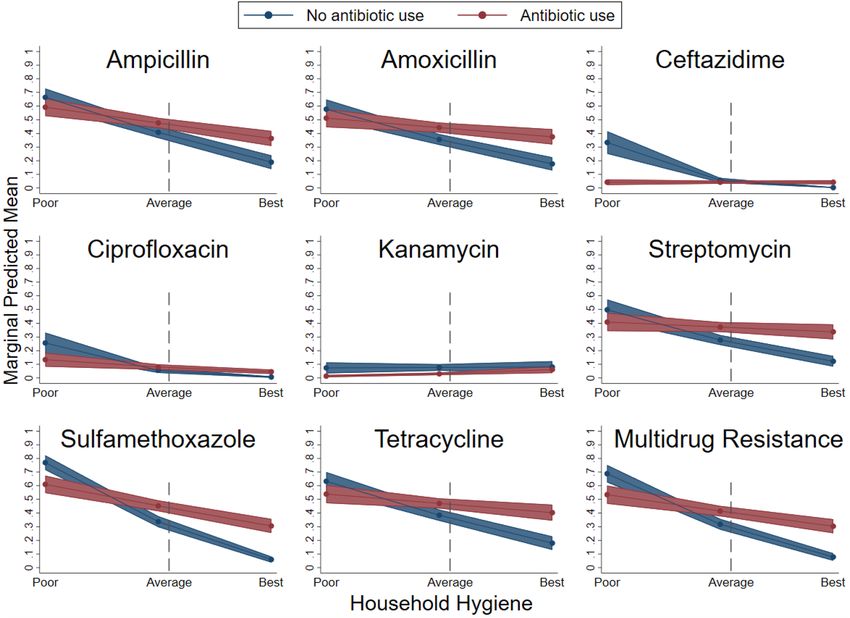
Finding 3: Hygiene levels are strongly associated with prevalence of antimicrobial‑resistant
bacteria, but antibiotic use is also associated when sanitation is good. To assess how prevalence
of antibiotic-resistant bacteria is affected by antibiotic use across household hygiene levels, interaction terms
were entered into the resistance models (see Supplement Table S2). Significant interactions (P < 0.05) between
antibiotic use and hygiene/sanitation were found for all antibiotics except for chloramphenicol and trimetho-
prim. To facilitate interpretation, we plotted the relationship between hygiene and antibiotic resistance sepa-
rately for individuals that reported using antibiotics (n = 104 individuals) and for those who reported not using
antibiotics (n = 173 individuals) (Fig. 3). At average household hygiene levels (≈ 6), there was little difference in
predicted resistance levels between users and non-users of antibiotics. For households with the best hygiene,
those reporting antibiotic use had a higher predicted probability of resistant bacteria compared to non-users
where the opposite occurred for the worst hygiene conditions. Confidence in the separation between antibiotic
users and non-users was greater for high hygiene levels compared with low hygiene levels, as indicated by con-
sistently non-overlapping 95% confidence intervals. For non-users, the differences between marginal predic-
tions at the lowest and highest levels of hygiene can be interpreted as the effect of hygiene while holding variables
(other than antibiotic use) constant at their means. This effect, across the majority of antibiotics, results in a 50%
decrease in predicted probabilities from the lowest to highest levels of hygiene. For example, isolates from non-
users in households with the lowest levels of hygiene have a predicted probability of 70% for exhibiting resist-
ance to ampicillin while this probability decreases to about 25% in non-user households with the best hygiene
levels. In contrast, for households that reported using antibiotics, the decrease in probabilities across low and
high hygiene levels was approximately 25%, indicating that the effects of hygiene on the probability of detecting
antimicrobial-resistant bacteria are moderated by antibiotic use.
Discussion
We found that each unit of improvement in the household hygiene index was associated with a ≈30–50%
reduction in the likelihood of detecting antimicrobial-resistant bacteria within people. Importantly, as hygiene
improved, the effects of using antibiotics became increasingly apparent. That is, poor hygiene modifies the effects
of antibiotic use, but this modification is not a strong issue when hygiene conditions are very good. This is consist-
ent with studies in diverse contexts indicating that hygiene may play an important role in the distribution and
persistence of antibiotic resistant bacteria within communities in low- and middle-income countries5,6,16,17,27.
An immediate implication of this interaction is that efforts to improve antibiotic stewardship, including control
of unregulated access to antibiotics, may have little immediate impact on the overall prevalence of antimicrobial
resistant bacteria when poor hygiene conditions are prevalent.
Given the considerable increase in odds in detecting antimicrobial-resistant bacteria across our household
hygiene scale, we surmise that bacterial transmission is the primary mechanism influencing the prevalence of
antimicrobial-resistant bacteria. We also found that individuals who reported boiling their raw milk before con-
sumption exhibited a significantly lower prevalence of bacteria that were resistant to amoxicillin, ceftazidime,
chloramphenicol, ciprofloxacin and tetracycline compared to those who consumed raw milk, drank powdered or
packaged milk, and those that reported not consuming any milk. These results, specifically in relation to house-
holds who consumed raw milk, are consistent with an earlier report showing that Maasai pastoralists in Tanzania
who boiled their milk exhibited reduced prevalence of antimicrobial-resistant bacteria17. Hygiene practices may
Scientific Reports | (2020) 10:13767 | https://doi.org/10.1038/s41598-020-70741-4 6
Vol:.(1234567890)www.nature.com/scientificreports/
Figure 3. Impact of antibiotic use on resistance across household hygiene levels. The dashed vertical line
indicates the average household hygiene score. Chloramphenicol and trimethoprim are not shown because the
interaction was not significant.
also account for the higher predicted resistances for those who used powdered or packaged milk. About one-third
of households reported not treating their water and mixing this with powdered milk would increase the risk of
transmission and sickness. Packaged milk was reported to be stored for longer periods compared to fresh milk,
which could also increase the risk of transmission and sickness if sub-standard storage practices (e.g., lack of
refrigeration) are used. The higher prevalence of resistance in households reporting no milk consumption is more
challenging to explain. It may be that households reporting no milk consumption are consuming other higher
risk alternatives which could also be related to the ability to purchase milk. To examine this further, we generated
a correlation matrix and found a weak positive correlation between milk consumption and wealth (r = 0.13) and
between milk consumption and household hygiene (r = 0.13) (see supplement Table S3). Further study is likely
needed to understand the constraints and substitutions that impact milk consumption in these communities.
While the relationship between milk consumption and resistance is clearly complex, the different environments
and cultures for which milk handling practices appear important (e.g., Guatemalan and Tanzanian communi-
ties), suggests that milk hygiene practices may play an important role in the transmission and persistence of
antimicrobial resistance within low-income communities. However, further study is needed to determine the
extent of improvement that might be achieved through mitigation of milk hygiene practices.
As with other studies conducted in low- and middle-income countries, we document a positive association
between living in more urban areas and antimicrobial resistance. And as with other low- and middle-income
countries, poor access to clean water, poor hygiene and sanitation conditions are evident in Guatemala although
the extent of these issues differ based on urban and rural s ettings28,29. For the present study, compared to rural
households, individuals living in urban areas had a ~ 170% increase in the odds of harboring bacteria resistant
to ampicillin, amoxicillin, ceftazidime, chloramphenicol, ciprofloxacin and the MDR phenotype. It is worth
emphasizing that the relationship between urban living and the odds of detecting antimicrobial-resistant bacteria
only emerges after controlling for antibiotic use, hygiene and sanitation, and age differences. Without controlling
for these differences, the prevalence of resistant bacteria is seemingly higher for most antibiotics in rural areas
than in urban areas (see Fig. 2). After controlling for hygiene and antimicrobial use, this relationship becomes
inverted, suggesting that there are likely other factors contributing to a higher prevalence of antimicrobial resist-
ance in urban areas.
Scientific Reports | (2020) 10:13767 | https://doi.org/10.1038/s41598-020-70741-4 7
Vol.:(0123456789)www.nature.com/scientificreports/
Antibiotic use had little measurable impact in sub-optimal hygiene conditions. The overall prevalence of
antibiotic-resistance phenotypes is consistent with the relative availability and cost of antibiotics sold without a
prescription in these communities (e.g., sold at shops called tiendas). Medications in Guatemala are subsidized
by the government through the Ministry of Health system and the National Social Security health care system,
yet frequent stock-outs force most Guatemalans to purchase medications out-of-pocket at private p harmacies29.
In these establishments, medications can be up to 20 times the international listed price [e.g., costing up to
15 days wages for third-generation c ephalosporins30]. In contrast, amoxicillin and tetracycline are considerably
more affordable and widely available in tiendas, perhaps reflecting antibiotic use in these communities where
the average prevalence of resistance to amoxicillin and tetracycline was approximately 40%.
We also detected several cases where factors including antibiotic use, hygiene, and diarrheal episodes were
correlated with both an increase and a decrease in the odds of harboring detectable levels of antimicrobial-
resistant bacteria. For example, while antibiotic use was mostly correlated with higher odds of detecting resist-
ance bacteria, it was correlated with lower odds of detecting bacteria resistant to Kanamycin (see Table 4).
There are likely two mechanisms underlying these observations. First, some resistance traits may have increased
in prevalence despite the absence of commensurate use of corresponding antibiotics (e.g., diarrheal episodes
and resistance to chloramphenicol). These changes always occurred in the context of similar changes in other
antibiotic-resistance phenotypes, and one likely explanation is co-selection that occurs when the genes encoding
these resistance traits are genetically linked. In essence, selection for one resistance phenotype co-selects for any
linked traits. In some cases, it is also possible that antibiotic use can “filter” a population, by favoring strains that
have the associated resistance gene and this would simultaneously increase the prevalence of any other genetic
resistance genes found with these strains (i.e., “co-selection”). At the same time there would be a decrease in the
prevalence of strains that do not harbor a resistance gene for the antibiotic being used. A potential example of
this is the relationship between the likelihood of detecting antimicrobial resistance with recent episodes of diar-
rhea, where prevalence of resistance to ceftazidime, kanamycin and sulfamethoxazole increased, but prevalence
of resistance to chloramphenicol and streptomycin decreased.
As with any epidemiological study, we are limited to identifying correlated variables for largely uncontrolled
systems, making clear cause-and-effect relationships difficult to identify due to confounded variables. An example
of this is the apparent higher prevalence of resistance in rural households shown in the univariate comparison
(Fig. 2) vs. the statistically higher likelihood of detecting resistant bacteria in urban households once several
other variables are controlled. Furthermore, our analysis of antibiotic use may be compromised by limitations of
participant recall31, and the commensurate limitations on the ability to gather accurate data about the magnitude
and frequency of antibiotic use. In addition, while we modeled household hygiene and sanitation as a linear
variable, hygiene and sanitation are clearly complex phenomena that include many interacting factors so that
an increase in one factor (handwashing frequency) likely does not reflect the same impact on the prevalence of
antimicrobial resistance as another (e.g., improved toilet). Nevertheless, we argue our composite measure repre-
sents a measure of of household hygiene and sanitation with changes in the scale reflective of general increases
and decreases in household hygiene and sanitation.
The robust relationship between hygiene and resistance in the sampled Guatemalan communities, along with
the interaction between hygiene and antibiotic use, provides important implications for the efficacy of steward-
ship efforts globally when aggregate hygiene levels are compromised. In such cases, investment in infrastructure
to improve hygiene can be easily justified as a tool to limit the proliferation of antimicrobial resistance in com-
munities across the globe. As this study highlights, assigning priorities and subsequent development of targeted
strategies will require analysis of a greater spectrum of living conditions, using cross-cultural investigations
developed and implemented by interdisciplinary teams from the natural and social sciences.
Ethics committee approval. The study protocol was approved by Washington State University in Pullman
Institutional Review Board (15895-001), the Universidad del Valle de Guatemala-Center for Health Studies Eth-
ics committee (159-01-2017), and the Guatemalan Ministry of Health Ethics Committee (10-2017).
Received: 9 April 2020; Accepted: 30 July 2020
References
1. O’Neill J. Tackling drug-resistant infections globally: Final report and recommendations.: The Review on Antimicrobial Resistance.
(2016).
2. World Health Organiztion. Global antimicrobial resistance surveillance system (GLASS) report: early implementation 2017–2018.
https://apps.who.int/iris/bitstream/handle/10665/279656/9789241515061-eng.pdf?ua=1 (2018).
3. Sprenger, M. Antimicrobial resistance, draft global action plan on antimicrobial resistance: Reported by the Secretariat. World
Health Oganization, Sixty-Eight World Health Assembly Provisional agenda item 15.1, (2015).
4. Center for Disease Control and Prevention. National Strategy for Combating Antibiotic Resistant Bacteria. https://www.cdc.gov/
drugresistance/pdf/carb_national_strategy.pdf (2014).
5. Collignon, P., Beggs, J. J., Walsh, T. R., Gandra, S. & Laxminarayan, R. Anthropological and socioeconomic factors contributing
to global antimicrobial resistance: a univariate and multivariable analysis. Lancet Planet. Health 2, e398–e405 (2018).
6. Hendriksen, R. S. et al. Global monitoring of antimicrobial resistance based on metagenomics analyses of urban sewage. Nat.
Commun. 10, 1124 (2019).
7. Okeke, I. N. et al. Antimicrobial resistance in developing countries. Part I: recent trends and current status. Lancet Infect. Dis. 5,
481–493 (2005).
Scientific Reports | (2020) 10:13767 | https://doi.org/10.1038/s41598-020-70741-4 8
Vol:.(1234567890)www.nature.com/scientificreports/
8. Caudell, M. A. et al. Towards a bottom-up understanding of antimicrobial use and resistance on the farm: a knowledge, attitudes,
and practices survey across livestock systems in five African countries. PLoS ONE 15, e0220274 (2020).
9. Caudell, M. A. et al. Antimicrobial Use and Veterinary Care among Agro-Pastoralists in Northern Tanzania. PLoS ONE 12,
e0170328 (2017).
10. Goossens, H., Ferech, M., Vander Stichele, R., Elseviers, M. & ESAC Project Group. Outpatient antibiotic use in Europe and
association with resistance: a cross-national database study. Lancet 365, 579–587 (2005).
11. Baur, D. et al. Effect of antibiotic stewardship on the incidence of infection and colonisation with antibiotic-resistant bacteria and
Clostridium difficile infection: a systematic review and meta-analysis. Lancet. Infect. Dis 17, 990–1001 (2017).
12. van de Sande-Bruinsma, N. et al. Antimicrobial drug use and resistance in Europe. Emerg. Infect. Dis. 14, 1722–1730 (2008).
13. Chantziaras, I., Boyen, F., Callens, B. & Dewulf, J. Correlation between veterinary antimicrobial use and antimicrobial resistance
in food-producing animals: a report on seven countries. J. Antimicrob. Chemother. 69, 827–834 (2014).
14. Tang, K. L. et al. Restricting the use of antibiotics in food-producing animals and its associations with antibiotic resistance in
food-producing animals and human beings: a systematic review and meta-analysis. Lancet Planet. Health 1, e316–e327 (2017).
15. Callens, B. et al. Associations between a decreased veterinary antimicrobial use and resistance in commensal Escherichia coli from
Belgian livestock species (2011–2015). Prevent. Vet. Med. 157, 50–58 (2018).
16. Subbiah, M. et al. Antimicrobial resistant enteric bacteria are widely distributed amongst people, animals and the environment in
Tanzania. Nature Communications 11, 228 (2020).
17. Caudell, M. A. et al. Identification of risk factors associated with carriage of resistant Escherichia coli in three culturally diverse
ethnic groups in Tanzania: a biological and socioeconomic analysis. Lancet Planet. Health 2, e489–e497 (2018).
18. Municipality Education Commission. Municipality Educational Plan 2013, Concepción Chiquirichapa Quetzaltenango. http://pdf.
usaid.gov/pdf_docs/PA00JDN1.pdf (2016).
19. Director of Territorial Planning. Departamental development plan 2011–2021.
20. Google Earth. Map showing location of San Juan Ostuncalco, Guatemala. (2017).
21. Turner, A. Sampling Strategies: Expert Group Meeting to Review the Draft Handbook on Designing of Household Sample Surveys 3–5
December 2003. https://unstats.un.org/unsd/demographic/meetings/egm/Sampling_1203/docs/no_2.pdf (2003).
22. Omulo, S. et al. Evidence of superficial knowledge regarding antibiotics and their use: results of two cross-sectional surveys in an
urban informal settlement in Kenya. PLoS ONE 12, e0185827 (2017).
23. Geneva: World Health Organization & United Nations Children´s Fund (UNICEF). Progress on drinking water, sanitation and
hygiene: 2017 update and SDG baselines. (2017).
24. Omulo, S. et al. The impact of fecal sample processing on prevalence estimates for antibiotic-resistant Escherichia coli. J. Microbiol.
Methods 136, 71–77 (2017).
25. World Health Organization. Global action plan on antimicrobial resistance. (2015).
26. Cohen, P., Cohen, J., West, S. & Aiken, L. Applied Multiple Regression/Correlation Analysis for the Behavioral Sciences. (Lawrence
Erlbaum Associates, 2003).
27. Rosenkrantz, L., Amram, O., Caudell, M. A., Schuurman, N. & Call, D. R. Spatial relationships between small-holder farms coupled
with livestock management practices are correlated with the distribution of antibiotic resistant bacteria in northern Tanzania. One
Health 8, 100097 (2019).
28. Jarquin, C. et al. Population density, poor sanitation, and enteric infections in Nueva Santa Rosa, Guatemala. Am. J. Trop. Med.
Hyg. 94, 912–919 (2016).
29. Avila, C. et al. Guatemala (Health system analysis, Health Finance and Governance Project (HFG) and USAID, 2015).
30. Anson, A., Ramay, B., Ruiz, A. & Bero, L. Availability, prices and affordability of the World Health Organization’s essential medicines
for children in Guatemala. Global. Health 8, 22 (2012).
31. Althubaiti, A. Information bias in health research: definition, pitfalls, and adjustment methods. J. Multidiscip. Healthc. 9, 211–217
(2016).
Acknowledgements
We gratefully acknowledge assistance from L. Jones, L. Orfe, J. Cundiff, J. C. Romero, and M. Drabowski as
well as the Community-based Surveillance of Acute Febrile Illnesses in Coatepeque Guatemala for providing
the platform for household recruitment in Guatemalan communities. Funding for this project was provided by
the Paul G. Allen School for Global Animal Health, Washington State University, Pullman, WA. The funders
had no role in study design, data collection and analysis, decision to publish, or preparation of the manuscript.
Author contributions
B.M.R., D.R.C., C.C.R., G.H.P., J.P.M., S.O. designed the study. B.M.R., D.R.C., C.C.R., L.D.A., C.J., P.M., J.P.M.,
planned and completed data collection. M.A.C., B.M.R., D.R.C., J.P.M., C.C.R., L.R. and O.A. designed the
analysis plan. D.R.C., S.O., D.R.C. completed the lab analysis and M.A.C. and B.M.R. performed the statistical
analyses. B.M.R., M.A.C., and D.R.C. wrote the first draft of the Article, which was revised and critically reviewed
by all other authors.
Competing interests
All authors declare no competing interests.
Additional information
Supplementary information is available for this paper at https://doi.org/10.1038/s41598-020-70741-4.
Correspondence and requests for materials should be addressed to C.C.-R.
Reprints and permissions information is available at www.nature.com/reprints.
Publisher’s note Springer Nature remains neutral with regard to jurisdictional claims in published maps and
institutional affiliations.
Scientific Reports | (2020) 10:13767 | https://doi.org/10.1038/s41598-020-70741-4 9
Vol.:(0123456789)www.nature.com/scientificreports/
Open Access This article is licensed under a Creative Commons Attribution 4.0 International
License, which permits use, sharing, adaptation, distribution and reproduction in any medium or
format, as long as you give appropriate credit to the original author(s) and the source, provide a link to the
Creative Commons licence, and indicate if changes were made. The images or other third party material in this
article are included in the article’s Creative Commons licence, unless indicated otherwise in a credit line to the
material. If material is not included in the article’s Creative Commons licence and your intended use is not
permitted by statutory regulation or exceeds the permitted use, you will need to obtain permission directly from
the copyright holder. To view a copy of this licence, visit http://creativecommons.org/licenses/by/4.0/.
© The Author(s) 2020
Scientific Reports | (2020) 10:13767 | https://doi.org/10.1038/s41598-020-70741-4 10
Vol:.(1234567890)You can also read