Assessing Gender Bias in Machine Translation - A Case Study with Google Translate
←
→
Page content transcription
If your browser does not render page correctly, please read the page content below
Assessing Gender Bias in Machine Translation – A Case
                                                         Study with Google Translate

                                         Marcelo Prates∗                                                         morprates@inf.ufrgs.br
                                         Pedro Avelar∗                                                         pedro.avelar@inf.ufrgs.br
                                         Luis Lamb                                                                     lamb@inf.ufrgs.br
                                         Federal University of Rio Grande do Sul
arXiv:1809.02208v2 [cs.CY] 13 Sep 2018

                                                                                     Abstract
                                                  Recently there has been a growing concern in academia, industrial research labs and
                                             the mainstream commercial media about the phenomenon dubbed as machine bias, where
                                             trained statistical models – unbeknownst to their creators – grow to reflect controversial
                                             societal asymmetries, such as gender or racial bias. A significant number of Artificial Intel-
                                             ligence tools have recently been suggested to be harmfully biased towards some minority,
                                             with reports of racist criminal behavior predictors, Apple’s Iphone X failing to differentiate
                                             between two distinct Asian people and the now infamous case of Google photos’ mistak-
                                             enly classifying black people as gorillas. Although a systematic study of such biases can
                                             be difficult, we believe that automated translation tools can be exploited through gender
                                             neutral languages to yield a window into the phenomenon of gender bias in AI.
                                                  In this paper, we start with a comprehensive list of job positions from the U.S. Bureau
                                             of Labor Statistics (BLS) and used it in order to build sentences in constructions like
                                             “He/She is an Engineer” (where “Engineer” is replaced by the job position of interest)
                                             in 12 different gender neutral languages such as Hungarian, Chinese, Yoruba, and several
                                             others. We translate these sentences into English using the Google Translate API, and
                                             collect statistics about the frequency of female, male and gender-neutral pronouns in the
                                             translated output. We then show that Google Translate exhibits a strong tendency towards
                                             male defaults, in particular for fields typically associated to unbalanced gender distribution
                                             or stereotypes such as STEM (Science, Technology, Engineering and Mathematics) jobs.
                                             We ran these statistics against BLS’ data for the frequency of female participation in
                                             each job position, in which we show that Google Translate fails to reproduce a real-world
                                             distribution of female workers. In summary, we provide experimental evidence that even if
                                             one does not expect in principle a 50:50 pronominal gender distribution, Google Translate
                                             yields male defaults much more frequently than what would be expected from demographic
                                             data alone.
                                                  We believe that our study can shed further light on the phenomenon of machine bias
                                             and are hopeful that it will ignite a debate about the need to augment current statistical
                                             translation tools with debiasing techniques – which can already be found in the scientific
                                             literature.

                                         1. Introduction
                                         Although the idea of automated translation can in principle be traced back to as long as
                                         the 17th century with René Descartes proposal of an “universal language” (Dascal, 1982),
                                         machine translation has only existed as a technological field since the 1950s, with a pio-
                                         neering memorandum by Warren Weaver (Locke & Booth, 1955; Weaver, 1955) discussing
                                         ∗. Equal conttribution

                                                                                           1
the possibility of employing digital computers to perform automated translation. The now
famous Georgetown-IBM experiment followed not long after, providing the first experimen-
tal demonstration of the prospects of automating translation by the means of successfully
converting more than sixty Russian sentences into English (Gordin, 2015). Early systems
improved upon the results of the Georgetown-IBM experiment by exploiting Noam Chom-
sky’s theory of generative linguistics, and the field experienced a sense of optimism about the
prospects of fully automating natural language translation. As is customary with artificial
intelligence, the initial optimistic stage was followed by an extended period of strong disillu-
sionment with the field, of which the catalyst was the influential 1966 ALPAC (Automatic
Language Processing Advisory Committee) report( (Hutchins, 1986). Such research was
then disfavoured in the United States, making a re-entrance in the 1970s before the 1980s
surge in statistical methods for machine translation (Koehn, 2009; Koehn, Hoang, Birch,
Callison-Burch, Federico, Bertoldi, Cowan, Shen, Moran, Zens, Dyer, Bojar, Constantin,
& Herbst, 2007). Statistical and example-based machine translation have been on the rise
ever since (Bahdanau, Cho, & Bengio, 2014; Carl & Way, 2003; Firat, Cho, Sankaran,
Yarman-Vural, & Bengio, 2017), with highly successful applications such as Google Trans-
late (recently ported to a neural translation technology (Johnson, Schuster, Le, Krikun,
Wu, Chen, Thorat, Viégas, Wattenberg, Corrado, Hughes, & Dean, 2017)) amounting to
over 200 million users daily.
In spite of the recent commercial success of automated translation tools (or perhaps
stemming directly from it), machine translation has amounted a significant deal of criticism.
Noted philosopher and founding father of generative linguistics Noam Chomsky has argued
that the achievements of machine translation, while successes in a particular sense, are not
successes in the sense that science has ever been interested in: they merely provide effective
ways, according to Chomsky, of approximating unanalyzed data (Chomsky, 2011; Norvig,
2017). Chomsky argues that the faith of the MT community in statistical methods is absurd
by analogy with a standard scientific field such as physics (Chomsky, 2011):
I mean actually you could do physics this way, instead of studying things like
balls rolling down frictionless planes, which can’t happen in nature, if you took
a ton of video tapes of what’s happening outside my office window, let’s say,
you know, leaves flying and various things, and you did an extensive analysis of
them, you would get some kind of prediction of what’s likely to happen next,
certainly way better than anybody in the physics department could do. Well
that’s a notion of success which is I think novel, I don’t know of anything like
it in the history of science.
Leading AI researcher and Google’s Director of Research Peter Norvig responds to these
arguments by suggesting that even standard physical theories such as the Newtonian model
of gravitation are, in a sense, trained (Norvig, 2017):
As another example, consider the Newtonian model of gravitational attrac-
tion, which says that the force between two objects of mass m1 and m2 a distance
r apart is given by
F = Gm1 m2 /r2
2where G is the universal gravitational constant. This is a trained model be-
cause the gravitational constant G is determined by statistical inference over
the results of a series of experiments that contain stochastic experimental error.
It is also a deterministic (non-probabilistic) model because it states an exact
functional relationship. I believe that Chomsky has no objection to this kind of
statistical model. Rather, he seems to reserve his criticism for statistical models
like Shannon’s that have quadrillions of parameters, not just one or two.
Chomsky and Norvig’s debate (Norvig, 2017) is a microcosm of the two leading stand-
points about the future of science in the face of increasingly sophisticated statistical models.
Are we, as Chomsky seems to argue, jeopardizing science by relying on statistical tools to
perform predictions instead of perfecting traditional science models, or are these tools, as
Norvig argues, components of the scientific standard since its conception? Currently there
are no satisfactory resolutions to this conundrum, but perhaps statistical models pose an
even greater and more urgent threat to our society.
On a 2014 article, Londa Schiebinger suggested that scientific research fails to take
gender issues into account, arguing that the phenomenon of male defaults on new tech-
nologies such as Google Translate provides a window into this asymmetry (Schiebinger,
2014). Since then, recent worrisome results in machine learning have somewhat supported
Schiebinger’s view. Not only Google photos’ statistical image labeling algorithm has been
found to classify dark-skinned people as gorillas (Garcia, 2016) and purportedly intelli-
gent programs have been suggested to be negatively biased against black prisoners when
predicting criminal behavior (Angwin, Larson, Mattu, & Kirchner, 2016) but the machine
learning revolution has also indirectly revived heated debates about the controversial field
of physiognomy, with proposals of AI systems capable of identifying the sexual orientation
of an individual through its facial characteristics (Wang & Kosinski, 2017). Similar con-
cerns are growing at an unprecedented rate in the media, with reports of Apple’s Iphone X
face unlock feature failing to differentiate between two different Asian people (Papenfuss,
2017) and automatic soap dispensers which reportedly do not recognize black hands (Mills,
2017). Machine bias, the phenomenon by which trained statistical models unbeknownst to
their creators grow to reflect controversial societal asymmetries, is growing into a pressing
concern for the modern times, invites us to ask ourselves whether there are limits to our
dependence on these techniques – and more importantly, whether some of these limits have
already been traversed. In the wave of algorithmic bias, some have argued for the creation
of some kind of agency in the likes of the Food and Drug Administration, with the sole
purpose of regulating algorithmic discrimination (Kirkpatrick, 2016).
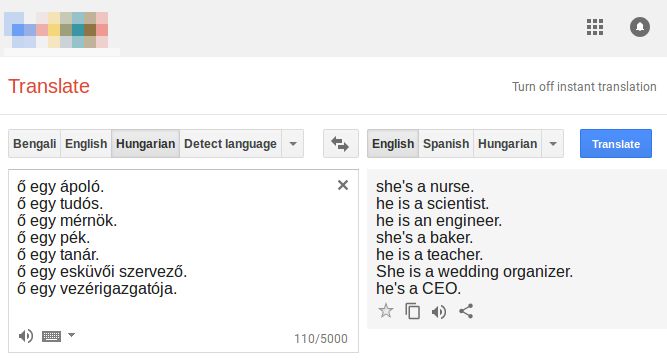
With this in mind, we propose a quantitative analysis of the phenomenon of gender bias
in machine translation. We illustrate how this can be done by simply exploiting Google
Translate to map sentences from a gender neutral language into English. As Figure 1
exemplifies, this approach produces results consistent with the hypothesis that sentences
about stereotypical gender roles are translated accordingly with high probability: nurse
and baker are translated with female pronouns while engineer and CEO are translated
with male ones.
3Figure 1: Translating sentences from a gender neutral language such as Hungarian to En-
glish provides a glimpse into the phenomenon of gender bias in machine trans-
lation. This screenshot from Google Translate shows how occupations from tra-
ditionally male-dominated fields (of Labor, 2017) such as scholar, engineer and
CEO are interpreted as male, while occupations such as nurse, baker and wedding
organizer are interpreted as female.
2. Motivation
As of 2018, Google Translate is one of the largest publicly available machine translation tools
in existence, amounting 200 million users daily(Shankland, 2017). Initially relying on United
Nations and European Parliament transcripts to gather data, since 2014 Google Translate
has inputed content from its users through the Translate Community initiative(Kelman,
2014). Recently however there has been a growing concern about gender asymmetries in the
translation mechanism, with some heralding it as “sexist” (Olson, 2018). This concern has
to at least some extent a scientific backup: A recent study has shown that word embeddings
are particularly prone to yielding gender stereotypes(Bolukbasi, Chang, Zou, Saligrama, &
Kalai, 2016). Fortunately, the researchers propose a relatively simple debiasing algorithm
with promising results: they were able to cut the proportion of stereotypical analogies from
19% to 6% without any significant compromise in the performance of the word embedding
technique. They are not alone: there is a growing effort to systematically discover and
resolve issues of algorithmic bias in black-box algorithms(Hajian, Bonchi, & Castillo, 2016).
The success of these results suggest that a similar technique could be used to remove gender
bias from Google Translate outputs, should it exist. This paper intends to investigate
4whether it does. We are optimistic that our research endeavors can be used to argue that
there is a positive payoff in redesigning modern statistical translation tools.
3. Assumptions and Preliminaries
In this paper we assume that a statistical translation tool should reflect at most the in-
equality existent in society – it is only logical that a translation tool will poll from examples
that society produced and, as such, will inevitably retain some of that bias. It has been
argued that one’s language affects one’s knowledge and cognition about the world (Kay &
Kempton, 1984), and this leads to the discussion that languages that distinguish between
female and male genders grammatically may enforce a bias in the person’s perception of the
world, with some studies corroborating this, as shown in (Boroditsky, Schmidt, & Phillips,
2003), as well some relating this with sexism (Thompson, 2014) and gender inequalities
(Santacreu-Vasut, Shoham, & Gay, 2013).
With this in mind, one can argue that a move towards gender neutrality in language and
communication should be striven as a means to promote improved gender equality. Thus,
in languages where gender neutrality can be achieved – such as English – it would be a valid
aim to create translation tools that keep the gender-neutrality of texts translated into such
a language, instead of defaulting to male or female variants.
We will thus assume throughout this paper that although the distribution of translated
gender pronouns may deviate from 50:50, it should not deviate to the extent of misrep-
resenting the demographics of job positions. That is to say we shall assume that Google
Translate incorporates a negative gender bias if the frequency of male defaults overesti-
mates the (possibly unequal) distribution of male employees per female employee in a given
occupation.
4. Materials and Methods
We shall assume and then show that the phenomenon of gender bias in machine translation
can be assessed by mapping sentences constructed in gender neutral languages to English
by the means of an automated translation tool. Specifically, we can translate sentences
such as the Hungarian “ő egy ápolónő”, where “ápolónő” translates to “nurse” and “ő” is a
gender-neutral pronoun meaning either he, she or it, to English, yielding in this example the
result “she’s a nurse” on Google Translate. As Figure 1 clearly shows, the same template
yields a male pronoun when “nurse” is replaced by “engineer”. The same basic template can
be ported to all other gender neutral languages, as depicted in Table 3. Given the success
of Google Translate, which amounts to 200 million users daily, we have chosen to exploit
its API to obtain the desired thermometer of gender bias. Also, in order to solidify our
results, we have decided to work with a fair amount of gender neutral languages, forming
a list of these with help from the World Atlas of Language Structures (WALS) (Dryer &
Haspelmath, 2013) and other sources. Table 1 compiles all languages we chose to use, with
additional columns informing whether they (1) exhibit a gender markers in the sentence and
(2) are supported by Google Translate. However, we stumbled on some difficulties which
led to some of those langauges being removed, which will be explained in .
5There is a prohibitively large class of nouns and adjectives that could in principle be
substituted into our templates. To simplify our dataset, we have decided to focus our work
on job positions – which, we believe, are an interesting window into the nature of gender bias
–, and were able to obtain a comprehensive list of professional occupations from the Bureau
of Labor Statistics’ detailed occupations table (Bureau of Labor Statistics, 2017), from the
United States Department of Labor. The values inside, however, had to be expanded since
each line contained multiple occupations and sometimes very specific ones. Fortunately
this table also provided a percentage of women participation in the jobs shown, for those
that had more than 50 thousand workers. We filtered some of these because they were
too generic ( “Computer occupations, all other”, and others) or because they had gender
specific words for the profession (“host/hostess”, “waiter/waitress”). We then separated
the curated jobs into broader categories (Artistic, Corporate, Theatre, etc.) as shown in
Table 2. Finally, Table 4 shows thirty examples of randomly selected occupations from our
dataset. For the occupations that had less than 50 thousand workers, and thus no data
about the participation of women, we assumed that its women participation was that of
its upper category. Finally, as complementary evidence we have decided to include a small
subset of 21 adjectives in our study. All adjectives were obtained from the top one thousand
most frequent words in this category as featured in the Corpus of Contemporary American
English (COCA) https://corpus.byu.edu/coca/, but it was necessary to manually curate
them because a substantial fraction of these adjectives cannot be applied to human subjects.
Also because the sentiment associated with each adjective is not as easily accessible as for
example the occupation category of each job position, we performed a manual selection of
a subset of such words which we believe to be meaningful to this study. These words are
presented in Table 5. We made all code and data used to generate and compile the results
presented in the following sections publicly available in the following Github repository:
https://github.com/marceloprates/Gender-Bias. Note however that because the Google
Translate algorithm can change, unfortunately we cannot guarantee full reproducibility of
our results. All experiments reported here were conducted on April 2018.
6Phrases
have
Language Family Language Tested
male/female
markers
Austronesian Malay 5 X
Estonian 5 X
Uralic Finnish 5 X
Hungarian 5 X
Armenian 5 X
Bengali O X
Indo-European English X 5
Persian 5 X
Nepali O X
Japonic Japanese 5 X
Koreanic Korean X 5
Turkic Turkish 5 X
Yoruba 5 X
Niger-Congo
Swahili 5 X
Isolate Basque 5 X
Sino-Tibetan Chinese O X
Table 1: Gender neutral languages supported by Google Translate. Languages are grouped
according to language families and classified according to whether they enforce
any kind of mandatory gender (male/female) demarcation on simple phrases (X:
yes, 5: never, O: some). For the purposes of this work, we have decided to work
only with languages lacking such demarcation. Languages colored in red have been
omitted for other reasons. See Section
4.1 for further explanation.
7Female Partici-
Category Group # Occupations
pation
Education, training,
Education 22 73.0%
and library
Business and financial
Corporate 46 54.0%
operations
Office and administra-
Service 87 72.2%
tive support
Healthcare support Healthcare 16 87.1%
Management Corporate 46 39.8%
Installation, mainte-
Service 91 4.0%
nance, and repair
Healthcare practition-
Healthcare 43 75.0%
ers and technical
Community and social
Service 14 66.1%
service
Sales and related Corporate 28 49.1%
Production Production 264 28.9%
Architecture and engi-
STEM 29 16.2%
neering
Life, physical, and so-
STEM 34 47.4%
cial science
Transportation and
Service 70 17.3%
material moving
Arts, design, entertain-
Arts / Enter-
ment, sports, and me- 37 46.9%
tainment
dia
Legal Legal 7 52.8%
Protective Service Service 28 22.3%
Food preparation and
Service 17 53.8%
serving related
Farming /
Farming, fishing, and
Fishing / 13 23.4%
forestry
Forestry
Computer and mathe-
STEM 16 25.5%
matical
Personal care and ser-
Service 33 76.1%
vice
Construction and ex- Construction
68 3.0%
traction / Extraction
Building and grounds
cleaning and mainte- Service 10 40.7%
nance
Total - 1019 41.3%
Table 2: Selected occupations obtained from the U.S. Bureau of Labor Statistics
https://www.bls.gov/cps/cpsaat11.htm, grouped by category. We obtained a to-
tal of 1019 occupations from 22 distinct categories. We have further grouped them
into broader groups (or super-categories) to ease analysis and visualization.
8Language Occupation sentence template Adjective sentence template
Malay dia adalah hoccupationi dia hadjectivei
Estonian ta on hoccupationi ta on hadjectivei
Finnish hän on hoccupationi hän on hadjectivei
Hungarian ő egy hoccupationi ő hadjectivei
Armenian na hoccupationi e na hadjectivei e
Ē ēkajana hoccupationi Ē hadjectivei
Yini ēkajana hoccupationi Yini hadjectivei
Ō ēkajana hoccupationi Ō hadjectivei
Bengali
Uni ēkajana hoccupationi Uni hadjectivei
Sē ēkajana hoccupationi Sē hadjectivei
Tini ēkajana hoccupationi Tini hadjectivei
Japanese あの人は hoccupationi です あの人は hadjectivei です
Turkish o bir hoccupationi o hadjectivei
Yoruba o je. hoccupationi o je. hadjectivei
Basque hoccupationi bat da hadjectivei da
Swahili yeye ni hoccupationi yeye ni hadjectivei
Chinese ta shi hoccupationi ta hen hadjectivei
Table 3: Templates used to infer gender biases in the translation of job occupations and
adjectives to the English language.
Insurance sales agent Editor Rancher
Ticket taker Pile-driver operator Tool maker
Jeweler Judicial law clerk Auditing clerk
Physician Embalmer Door-to-door salesperson
Packer Bookkeeping clerk Community health worker
Sales worker Floor finisher Social science technician
Probation officer Paper goods machine setter Heating installer
Animal breeder Instructor Teacher assistant
Statistical assistant Shipping clerk Trapper
Pharmacy aide Sewing machine operator Service unit operator
Table 4: A randomly selected example subset of thirty occupations obtained from our
dataset with a total of 1019 different occupations.
9Happy Sad Right
Wrong Afraid Brave
Smart Dumb Proud
Strong Polite Cruel
Desirable Loving Sympathetic
Modest Successful Guilty
Innocent Mature Shy
Table 5: Curated list of 21 adjectives obtained from the top one thousand most frequent
words in this category in the Corpus of Contemporary American English (COCA)
https://corpus.byu.edu/coca/.
4.1 Rationale for language exceptions
While it is possible to construct gender neutral sentences in two of the languages omitted in
our experiments (namely Korean and Nepali), we have chosen to omit them for the following
reasons:
1. We faced technical difficulties to form templates and automatically translate sentences
with the right-to-left, top-to-bottom nature of the script and, as such, we have decided
not to include it in our experiments.
2. Due to Nepali having a rather complex grammar, with possible male/female gender
demarcations on the phrases and due to none of the authors being fluent or able to
reach someone fluent in the language, we were not confident enough in our ability
to produce the required templates. Bengali was almost discarded under the same
rationale, but we have decided to keep it because of our sentence template for Bengali
has a simple grammatical structure which does not require any kind of inflection.
3. One can construct gender neutral phrases in Korean by omitting the gender pronoun;
in fact, this is the default procedure. However, the expressiveness of this omission
depends on the context of the sentence being clear, which is not possible in the way
we frame phrases.
5. Distribution of translated gender pronouns per occupation category
A sensible way to group translation data is to coalesce occupations in the same category
and collect statistics among languages about how prominent male defaults are in each field.
What we have found is that Google Translate does indeed translate sentences with male
pronouns with greater probability than it does either with female or gender-neutral pro-
nouns, in general. Furthermore, this bias is seemingly aggravated for fields suggested to
be troubled by male stereotypes, such as life and physical sciences, architecture, engineer-
ing, computer science and mathematics (Moss-Racusin, Molenda, & Cramer, 2015). Table
6 summarizes these data, and Table 7 summarizes it even further by coalescing occupa-
tion categories into broader groups to ease interpretation. For instance, STEM (Science,
Technology, Engineering and Mathematics) fields are grouped into a single category, which
10helps us compare the large asymmetry between gender pronouns in these fields (72% of
male defaults) to that of more evenly distributed fields such as healthcare (50%).
Category Female (%) Male (%) Neutral (%)
Office and administrative support 11.015 58.812 16.954
Architecture and engineering 2.299 72.701 10.92
Farming, fishing, and forestry 12.179 62.179 14.744
Management 11.232 66.667 12.681
Community and social service 20.238 62.5 10.119
Healthcare support 25.0 43.75 17.188
Sales and related 8.929 62.202 16.964
Installation, maintenance, and repair 5.22 58.333 17.125
Transportation and material moving 8.81 62.976 17.5
Legal 11.905 72.619 10.714
Business and financial operations 7.065 67.935 15.58
Life, physical, and social science 5.882 73.284 10.049
Arts, design, entertainment, sports, and media 10.36 67.342 11.486
Education, training, and library 23.485 53.03 9.091
Building and grounds cleaning and maintenance 12.5 68.333 11.667
Personal care and service 18.939 49.747 18.434
Healthcare practitioners and technical 22.674 51.744 15.116
Production 14.331 51.199 18.245
Computer and mathematical 4.167 66.146 14.062
Construction and extraction 8.578 61.887 17.525
Protective service 8.631 65.179 12.5
Food preparation and serving related 21.078 58.333 17.647
Total 11.76 58.93 15.939
Table 6: Percentage of female, male and neutral gender pronouns obtained for each BLS
occupation category, averaged over all occupations in said category and tested
languages detailed in Table
1. Note that rows do not in general add up to 100%, as there is a fair amount of translated
sentences for which we cannot obtain a gender pronoun.
11Category Female (%) Male (%) Neutral (%)
Service 10.5 59.548 16.476
STEM 4.219 71.624 11.181
Farming / Fishing / Forestry 12.179 62.179 14.744
Corporate 9.167 66.042 14.861
Healthcare 23.305 49.576 15.537
Legal 11.905 72.619 10.714
Arts / Entertainment 10.36 67.342 11.486
Education 23.485 53.03 9.091
Production 14.331 51.199 18.245
Construction / Extraction 8.578 61.887 17.525
Total 11.76 58.93 15.939
Table 7: Percentage of female, male and neutral gender pronouns obtained for each of the
merged occupation category, averaged over all occupations in said category and
tested languages detailed in Table
1. Note that rows do not in general add up to 100%, as there is a fair amount of translated
sentences for which we cannot obtain a gender pronoun.
Plotting histograms for the number of gender pronouns per occupation category sheds
further light on how female, male and gender-neutral pronouns are differently distributed.
The histogram in Figure 2 suggests that the number of female pronouns is inversely dis-
tributed – which is mirrored in the data for gender-neutral pronouns in Figure 4 –, while
the same data for male pronouns (shown in Figure 3) suggests a skew normal distribution.
Furthermore we can see both on Figures 2 and 3 how STEM fields (labeled in beige exhibit
predominantly male defaults – amounting predominantly near X = 0 in the female his-
togram although much to the right in the male histogram.
These values contrast with BLS’ report of gender participation, which will be discussed
in more detail in Section 8.
12800
Category
Service
600 STEM
Farming
Fishing
Forestry
Occupations
Corporate
400 Healthcare
Legal
Arts
Entertainment
200 Education
Production
Construction
Extraction
0
0 2 4 6 8 10 12
# Translated Female Pronouns (grouped among languages)
Figure 2: The data for the number of translated female pronouns per merged occupation
category totaled among languages suggests and inverse distribution. STEM fields
are nearly exclusively concentrated at X = 0, while more evenly distributed in
fields such as production and healthcare (See Table
7) extends to higher values.
250
Category
Service
200
STEM
Farming
Fishing
Forestry
150
Occupations
Corporate
Healthcare
Legal
100
Arts
Entertainment
Education
50
Production
Construction
Extraction
0
5 10
# Translated Male Pronouns (grouped among languages)
Figure 3: In contrast to Figure
2 male pronouns are seemingly skew normally distributed, with a peak at X = 6. One can
see how STEM fields concentrate mainly to the right (X ≥ 6).
13500
Category
Service
400
STEM
Farming
Fishing
Forestry
300
Occupations
Corporate
Healthcare
Legal
200
Arts
Entertainment
Education
100
Production
Construction
Extraction
0
0 2 4 6 8 10 12
# Translated Neutral Pronouns (grouped among languages)
Figure 4: The scarcity of gender-neutral pronouns is manifest in their histogram. Once
again, STEM fields are predominantly concentrated at X = 0.
We can also visualize male, female, and gender neutral histograms side by side, in
which context is useful to compare the dissimilar distributions of translated STEM and
Healthcare occupations (Figures 5 and 6 respectively). The number of translated female
pronouns among languages is not normally distributed for any of the individual categories
in Table 2, but Healthcare is in many ways the most balanced category, which can be seen
in comparison with STEM – in which male defaults are second to most prominent.
1480
60
Occupations
Gender
Female
40
Male
Neutral
20
0
0 2 4 6 8 10 12
# Translated Pronouns (grouped among languages)
Figure 5: Histograms for the distribution of the number of translated female, male and
gender neutral pronouns totaled among languages are plotted side by side for job
occupations in the STEM (Science, Technology, Engineering and Mathematics)
field, in which male defaults are the second-to-most prominent (after Legal).
30
20
Occupations
Gender
Female
Male
Neutral
10
0
0 2 4 6 8 10 12
# Translated Pronouns (grouped among languages)
Figure 6: Histograms for the distribution of the number of translated female, male and
gender neutral pronouns totaled among languages are plotted side by side for job
occupations in the Healthcare field, in which male defaults are least prominent.
15The bar plots in Figure 7 help us visualize how much of the distribution of each occu-
pation category is composed of female, male and gender-neutral pronouns. In this context,
STEM fields, which show a predominance of male defaults, are contrasted with Healthcare
and educations, which show a larger proportion of female pronouns.
100
Gender
Neutral
% 50
Female
Male
0
Corporate
STEM
Education
Healthcare
Service
Production
Legal
Entertainment
Forestry
Construction
Farming
Fishing
Extraction
Arts
Category
Figure 7: Bar plots show how much of the distribution of translated gender pronouns for
each occupation category (grouped as in Table 7) is composed of female, male and
neutral terms. Legal and STEM fields exhibit a predominance of male defaults
and contrast with Healthcare and Education, with a larger proportion of female
and neutral pronouns. Note that in general the bars do not add up to 100%, as
there is a fair amount of translated sentences for which we cannot obtain a gender
pronoun. Categories are sorted with respect to the proportions of male, female
and neutral translated pronouns respectively
.
Although computing our statistics over the set of all languages has practical value,
this may erase subtleties characteristic to each individual idiom. In this context, it is also
important to visualize how each language translates job occupations in each category. The
heatmaps in Figures 8, 9 and 10 show the translation probabilities into female, male and
neutral pronouns, respectively, for each pair of language and category (blue is 0% and red
is 100%). Both axes are sorted in these Figures, which helps us visualize both languages
and categories in an spectrum of increasing male/female/neutral translation tendencies. In
16agreement with suggested stereotypes, (Moss-Racusin et al., 2015) STEM fields are second
only to Legal ones in the prominence of male defaults. These two are followed by Arts &
Entertainment and Corporate, in this order, while Healthcare, Production and Education
lie on the opposite end of the spectrum.
Japanese
Basque
Yoruba
Turkish
Malay Probability
Language
80
Chinese
60
Armenian
40
Swahili
20
Estonian 0
Bengali
Hungarian
Finnish
Corporate
STEM
Education
Healthcare
Service
Production
Legal
Entertainment
Forestry
Construction
Farming
Fishing
Extraction
Arts
Category
Figure 8: Heatmap for the translation probability into female pronouns for each pair of
language and occupation category. Probabilities range from 0% (blue) to 100%
(red), and both axes are sorted in such a way that higher probabilities concentrate
on the bottom right corner.
17Basque
Bengali
Yoruba
Finnish
Hungarian
Language Probability
Chinese
100
Japanese
50
Turkish
0
Estonian
Swahili
Armenian
Malay
Corporate
STEM
Education
Healthcare
Service
Production
Legal
Entertainment
Forestry
Construction
Farming
Fishing
Extraction
Arts
Category
Figure 9: Heatmap for the translation probability into male pronouns for each pair of lan-
guage and occupation category. Probabilities range from 0% (blue) to 100% (red),
and both axes are sorted in such a way that higher probabilities concentrate on
the bottom right corner.
18Malay
Finnish
Hungarian
Swahili
Estonian
Language Probability
Armenian
100
Turkish
50
Japanese
0
Chinese
Bengali
Yoruba
Basque
Corporate
STEM
Education
Healthcare
Service
Production
Legal
Entertainment
Forestry
Construction
Farming
Fishing
Extraction
Arts
Category
Figure 10: Heatmap for the translation probability into gender neutral pronouns for each
pair of language and occupation category. Probabilities range from 0% (blue)
to 100% (red), and both axes are sorted in such a way that higher probabilities
concentrate on the bottom right corner.
Our analysis is not truly complete without tests for statistical significant differences
in the translation tendencies among female, male and gender neutral pronouns. We want
to know for which languages and categories does Google Translate translate sentences with
significantly more male than female, or male than neutral, or neutral than female, pronouns.
We ran one-sided t-tests to assess this question for each pair of language and category and
also totaled among either languages or categories. The corresponding p-values are presented
in Tables 8, 9, 10 respectively. Language-Category pairs for which the null hypothesis was
not rejected for a confidence level of α = .005 are highlighted in blue. It is important
to note that when the null hypothesis is accepted, we cannot discard the possibility of
the complementary null hypothesis being rejected. For example, neither male nor female
pronouns are significantly more common for Healthcare positions in the Estonian language,
but female pronouns are significantly more common for the same category in Finnish and
Hungarian. Because of this, Language-Category pairs for which the complementary null
hypothesis is rejected are painted in a darker shade of blue (see Table 8 for the three
examples cited above.
Although there is a noticeable level of variation among languages and categories, the
null hypothesis that male pronouns are not significantly more frequent than female ones was
19consistently rejected for all languages and all categories examined. The same is true for the
null hypothesis that male pronouns are not significantly more frequent than gender neutral
pronouns, with the one exception of the Basque language (which exhibits a rather strong
tendency towards neutral pronouns). The null hypothesis that neutral pronouns are not
significantly more frequent than female ones is accepted with much more frequency, namely
for the languages Malay, Estonian, Finnish, Hungarian, Armenian and for the categories
Farming & Fishing & Forestry, Healthcare, Legal, Arts & Entertainment, Education. In
all three cases, the null hypothesis corresponding to the aggregate for all languages and
categories is rejected. We can learn from this, in summary, that Google Translate translates
male pronouns more frequently than both female and gender neutral ones, either in general
for Language-Category pairs or consistently among languages and among categories (with
the notable exception of the Basque idiom).
Mal. Est. Fin. Hun. Arm. Ben. Jap. Tur. Yor. Bas. Swa. Chi. Total
ServiceMal. Est. Fin. Hun. Arm. Ben. Jap. Tur. Yor. Bas. Swa. Chi. Total
Service < α < α < α < α < α < α < α < α < α 1.0 < α < α < α
STEM < α < α < α < α < α < α < α < α < α .984 < α .07 < α
Farming
FishingMal. Est. Fin. Hun. Arm. Ben. Jap. Tur. Yor. Bas. Swa. Chi. Total
Service 1.0 1.0 1.0 1.0 .981 < α < α < α < α < α 1.0 < α < α
STEM .84 .978 .998 .993 .84 < α < α .079 < α < α .84 < α < α
Farming
Fishing ∗ ∗ .999 1.0 ∗ .167 .169 .292 < α < α ∗ .083 .147
Forestry
Corporate ∗ 1.0 1.0 1.0 .996 < α < α < α < α < α .977 < α < α
Healthcare 1.0 1.0 1.0 1.0 1.0 .086 < α .87 < α < α 1.0 < α .977
Legal ∗ .961 .985 .961 ∗ < α .086 ∗ .178 < α ∗ ∗ .072
Arts Enter-
.92 .994 .999 .998 .998 .067 < α < α < α < α .92 .162 .097
tainment
Education ∗ 1.0 .999 .999 1.0 .058 < α 1.0 .164 .052 .995 .052 .992
Production .996 1.0 1.0 1.0 1.0 .113 < α < α < α < α 1.0 < α < α
Construction
.84 .996 1.0 1.0 ∗ < α < α < α < α < α 1.0 < α < α
Extraction
Total 1.0 1.0 1.0 1.0 1.0 < α < α < α < α < α 1.0 < α < α
Table 10: Computed p-values relative to the null hypothesis that the number of translated
gender neutral pronouns is not significantly greater than that of female pronouns,
organized for each language and each occupation category. Cells corresponding to
the acceptance of the null hypothesis are marked in blue, and within those cells,
those corresponding to cases in which the complementary null hypothesis (that
the number of female pronouns is not significantly greater than that of gender
neutral pronouns) was rejected are marked with a darker shade of the same color.
A significance level of α = .05 was adopted. Asterisks indicate cases in which all
pronouns are translated with gender neutral pronouns.
6. Distribution of translated gender pronouns per language
We have taken the care of experimenting with a fair amount of different gender neutral
languages. Because of that, another sensible way of coalescing our data is by language
groups, as shown in Table 11. This can help us visualize the effect of different cultures
in the genesis – or lack thereof – of gender bias. Nevertheless, the barplots in Figure 11
are perhaps most useful to identifying the difficulty of extracting a gender pronoun when
translating from certain languages. Basque is a good example of this difficulty, although
the quality of Bengali, Yoruba, Chinese and Turkish translations are also compromised.
22Language Female (%) Male (%) Neutral (%)
Malay 3.827 88.420 0.000
Estonian 17.370 72.228 0.491
Finnish 34.446 56.624 0.000
Hungarian 34.347 58.292 0.000
Armenian 10.010 82.041 0.687
Bengali 16.765 37.782 25.63
Japanese 0.000 66.928 24.436
Turkish 2.748 62.807 18.744
Yoruba 1.178 48.184 38.371
Basque 0.393 5.496 58.587
Swahili 14.033 76.644 0.000
Chinese 5.986 51.717 24.338
Table 11: Percentage of female, male and neutral gender pronouns obtained for each lan-
guage, averaged over all occupations detailed in Table
1. Note that rows do not in general add up to 100%, as there is a fair amount of translated sentences
for which we cannot obtain a gender pronoun.
23100
Gender
Neutral
% 50
Female
Male
0
Chinese
Bengali
Finnish
Malay
Basque
Hungarian
Armenian
Estonian
Japanese
Swahili
Turkish
Yoruba
Language
Figure 11: The distribution of pronominal genders per language also suggests a tendency
towards male defaults, with female pronouns reaching as low as 0.196% and
1.865% for Japanese and Chinese respectively. Once again not all bars add up
to 100% , as there is a fair amount of translated sentences for which we cannot
obtain a gender pronoun, particularly in Basque. Among all tested languages,
Basque was the only one to yield more gender neutral than male pronouns,
with Bengali and Yoruba following after in this order. Languages are sorted
with respect to the proportions of male, female and neutral translated pronouns
respectively.
7. Distribution of translated gender pronouns for varied adjectives
We queried the 1000 most frequently used adjectives in English, as classified in the COCA
corpus [https://corpus.byu.edu/coca/], but since not all of them were readily applicable to
the sentence template we used, we filtered the N adjectives that would fit the templates and
made sense for describing a human being. The list of adjectives extracted from the corpus
is available on the Github repository: https://github.com/marceloprates/Gender-Bias.
Apart from occupations, which we have exhaustively examined by collecting labor data
from the U.S. Bureau of Labor Statistics, we have also selected a small subset of adjectives
from the Corpus of Contemporary American English (COCA) https://corpus.byu.edu/coca/,
in an attempt to provide preliminary evidence that the phenomenon of gender bias may
extend beyond the professional context examined in this paper. Because a large number of
24adjectives are not applicable to human subjects, we manually curated a reasonable subset
of such words. The template used for adjectives is similar to that used for occupations, and
is provided again for reference in Table 3.
Once again the data points towards male defaults, but some variation can be observed
throughout different adjectives. Sentences containing the words Shy, Attractive, Happy,
Kind and Ashamed are predominantly female translated (Attractive is translated as female
and gender-neutral in equal parts), while Arrogant, Cruel and Guilty are disproportionately
translated with male pronouns (Guilty is in fact never translated with female or neutral
pronouns).
Adjective Female (%) Male (%) Neutral (%)
Happy 36.364 27.273 18.182
Sad 18.182 36.364 18.182
Right 0.000 63.636 27.273
Wrong 0.000 54.545 36.364
Afraid 9.091 54.545 0.000
Brave 9.091 63.636 18.182
Smart 18.182 45.455 18.182
Dumb 18.182 36.364 18.182
Proud 9.091 72.727 9.091
Strong 9.091 54.545 18.182
Polite 18.182 45.455 18.182
Cruel 9.091 63.636 18.182
Desirable 9.091 36.364 45.455
Loving 18.182 45.455 27.273
Sympathetic 18.182 45.455 18.182
Modest 18.182 45.455 27.273
Successful 9.091 54.545 27.273
Guilty 0.000 72.727 0.000
Innocent 9.091 54.545 9.091
Mature 36.364 36.364 9.091
Shy 36.364 27.273 27.273
Total 30.3 98.1 41.7
Table 12: Number of female, male and neutral pronominal genders in the translated sen-
tences for each selected adjective.
25100
Gender
Neutral
% 50
Female
Male
0
Polite
Innocent
Shy
Desirable
Proud
Happy
Wrong
Guilty
Afraid
Sympathetic
Strong
Brave
Loving
Successful
Smart
Dumb
Modest
Cruel
Sad
Right
Mature
Adjective
Figure 12: The distribution of pronominal genders for each word in Table
5 shows how stereotypical gender roles can play a part on the automatic translation of
simple adjectives. One can see that adjectives such as Shy and Desirable, Sad and Dumb
amass at the female side of the spectrum, contrasting with Proud, Guilty, Cruel and Brave
which are almost exclusively translated with male pronouns.
8. Comparison with women participation data across job positions
A sensible objection to the conclusions we draw from our study is that the perceived gender
bias in Google Translate results stems from the fact that possibly female participation in
some job positions is itself low. We must account for the possibility that the statistics of
gender pronouns in Google Translate outputs merely reflects the demographics of male-
dominated fields (male-dominated fields can be considered those that have less than 25% of
women participation(of Labor, 2017), according to the U.S. Department of Labor Women’s
Bureau). In this context, the argument in favor of a critical revision of statistic translation
algorithms weakens considerably, and possibly shifts the blame away from these tools.
The U.S. Bureau of Labor Statistics data summarized in Table 2 contains statistics
about the percentage of women participation in each occupation category. This data is
also available for each individual occupation, which allows us to compute the frequency of
women participation for each 12-quantile. We carried the same computation in the context
of frequencies of translated female pronouns, and the resulting histograms are plotted side-
by-side in Figure 13. The data shows us that Google Translate outputs fail to follow the
real-world distribution of female workers across a comprehensive set of job positions. The
26distribution of translated female pronouns is consistently inversely distributed, with female
pronouns accumulating in the first 12-quantile. By contrast, BLS data shows that female
participation peaks in the fourth 12-quantile and remains significant throughout the next
ones.
Data
Google Translate Female %
BLS Female Participation %
40
30
Frequency (%)
20
10
0
1 2 3 4 5 6 7 8 9 10 11 12
12-quantile
Figure 13: Women participation (%) data obtained from the U.S. Bureau of Labor Statistics
allows us to assess whether the Google Translate bias towards male defaults is
at least to some extent explained by small frequencies of female workers in some
job positions. Our data does not make a very good case for that hypothesis:
the total frequency of translated female pronouns (in blue) for each 12-quantile
does not seem to respond to the higher proportion of female workers (in yellow)
in the last quantiles.
Averaged over occupations and languages, sentences are translated with female pronouns
11.76% of the time. In contrast, the gender participation frequency for female workers
averaged over all occupations in the BLS report yields a consistently larger figure of 35.94%.
The variance reported for the translation results is also lower, at ≈ 0.028 in contrast with the
report’s ≈ 0.067. We ran an one-sided t-test to evaluate the null hypothesis that the female
participation frequency is not significantly greater then the GT female pronoun frequency for
the same job positions, obtaining a p-value p ≈ 6.210−94 vastly inferior to our confidence
level of α = 0.005 and thus rejecting H0 and concluding that Google Translate’s female
translation frequencies sub-estimates female participation frequencies in US job positions.
27As a result, it is not possible to understand this asymmetry as a reflection of workplace
demographics, and the prominence of male defaults in Google Translate is, we believe, yet
lacking a clear justification.
9. Conclusions
In this paper, we have provided preliminary evidence that statistical translation tools such
as Google Translate can exhibit gender biases and a strong tendency towards male defaults.
Although implicit, these biases possibly stem from the real world data which is used to train
them, and in this context possibly provide a window into the way our society talks (and
writes) about women in the workplace. In this paper, we suggest that and test the hypothesis
that statistical translation tools can be probed to yield insights about stereotypical gender
roles in our society – or at least in their training data. By translating professional-related
sentences such as “He/She is an engineer” from gender neutral languages such as Hungarian
and Chinese into English, we were able to collect statistics about the asymmetry between
female and male pronominal genders in the translation outputs. Our results show that male
defaults are not only prominent but exaggerated in fields suggested to be troubled with
gender stereotypes, such as STEM (Science, Technology, Engineering and Mathematics)
jobs. And because Google Translate typically uses English as a lingua franca to translate
between other languages (e.g. Chinese → English → Portuguese) (Google, 2017; Boitet,
Blanchon, Seligman, & Bellynck, 2010), our findings possibly extend to translations between
gender neutral languages and non-gender neutral languages (apart from English) in general,
although we have not tested this hypothesis.
Although not conclusive, our results seem to suggest that this phenomenon extends
beyond the scope of the workplace, with the proportion of female pronouns varying sig-
nificantly according to adjectives used to describe a person. Adjectives such as Shy and
Desirable are translated with a larger proportion of female pronouns, while Guilty and Cruel
are almost exclusively translated with male ones. Different languages also seemingly have a
significant impact in machine gender bias, with Hungarian exhibiting a better equilibrium
between male and female pronouns than for example Chinese. Some languages such as
Yoruba and Basque were found to translate sentences with gender neutral pronouns very
often, although this is the exception rather than the rule and Basque also exhibits a high
frequency of phrases for which we could not automatically extract a gender pronoun.
To solidify our results, we ran our pronominal gender translation statistics against the
U.S. Bureau of Labor Statistics data on the frequency of women participation for each
job position. Although Google Translate exhibits male defaults, this phenomenon may
merely reflect the unequal distribution of male and female workers in some job positions.
To test this hypothesis, we compared the distribution of female workers with the frequency
of female translations, finding no correlation between said variables. Our data shows that
Google Translate outputs fail to reflect the real-world distribution of female workers, under-
estimating the expected frequency. That is to say that even if we do not expect a 50:50
distribution of translated gender pronouns, Google Translate exhibits male defaults in a
greater frequency that job occupation data alone would suggest. The prominence of male
defaults in Google Translate is therefore to the best of our knowledge yet lacking a clear
justification.
28We think this work shed new light on a pressing ethical difficulty arising from modern
statistical machine translation, and hope that it will lead to discussions about the role of
AI engineers on minimizing potential harmful effects of the current concerns about machine
bias. We are optimistic that unbiased results can be obtained with relatively little effort and
marginal cost to the performance of current methods, to which current debiasing algorithms
in the scientific literature are a testament.
10. Acknowledgments
This study was financed in part by the Coordenação de Aperfeiçoamento de Pessoal de
Nı́vel Superior - Brasil (CAPES) - Finance Code 001 and the Conselho Nacional de Desen-
volvimento Cientı́fico e Tecnológico (CNPq).
References
Angwin, J., Larson, J., Mattu, S., & Kirchner, L. (2016). Machine bias: There’s software
used across the country to predict future criminals and it’s biased against blacks..
Last visited 2017-12-17.
Bahdanau, D., Cho, K., & Bengio, Y. (2014). Neural machine translation by jointly learning
to align and translate. CoRR, abs/1409.0473.
Boitet, C., Blanchon, H., Seligman, M., & Bellynck, V. (2010). Mt on and for the web. In
Natural Language Processing and Knowledge Engineering (NLP-KE), 2010 Interna-
tional Conference on, pp. 1–10. IEEE.
Bolukbasi, T., Chang, K.-W., Zou, J. Y., Saligrama, V., & Kalai, A. T. (2016). Man is to
computer programmer as woman is to homemaker? debiasing word embeddings. In
Advances in Neural Information Processing Systems, pp. 4349–4357.
Boroditsky, L., Schmidt, L. A., & Phillips, W. (2003). Sex, syntax, and semantics. Language
in mind: Advances in the study of language and thought, 61–79.
Bureau of Labor Statistics (2017). ”table 11: Employed persons by detailed occupation, sex,
race, and hispanic or latino ethnicity, 2017”. Labor force statistics from the current
population survey, United States Department of Labor.
Carl, M., & Way, A. (2003). Recent advances in example-based machine translation, Vol. 21.
Springer Science & Business Media.
Chomsky, N. (2011). The golden age: A look at the original roots of artificial intelligence,
cognitive science, and neuroscience (partial transcript of an interview with N. Chom-
sky at MIT150 Symposia: Brains, minds and machines symposium.. Last visited
2017-12-26.
Dascal, M. (1982). Universal language schemes in England and France, 1600-1800 comments
on James Knowlson. Studia leibnitiana, 14 (1), 98–109.
Dryer, M. S., & Haspelmath, M. (Eds.). (2013). WALS Online. Max Planck Institute for
Evolutionary Anthropology, Leipzig.
Firat, O., Cho, K., Sankaran, B., Yarman-Vural, F. T., & Bengio, Y. (2017). Multi-way,
multilingual neural machine translation. Computer Speech & Language, 45, 236–252.
29Garcia, M. (2016). Racist in the machine: The disturbing implications of algorithmic bias.
World Policy Journal, 33 (4), 111–117.
Google (2017). Language support for the neural machine translation model.. Last visited
2018-3-19.
Gordin, M. D. (2015). Scientific Babel: How science was done before and after global English.
University of Chicago Press.
Hajian, S., Bonchi, F., & Castillo, C. (2016). Algorithmic bias: From discrimination discov-
ery to fairness-aware data mining. In Proceedings of the 22nd ACM SIGKDD inter-
national conference on knowledge discovery and data mining, pp. 2125–2126. ACM.
Hutchins, W. J. (1986). Machine translation: past, present, future. Ellis Horwood Chich-
ester.
Johnson, M., Schuster, M., Le, Q. V., Krikun, M., Wu, Y., Chen, Z., Thorat, N., Viégas,
F. B., Wattenberg, M., Corrado, G., Hughes, M., & Dean, J. (2017). Google’s multi-
lingual neural machine translation system: Enabling zero-shot translation. TACL, 5,
339–351.
Kay, P., & Kempton, W. (1984). What is the sapir-whorf hypothesis?. American anthro-
pologist, 86 (1), 65–79.
Kelman, S. (2014). Translate community: Help us improve google translate!.. Last visited
2018-3-12.
Kirkpatrick, K. (2016). Battling algorithmic bias: how do we ensure algorithms treat us
fairly?. Communications of the ACM, 59 (10), 16–17.
Koehn, P. (2009). Statistical machine translation. Cambridge University Press.
Koehn, P., Hoang, H., Birch, A., Callison-Burch, C., Federico, M., Bertoldi, N., Cowan,
B., Shen, W., Moran, C., Zens, R., Dyer, C., Bojar, O., Constantin, A., & Herbst,
E. (2007). Moses: Open source toolkit for statistical machine translation. In ACL
2007, Proceedings of the 45th Annual Meeting of the Association for Computational
Linguistics, June 23-30, 2007, Prague, Czech Republic.
Locke, W. N., & Booth, A. D. (1955). Machine translation of languages: fourteen essays.
Published jointly by Technology Press of the Massachusetts Institute of Technology
and Wiley, New York.
Mills, K.-A. (2017). ’Racist’ soap dispenser refuses to help dark-skinned man wash his hands
- but Twitter blames ’technology’.. Last visited 2017-12-17.
Moss-Racusin, C. A., Molenda, A. K., & Cramer, C. R. (2015). Can evidence impact
attitudes? public reactions to evidence of gender bias in stem fields. Psychology of
Women Quarterly, 39 (2), 194–209.
Norvig, P. (2017). On Chomsky and the two cultures of statistical learning.. Last visited
2017-12-17.
of Labor, W. B. U. S. D. (2017). Traditional and nontraditional occupations.. Last visited
2018-05-30.
30Olson, P. (2018). The algorithm that helped google translate become sexist.. Last visited
2018-3-12.
Papenfuss, M. (2017). Woman in China says colleague’s face was able to unlock her iPhone
X.. Last visited 2017-12-17.
Santacreu-Vasut, E., Shoham, A., & Gay, V. (2013). Do female/male distinctions in language
matter? evidence from gender political quotas. Applied Economics Letters, 20 (5),
495–498.
Schiebinger, L. (2014). Scientific research must take gender into account. Nature, 507 (7490),
9.
Shankland, S. (2017). Google translate now serves 200 million people daily.. Last visited
2018-3-12.
Thompson, A. J. (2014). Linguistic relativity: can gendered languages predict sexist atti-
tudes. Linguistics.
Wang, Y., & Kosinski, M. (2017). Deep neural networks are more accurate than humans
at detecting sexual orientation from facial images..
Weaver, W. (1955). Translation. In Locke, W. N., & Booth, A. D. (Eds.), Machine transla-
tion of languages, Vol. 14, pp. 15–23. Cambridge: Technology Press, MIT. Last visited
2017-12-17.
31You can also read