BROKEN PLATE THE - Ten vital signs documenting the health of our food system, how it impacts on our lives, and why we must change the food ...

Page created by Gerald Delgado
 
CONTINUE READING
BROKEN PLATE THE - Ten vital signs documenting the health of our food system, how it impacts on our lives, and why we must change the food ...
THE
        BROKEN
        PLATE
        2020
        The State of the
        Nation’s Food System

Ten vital signs documenting the health of our
food system, how it impacts on our lives, and
why we must change the food environment
BROKEN PLATE THE - Ten vital signs documenting the health of our food system, how it impacts on our lives, and why we must change the food ...
CONTRIBUTORS
A massive thank you to all of our contributors, without whom Broken Plate would not be possible
                                                                                                                  FOREWORD
                                                                                                                  BY LAURA SANDYS CBE, CHAIR OF THE FOOD FOUNDATION

                                                                                                  When I founded the Food Foundation five years ago, our           economic recession should ring alarm bells. At the Food
                                                                                                  main objective was to challenge the UK food system to            Foundation we will be examining the on-going impacts
                                                                                                  deliver accessible, fair, sustainable and healthy outcomes       very carefully and focusing on the measures that are
                                                                                                  - particularly for the lowest income families. The current –     needed from government and business to replace sticky
                                                                                                  but ongoing - impact of COVID-19 on the food system and          tape with systemic changes to address inequalities.
                                                                                                  society have further exacerbated and shone a spotlight on
                                                                                                  those issues that were already deeply concerning to us five      In addition to inequalities and food insecurity, the
                                                                                                  years ago. Our original objectives are now more important        pandemic has also further highlighted the significant
                                                                                                  than ever.                                                       health impact of poor diets. Diet is currently the biggest
                                                                                                                                                                   risk factor for disease in England, accounting for 10.8%
                                                                                                  With the current climate conducive to change, and with           of the total disease burden4. There is also an emerging
                                                                                                  many keen to use this moment to push for a better way            association between the risk of more severe outcomes
                                                                                                  of doing things, now is an opportune moment to innovate          from COVID-19 and nutrition-related chronic diseases.
                                                                                                  and legislate for better health in the UK. We at the Food        Diabetes is mentioned on 21% of COVID-19 death
                                                                                                  Foundation believe that we need to address both the              certificates, and 7.7% of patients critically ill in intensive
                                                                                                  health implications of the food system and the growing           care units with confirmed COVID-19 were categorised
                                                                                                  food insecurity that many of our fellow citizens face day in     as morbidly obese compared to 2.9% of the general
                                                                                                  and day out. Broken Plate is our flagship report and aims to     population3. We need now to focus on the role of diet and
                                                                                                  inform the change that is needed to reverse the human and        shape the food system around citizens’ health, which would
                                                                                                  environmental impacts of a damaging food environment. We         at a low cost have a significant impact on wider pressures
                                                                                                  hope Broken Plate shows exactly why we must change the           across our health system.
                             THANK YOU                                                            food system if we are to improve the nation’s health.
                                                                                                                                                                   So what does the future hold for the UK food system?
                                                                                                  Although much is often made of individual choice when it         COVID-19 has brought to the fore a number of long-
         Huge thanks to Dr Jean Adams, Dr Kate Ellis, Nye Cominetti, Elena Salazar,               comes to food, governments and businesses continue to            standing issues that impact on the health of our nation.
     Dr Thomas Burgoine, Debbie Bremner, Sonia Pombo, Zoe Davies, Caroline Hancock,               shape and edit our food environments, with our ‘choices’ often   The recent launch of the government's obesity strategy
         Dr Carmelia Alae-Carew, and Ben Dare for their support and expert analysis.
                                                                                                  influenced by incomes, prices, promotions, advertising and       was a promising and bold step in terms of reconfiguring
       With special thanks to Tim Lobstein for his input and advice on this year’s report.        what is easily available. I believe the apparent freedom we      our food environment, and framed very much around the
                                                                                                  have to choose between healthy and unhealthy food is a myth      link between COVID-19 and diet-related disease. Yet much
                                                                                                  and we must move to create opportunity for genuine choices.      more remains to be done. The strategy made no mention
                                                                                                  It was interesting for example to observe how a number of        of the widening health inequalities we see across the UK,
                                                                                                  corporations continued to promote and advertise foods high       nor the association between poverty, hunger, and obesity.
                                                                                                  in fat, salt and sugar during the pandemic, with many playing    While part one of the National Food Strategy (NFS) did
                                                                                                  on notions of nostalgia and comfort to appeal to citizens1.      focus on recommendations to reduce food insecurity in
                                                                                                                                                                   light of COVID-19, we need urgent action, and it remains to
                                                                                                  Although COVID-19 has been a collective experience,              be seen how and when the NFS recommendations will be
                                                                                                  its impact has not been felt equally, with the pandemic          implemented.
                                                                                                  highlighting pre-existing health, socio-economic, and ethnic
                                                                                                  and racial inequalities. Since lockdown measures came            Yet with the pandemic having near enough entirely halted
                     FOOD FOUNDATION CONTRIBUTORS                                                 into force on March 23rd, millions of households (many           ‘business as normal’, this is perhaps a once-in-a-lifetime
                                                                                                  with children) have experienced food insecurity - a 250%         opportunity for change. COVID-19 has led to an increased
          Rebecca Tobi • Shona Goudie • Anna Taylor • Jo Ralling • Pandora Haydon                 increase on pre-pandemic levels as of May 20202. With the        awareness of health, highlighted the role of nutrition in
                                                                                                  socio-economic determinants of health playing a major part       supporting the immune system, and made many of us think
                                                                                                  in individuals’ risk of chronic disease and obesity, the fact    more about where our food comes from - igniting calls to
                                                                                                  that those in the most deprived areas of the UK were twice       ‘build back better’. Now is the time to act if we are to revamp
                                                                                                  as likely to die from COVID-19 as those in the least deprived    our food system so that it delivers for the next generation.
                                                                                                  areas should be a stark warning that social and economic
                        WITH THANKS TO OUR FUNDERS                                                inequalities have a very real impact on health outcomes3.

                                                                                                  In the short-term, COVID-19 will most likely continue to
                                                                                                  exacerbate food insecurity. The likelihood of an imminent        Laura Sandys, CBE

                                                                                                                                                                                                  THE BROKEN PLATE 2020 | Food Foundation   3
BROKEN PLATE THE - Ten vital signs documenting the health of our food system, how it impacts on our lives, and why we must change the food ...
What's the future
              for children born                                                               HEALTHIER FOOD THE
                                                                                      EASIEST OPTION FOR EVERYONE
             in 2020 if nothing
                  changes?
                   ● OVERWEIGHT ● OBESITY                                                                                       This year's report shows the following changes compared to Broken Plate 2019
                                                                                                                                ● IMPROVEMENT ● NO CHANGE ● DETERIORATED
                     AT AGE 5/RECEPTION:
                     FORECAST 2025
                                             = 13%
                                   = 9%

                     AT AGE 11/YEAR 6:
                     FORECAST 2031
                                             = 13%

                   = 22%
                                                                  Our recommendations and focus areas
                                                                    for a healthier food environment

                     AT AGE 21:
                     FORECAST 2041                                              ADDRESS THE CURRENT
                                                                                IMBALANCE IN ADVERTISING
                 = 21%
                                                                ● METRIC 1: ADVERTISING. Advertise healthier foods
                          = 25%                                 and restrict advertising of foods high in fat, sugar and salt

                                                                                                                                                                                                ACT SO THAT EVERYONE
                                                                                                                                                                                                  HAS A CHANCE OF A
                     AT AGE 65:                                                           ● METRIC 3: THE                                                                                       LONGER, HEALTHIER LIFE
                     FORECAST 2085                                                                                                                     ● METRIC 2: PLACES TO BUY FOOD.
                                                                                          AFFORDABILITY OF
                                                                                                                                                       Reduce the availability of fast food     ● METRIC 8: CHILDHOOD OBESITY.
                                                                                          HEALTHY DIET. Ensure
                                                                            £                                                                          outlets                                  Reduce the health inequalities between
                                                                                          that everyone can afford a
                   = 22%                                                                                                                                                                        the most and least deprived areas
                                                                                          healthy diet                                                 ● METRIC 6: PRODUCTS WITH TOO
                                                                   MAKE                                                               MAKE             MUCH SUGAR. Reduce the amount of         ● METRIC 9: CHILD GROWTH. Ensure
                                                                 HEALTHIER                ● METRIC 4: WAGES. Pay                   HEALTHIER           sugar in children's cereals
                                                                                          people a fair wage                                                                                    all children have access to a nutritious diet
                                                      = 57%       OPTIONS                                                         OPTIONS MORE         ● METRIC 7: PRODUCTS WITH TOO
                                                                   MORE                   ● METRIC 5: FOOD PRICES.                 ACCESSIBLE                                                   ● METRIC 10: DIABETES. Change the
                                                                                                                                                       LITTLE VEG. Increase the amount of veg   food environment to support life-long
          Note: Overweight is defined as a Body Mass Index
                                                                AFFORDABLE                Make healthier foods more
                                                                                                                                                       in ready meals                           health
                                                                                          affordable
          (BMI) of 25 to 29.9 kg/m2, with obesity a BMI of 30
          kg/m2 and above.

4   Food Foundation | THE BROKEN PLATE 2020                                                                                                                                                              THE BROKEN PLATE 2020 | Food Foundation   5
BROKEN PLATE THE - Ten vital signs documenting the health of our food system, how it impacts on our lives, and why we must change the food ...
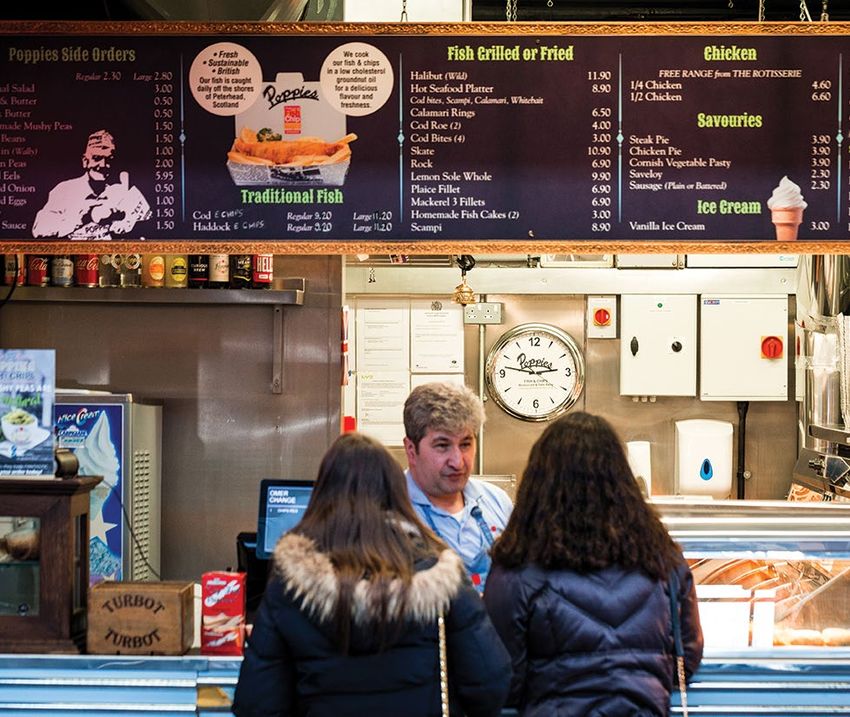
THEME       METRIC 1: ADVERTISING. Advertising and                      spend between healthy and less healthy foods.
                                                                                                     marketing mean that before we even decide
                                                                                      THE WORLD      what to eat, we’re influenced by mass media.                METRIC 2: PLACES TO BUY FOOD.
                                                                                      AROUND US      People are constantly confronted with advertising           We’re influenced by what’s available in
                                                                                                     for less healthy foods on social media, online and          our local area. Living in areas with lots of

          TEN METRICS
                                                                                                     on TV8. Evidence shows this has a direct impact             takeaway outlets is linked to the likelihood
                                                                                                     on how much we eat9. Campaigns like Veg Power               of being at a higher weight10. People are
                                                                                                     and ITV's Eat Them To Defeat Them campaign                  understandably more likely to eat food which
                                                                                                     have shown that advertising healthy foods can               is convenient and readily available, so we need
                                                                                                     have a positive effect on consumption. We need to           to ensure that healthy food is included in this.
                                                                                                     make it easier for people to make healthier choices         It’s not right that where people live affects
                                                                                                     by addressing the current imbalance in advertising          their level of access to healthier food.

          HEALTH OF THE                                                                  THEME       METRIC 3: AFFORDABILITY OF A              METRIC 4: WAGES. Perhaps ironically,

          UK’S FOOD SYSTEM
                                                                                          THE        HEALTHY DIET. When we decide what to buy, the people who work in the food industry
                                                                                                     we’re influenced by what we can afford. Many                 are typically on very low wages. One in
                                                                                     AFFORDABILITY   people in the UK have insufficient incomes due to            seven people had jobs in the food industry
                                                                                      OF HEALTHY     low or precarious wages, as well as high outgoing            before Covid-1911 but this sector has one of
                                                                                                     costs of housing and other essentials. This means            the highest rates of low paid jobs. Given how
          Our ten metrics were selected to provide a holistic picture of the food         AND        that very little money is left over after bills are paid,    important the food industry is for the UK’s
          system, encompassing the food environment, drivers of food choice and       SUSTAINABLE    with the food budget often the easiest one to cut.           economy, the people working in it deserve
                                                                                                     Skipping meals or opting for the cheapest options –          reasonable pay.
          the impact of the current food system on our health and the environment.       FOOD        which are often the least healthy – has to suffice.

                                                                                        THEME        METRIC 5: FOOD PRICES. What we decide                         businesses reformulated the foods which they
                                                                                                     to buy is often influenced by price. Shoppers                sold, there would be less onus on individuals
                                                                                      THE FOOD       routinely say price is the most important factor             having to seek out information (and decipher
                                                                                      ON OFFER       driving their food choice12. We need to ensure that          it) to determine whether what they are buying
                                                                                                     people aren’t incentivised to buy less healthy food          is harming their health or not.
                                                                                                     because it is more affordable. We need to rebalance
                                                                                                     the relative cost of healthy and less healthy food.          METRIC 7: PRODUCTS WITH TOO
                                                                                                                                                                  LITTLE VEG. Many meal options available
                                                                                                     METRIC 6: PRODUCTS WITH TOO                                  have a heavy impact on the environment
                                                                                                     MUCH SUGAR. Our choices are influenced                       as well as our health. Eating less meat and
                                                                                                     by the options available, not all of which are               more veg can help to lower greenhouse gas
                                                                                                     healthy. Many products we routinely see on                   emissions as well as having health benefits in
                                                                                                     shelves are too high in fat, salt and sugar. If              high income countries.

                                                                                         THEME       METRIC 8: CHILDHOOD OBESITY.                                development. This is not a situation we should
                                                                                                     Levels of childhood obesity are greatest                    be seeing in the world’s sixth largest economy.
                                                                                      THE IMPACT     in those living in the most deprived areas.
                                                                                        ON OUR       Obesity in childhood can cause long term                    METRIC 10: DIABETES Adult health
                                                                                                     physical and mental health problems. We need                is also affected by our food environment,
                                                                                       HEALTH        to create food environments that reduce these               with complications from type 2 diabetes
                                                                                                     health inequalities and give all children the               continuing to rise. Complications arising from
                                                                                                     best chance in life.                                        obesity and diet-related disease have a huge
                                                                                                                                                                 impact on an individual’s quality of life and are
                                                                                                     METRIC 9: CHILD GROWTH. Whether                             a huge burden on our healthcare system. We
                                                                                                     children reach their full height potential is               need to change the food environment so that
                                                                                                     influenced by how deprived their community                  people don’t reach the stage where they are
                                                                                                     is. Short stature can indicate chronically poor             suffering from these preventable complications
                                                                                                     nutritional status and lead to inadequate                   of diet-related disease.

6   Food Foundation | THE BROKEN PLATE 2020                                                                                                                             THE BROKEN PLATE 2020 | Food Foundation      7
BROKEN PLATE THE - Ten vital signs documenting the health of our food system, how it impacts on our lives, and why we must change the food ...
●      METRIC                                                                                                                           THEME
                                                                                                                        ●                        Advertising: We need more advertising of healthy foods
                                                                                                                        ●         01             and to restrict advertising of foods high in fat, salt and sugar
                                                                                                                                                                                                                                                        THE WORLD AROUND US

                                   GLANCE
          The first Broken Plate report was published in 2019,
          with data mostly covering the period 2016 to 2017.
                                                                   and more equitable health outcomes. This year we
                                                                   ran the same analysis, for the same ten metrics,
                                                                                                                        ADVERTISING
          It established the baseline of the health of the UK’s    monitoring whether the situation has improved or
          food system and set out key recommendations to           worsened since 2019’s report.
          realign the food system so that it delivers improved
                                                                                                                                              Advertising spend on fruit and vegetables has increased since 2017,
                                                                                                                                              but remains low, with just 2.9% of ad spend on food and drink going
                                                                                                                                              towards fruit and vegetables.
                                  WHAT’S CHANGED SINCE 2019’S REPORT?
                                    ● IMPROVEMENT ● NO CHANGE ● DETERIORATED

                        METRIC 1 - PAGE 9                ●                        METRIC 6 - PAGE 18              ●                              SOFT DRINKS                         FRUIT AND VEG                 CONFECTIONARY                       SWEET AND
                        ADVERTISING                      ●                        PRODUCTS WITH                   ●                                                                                                                                  SAVOURY SNACKS
                                                         ●                        TOO MUCH SUGAR                  ●

                        METRIC 2 - PAGE 10               ●                        METRIC 7 - PAGE 20              ●
                        PLACES TO BUY                    ●                        PRODUCTS WITH                   ●
                        FOOD                             ●                        TOO LITTLE VEG                  ●                            %                                      %                              %                                  %
                                                                                                                                             SHARE           SPEND                  SHARE         SPEND            SHARE          SPEND               SHARE       SPEND

                        METRIC 3 - PAGE 12               ●                        METRIC 8 - PAGE 22              ●
                        THE AFFORDABILITY                ●                        CHILDHOOD                       ●          2017            11.1% £72,888,087                      2.5% £16,290,525               18.3% £119,406,521                 17.0% £111,413,680
                 £      OF A HEALTHY DIET                ●                        OBESITY                         ●
                                                                                                                            2019            14.0% £85,861,757                       2.9% £18,006,432               17.0% £104,457,838                 17.7% £108,877,806
                        METRIC 4 - PAGE 14               ●                        METRIC 9 - PAGE 24              ●
                                                                                                                                                     DETERIORATED                            IMPROVED                        IMPROVED                         DETERIORATED
                        WAGES                            ●                        CHILD GROWTH                    ●
                                                         ●                                                        ●                                                                                                                                                  With thanks to
                                                                                                                        Please note: Percentage share figures shows the proportion of total ad spend on food and drink spent on each of the four categories
                                                                                                                        Source: Nielsen AdDynamix,2017; Nielsen AdDynamix, 2019

                        METRIC 5 - PAGE 16               ●                        METRIC 10 - PAGE 26             ●
                        FOOD PRICES                      ●                        DIABETES                        ●                                                               HAS ANYTHING CHANGED?
                                                         ●                                                        ●     WHAT DID WE DO?                                           Our analysis shows a rather mixed picture. Although there has been a small (but
                                                                                                                        Using last year’s methodology, we                         encouraging) increase in the amount spent on fruit and veg advertising since 2017,
                                                                                                                        analysed data on advertising spend                        the overall percentage spend on fruit and veg remains negligible. While ad spend on
                                                                                                                        in the UK for food and soft drinks                        confectionary shows a small decrease, the amount spent on soft drinks and sweet and
                                                                                                                        (Nielsen AdDynamix, 2019), covering                       savoury snacks has increased slightly.
                        TRAJECTORY - PAGE 45                                                                            advertising in cinema, direct mail,
                        THE FUTURE HEALTH OF CHILDREN BORN IN 2020
                                                                                                                        door drops, outdoor, press, radio and                     Interestingly, since this analysis was last conducted, the UK’s sugar tax has come into
             Our trajectory looking at outcomes for children born in 2020 shows that by the time they’re 65             TV. We calculated the percentage of                       force, with the most recent evaluation report suggesting a 29% reduction in the sugar
             years old, over half will experience diet-related disease which will be affecting their quality of life.   advertising spend on four different                       content of soft drinks as a result of reformulation by manufacturers following the levy13.
                                                                                                                        categories of food and drink – fruit                      Ad spend on soft drinks in our analysis appears to reflect this shift, with spend on full sugar
             Overall, although there have been some positive changes to the food environment, many things               and vegetables, confectionary, sweet                      carbonated (fizzy) drinks having decreased by 68% since 2017 while the amount spent on
             are moving too slowly or not at all. The current status quo in the food environment has very real          and savoury snacks, and soft drinks                       low sugar / sugar free carbonated (fizzy) drinks has increased by 65%. The increase in ad
             implications for millions of children and adults.                                                          – comparing ad spend in 2017 to                           spend on vegetables also shows that change is possible, with initiatives such as Veg Power's
                                                                                                                        spend in 2019.                                            Eat Them To Defeat Them campaign (which launched in 2019) working to increase the
                                                                                                                                                                                  advertising and promotion of vegetables and already appearing to have had an effect.

8   Food Foundation | THE BROKEN PLATE 2020                                                                                                                                                                                      THE BROKEN PLATE 2020 | Food Foundation              9
BROKEN PLATE THE - Ten vital signs documenting the health of our food system, how it impacts on our lives, and why we must change the food ...
METRIC                                                                                                                                                                                                                                                                             THEME
 ●                           Places to buy food: Use local authority town planning
 ●           02              powers to reduce the availability of unhealthy takeaways
 ●                                                                                                                                                                                                                                                                                     THE WORLD AROUND US

PLACES TO BUY FOOD                                                                                                                                                                 WHAT DID WE DO?
                                                                                                                                                                                   Working with the Food environment
                                                                                                                                                                                                                         HAS ANYTHING CHANGED?
                                                                                                                                                                                                                         On the whole, not much has changed. The average proportion of fast food outlets in
                                                                                                                                                                                                                         English local authorities has remained consistent at 25%. The highest percentage of
                                                                                                                                                                                   assessment tool (Feat) team from      takeaways (40%) and the lowest percentage of takeaways (7%) in any local authority
                                                                                                                                                                                   the University of Cambridge, and      has also remained largely consistent. However, approximately 14% of local authorities
                                                                                                                                                                                   using the same methodology as         have seen more than a 5% increase in the proportion of fast food outlets during the
                            Forty five local authorities in England have seen more than a 5%                                                                                       last year’s Broken Plate report, we   past 18 months, compared with just 1% that have seen more than a 5% decrease.
                            increase in the proportion of food outlets that are fast food takeaways.                                                                               extracted and analysed data on
                                                                                                                                                                                   the location of food outlets from     The relationship between the percentage of takeaway outlets and levels of deprivation
                                                                                                                                                                                   the Ordnance Survey's Points of       in local authorities is still strong, with higher proportions seen in the most deprived
                                                                                                                                                                                   Interest dataset for June 201914.     local authorities.
                                                                                                                                                                                   We then calculated takeaway food

                                                                                                                                                                                                                         “
                                                                                                                                                                                   outlets as a proportion of all food
                                                                                                                                                                                                                                The relationship between the percentage
                            3                                278                                              45
                                                                                                                                                                                   outlets within local authorities in
        5%
BROKEN PLATE THE - Ten vital signs documenting the health of our food system, how it impacts on our lives, and why we must change the food ...
METRIC                                                                                                                                                                                                                                                                   THEME
 ●                     Affordability of a healthy diet: Ensure
 ●         03          that a healthy diet is an affordable diet
 ●                                                                                                                                                                                                                                                                  THE AFFORDABILITY OF HEALTHY
                                                                                                                                                                                                                                                                       AND SUSTAINABLE FOOD

AFFORDABILITY OF                                                                                                                          % of disposable income* used up if the cost of the Eatwell Guide was spent
                                                                                                                                          by all households, by income quintile, 2017-2018
A HEALTHY DIET
                                                                                                                                                                                                                     *After
                                                                                                                                                                                                                                                                                            housing
                                                                                                                                                                                                                                                                                              costs
                                                                                                                                                                               45
                                                                                                                                                                                    39%

                                                                                                                                       % OF IDISPOSABLE INCOME SPENT ON FOOD
                                                                                                                                                                               40

                     The poorest 20% of UK households would need to spend 39% of their                                                                                         35

                     disposable income on food to meet Eatwell Guide costs. This compares                                                                                      30
          £          to just 8% for the richest 20%.
                                                                                                                                                                               25
                                                                                                                                                                                               21%
                                                                                                                                                                               20
                                                                                                                                                                                                           16%
                                                             HAS ANYTHING CHANGED?                                                                                             15                                       12%
     WHAT DID WE DO?                                         There remains a huge difference in how affordable the government’s
     We updated the analysis in last year’s report,          recommended diet (the Eatwell Guide) is depending on how wealthy                                                  10                                                      8%
     using data on household income from the                 households are. For the majority of the population there has been no                                              5
     Family Resources Survey 2017/18, to look at             change in the proportion of disposable income (after housing costs)
     the affordability of the Eatwell Guide15. This is       that would need to be spent to afford the Eatwell Guide. Where there                                              0
     the government’s official guidance on a healthy         has been a change, is among those in the poorest 10% of households,                                                     1          2           3               4          5
     diet and includes those foods considered                who would have to spend 76% of their disposable income to meet the
     essential for a balanced and nutritious diet.
     The estimated cost of the Eatwell Guide (£5.99
                                                             government’s recommended diet. This has risen by 2% – up from 74% –
                                                             compared to the preceding year of analysis.
                                                                                                                                                                                     £
                                                                                                                                                                                                     INCOME QUINTILES
                                                                                                                                                                                                       (LOW TO HIGH)                   £
     per day) is based on optimisation modelling
     previously commissioned by Public Health                If UK households are split into income quintiles (fifths), the stark
     England in 201616, with the optimisation                difference in how affordable a healthy diet is for those in the lowest
     undertaken in order to minimise deviation from
     current dietary patterns. We then adjusted this
                                                             income groups compared to the rest of the population can be seen
                                                             clearly. The amount households have to spend on food as a proportion
                                                                                                                                          Proportion of disposable income* used up if the cost of the Eatwell Guide
     cost based on a household’s composition, as             of disposable income increases steadily as household income decreases,       was spent by all households, by income decile                                                                                                       *After
     well as economies of scale that                           before rising sharply for the poorest 20% of households.                                                                                                                                                                     housing

                                               “
     might affect the overall cost of                                                                                                                                                                                                                                                          costs

     food. The proportion of disposable                  There remains a huge difference in how                                                                    76% 74%
                                                                                                                                                                                                             2017
                                                                                                                                                                                                              / 18
                                                                                                                                                                                                                        2016
                                                                                                                                                                                                                         / 17
     income that would be used up
     by the recommended diet (after                      affordable the government’s recommended diet
     housing costs were removed)                         is depending on how wealthy households are.”
     was then calculated, in line with
     previous methodology.17

     The lowest income decile includes some people
     who have very little or no income. It is made                                                                                                                                  27% 29%
     up of a diverse group of people, with some                                                                                                                                               20% 20%    21% 21%
                                                                                                                                                                                                                     18% 18%
     earning precarious incomes, some between                                                                                                                                                                                   15% 15%     13% 13%
     jobs, and some living off savings. While they may                                                                                                                                                                                                  11% 11%     9%       9%   6%    6%
     therefore not all be categorised as among the
     poorest 10% of households, it is not possible to
     further segregate this group by socioeconomic                                                                                                                             1         2       3         4            5          6           7            8            9             10
     status. People who are homeless, sleeping rough
                                                                                                                                                                                                                      INCOME DECILE
     or in institutional settings are not included in
     the Family Resources Survey.
                                                                                                                                                                               £                                       (LOW TO HIGH)                                                   £
                                                                                                                                      Source: Secondary analysis of the Family Resources Survey, 2016/7 and 2017/18

12   Food Foundation | THE BROKEN PLATE 2020                                                                                                                                                                                                          THE BROKEN PLATE 2020 | Food Foundation          13
BROKEN PLATE THE - Ten vital signs documenting the health of our food system, how it impacts on our lives, and why we must change the food ...
METRIC                                                                                                                                                                                                                                                                    THEME
 ●                             Wages: Pay people working in
 ●            04               the food sector a fair wage
 ●                                                                                                                                                                                                                                                                       THE AFFORDABILITY OF HEALTHY
                                                                                                                                                                                                                                                                            AND SUSTAINABLE FOOD

WAGES                                                                                                                                                            WHAT DID WE DO?
                                                                                                                                                                 Using data from the Annual Survey
                                                                                                                                                                                                            HAS ANYTHING CHANGED?
                                                                                                                                                                                                            There has been a slow but steady improvement in wages for those working in the
                                                                                                                                                                                                            food industry over the past couple of years. Across all sectors the percentage of those
                                                                                                                                                                 of Hours and Earnings (ASHE)               defined as low paid (earning less than two thirds of the median UK income) decreased,
                                                                                                                                                                 dataset18, the largest survey of           dropping from 46% in 2017 to 39% in 2019.
                                                                                                                                                                 employees in the UK, the Resolution
                             16% of workers in the food sector earn the minimum wage compared                                                                    Foundation analysed the pay of             The percentage of those paid at or below the real Living Wage, a voluntary wage
                             to 7% of workers across the UK.                                                                                                     people in the UK’s food industry. We       rate that takes into account the cost of living and inflation, has also decreased across the
                                                                                                                                                                 looked at the general picture for the      sector. More companies ought to be encouraged to pay the real Living Wage, with the
                                                                                                                                                                 industry overall, as well as pay for       vast majority of waiting and kitchen staff still often earning below the real Living Wage.
                                                                                                                                                                 different sectors, including agriculture   Across the food sector, 47% of employees earned below the real Living Wage in 2019.
                                                                                                                                                                 and fishing, waiting staff, food
                                                                                                                                                                 retail, kitchen staff, catering, food      However, the overall success of the sector in improving wages masks large differences
      % of employees in the UK paid below the real Living Wage by industry                                                                                       manufacturing and food wholesale.          at an industry level. While just 19% of those working in food manufacturing were low
                                                                                                                                                                 We compared the data from 2019 to          paid in 2019, this rose to 53% for those working in catering and 71% for waiting staff.
                                                                                                                                                                 last year’s Broken Plate report, which     Moreover, with COVID-19 and the UK’s lockdown having led to the near total closure
                                                                                                                                                                 used the survey findings for 2017.         of large swathes of the food industry for 15 weeks during 2020, it remains to be seen
                                                                                                                                                                                                            whether the positive downward trend of the past five years can be maintained. With
                                                                                                                                                                                                            the hospitality sector particularly affected by COVID-19, furloughing an estimated 2.4
                                                                                                                                                                                                            million workers, it is concerning that the majority of waiters, waitresses, catering and
                                                                                                                                                                                                            kitchen staff were already paid below the real Living Wage before COVID-19.
                                WAITING                              CATERING                        KITCHEN                         FOOD
                                 STAFF                                                                STAFF                          RETAIL

            2017                  83%                                    65%                         66%                             52%
            2019                  77%                                    60%                         59%                             44%

                                                                                                                                                                                                                                                      “       With COVID-19
                                                                                                                                                                                                                                                              having led to the
                                                                                                                                                                                                                                                              near total closure
                                             AGRICULTURE                           FOOD                        FOOD                                                                                                                                           of large swathes of
                                             AND FISHING                       MANUFACTURING                 WHOLESALE                                                                                                                                        the food industry
            2017                                   37%                                    30%                    26%                                                                                                                                          during 2020, it
                                                                                                                                                                                                                                                              remains to be
                                                                                                                                                                                                                                                              seen whether the
                                                    36%                                    26%                    25%
                                                                                                                                                With thanks to

            2019
                                                                                                                                                                                                                                                              positive trend
                                                                                                                                                                                                                                                              of the past five
     Please note: We have used the following codes to extract trend data from the ASHE database: Industry groups (SIC 2007 codes): Agriculture and fishing:                                                                                                   years can be
     1 excl 1.7; Food retail: 47.2 excl 47.26, 47.11 and 47.81; Food wholesale: 46.3 excl 46.35 and 46.17; Catering (bars and kitchens): 56. Occupation groups
     (SOC 2010 codes): Kitchen staff: 5434, 5435, 9272 Waiters & waitresses: 9273. We have used 2017 data extracted this year, which means that for three                                                                                                     maintained”
     categories there is a slight discrepancy between the percentages reported in this year's Broken Plate and last year's report.
     Source: Office for National Statistics (2019). Annual Survey of Hours and Earnings, 1997-2019
     The 2019/2020 real Living Wage rate is £9.30 across the UK and £10.75 in London19

14    Food Foundation | THE BROKEN PLATE 2020                                                                                                                                                                                                            THE BROKEN PLATE 2020 | Food Foundation       15
BROKEN PLATE THE - Ten vital signs documenting the health of our food system, how it impacts on our lives, and why we must change the food ...
METRIC                                                                                                                                                                                                                                                                  THEME
 ●                     Food prices: Make healthier
 ●         05          foods more affordable
 ●                                                                                                                                                                                                                                                                     THE AFFORDABILITY OF HEALTHY
                                                                                                                                                                                                                                                                          AND SUSTAINABLE FOOD

FOOD PRICES                                                                                                                                    Mean price of foods per 1,000 calories by Food
                                                                                                                                               Standards Agency nutrient profiling score category

                                                                                                                                                                      £8
                     More healthy foods are three times as expensive as less healthy foods
                     per calorie, with the cost of more healthy foods diverging from less                                                                             £7
                     healthy foods over the past four years.
                                                                                                                                                                      £6
                                                                                                                                                                                                                                                             MORE HEALTHY

                                                                                                                                                 PRICE (£/1000KCAL)
                                                                                                                                                                      £5
                                                                                                                                                                                                                                                          LESS HEALTHY
                                                HAS ANYTHING CHANGED?
     WHAT DID WE DO?                            The price of healthier foods continues to remain much higher than less healthy foods.                                 £4
     The Centre for Diet and Activity           Using a binary more/less healthy categorisation according to the FSA’s nutrient
     Research (CEDAR) at the                    profiling model reveals striking differences, with more healthy foods three times more                                £3
     University of Cambridge built              expensive than less healthy foods for the equivalent number of calories. The mean cost
     on their food price research first         of more healthy foods in 2019 per 1000 kilocalories was £7.68, compared to £2.48 for                                  £2
     conducted in 2014,20 and matched           less heathy foods. Although at the time of writing we have incomplete data for 2020,
     price data for the 82 food and             the upward trend in price for more healthy foods seen in the first quarter of this year is                            £1
     drink items that have been                 concerning one, with the mean price at its highest level since 2013.
     continuously tracked by the Office                                                                                                                               £0
     of National Statistic’s Consumer           Breaking the data down into the government’s five Eatwell Guide food categories tells a
     Price Index (CPI) 21 between               similar story. While the mean price of fruit and vegetables is on an upward trend (£9.39
     2010–2020 to food and nutrient             per 1000 kilocalories in 2019, up from £8.88 in 2017), the price of food and drinks high                                    2010   2011    2012         2013        2014         2015   2016   2017   2018      2019     2020
     data from the UK Department                in salt, sugar and/or fat has remained fairly stable at a much lower price point. The
     of Health’s National Diet and              mean price of foods in this category was £3.54 in 2019, compared to £3.42 in 2017.
     Nutrition Survey22.                                                                                                                       Mean price of foods per 1,000 calories by Eatwell Guide food group
                                                Food price is a major determinant of food choice, with price rises disproportionately                                                                                                                                              FRUIT AND
     Each item was then assigned to             affecting lower income groups. With COVID-19 continuing to impact on food supply                                                                                                                                                  VEGETABLES
     a food group and categorised               chains globally, the upward trend already seen here for 2020 is a concerning one.                                     £10
     as either ‘more healthy’ or ‘less
                                                                                                                                                                                                                                                                                   MILK AND
     healthy’ based on its composition                                                                                                                                                                                                                                            DAIRY FOODS
     using the nutrient profiling                                                                                                                                     £8
     model developed by the Food

                                                                                                                                                 PRICE (£/1000KCAL)
     Standards Agency. This year, we                                                                                                                                                                                                                                               MEAT, FISH,
     also assigned each food in the CPI                                                                                                                               £6                                                                                                          EGGS, BEANS,
                                                                                                                                                                                                                                                                                     OTHER
     basket to one of the five Eatwell                                                                                                                                                                                                                                            SOURCES OF
     Guide food groups, to better                                                                                                                                                                                                                                                  NON-DAIRY
     understand the relative cost of the                                                                                                                                                                                                                                            PROTEIN
                                                                                                                                                                      £4
     different food categories.

     CPI data do not capture all price                                                                                                                                                                                                                                              FOOD &
     reductions from promotions, nor
                                                                                                                                                                      £2                                                                                                          DRINKS HIGH
                                                                                                                                                                                                                                                                                  IN FAT AND/
     can they reflect local differences                                                                                                                                                                                                                                            OR SUGAR
     in price, but using price per
     kilocalories is a helpful way to                                                                                                                                 £0
     understand the relative prices of                                                                                                                                                                                                                                            BREAD, RICE,
                                                                                                                                                                                                                                                                                   POTATOES,
     foods which make up diets rather                                                                                                                                                                                                                                                PASTA
     than comparing individual products                                                                                                                                     2010   2011    2012         2013        2014         2015   2016   2017   2018      2019     2020
     within specific food categories.                                                                                                                                                                                                                                                   With thanks to

                                                                                                                                             Source: CEDAR analysis using CPI average retail food price indices data, 2010-2020 (ONS)

16    Food Foundation | THE BROKEN PLATE 2020                                                                                                                                                                                                         THE BROKEN PLATE 2020 | Food Foundation            17
BROKEN PLATE THE - Ten vital signs documenting the health of our food system, how it impacts on our lives, and why we must change the food ...
METRIC                                                                                                                                                                                                                                                                                       THEME
 ●                              Products with too much sugar: Reformulate
 ●             06               products with too much sugar and too little fibre
 ●                                                                                                                                                                                                                                                                                                 THE FOOD ON OFFER

PRODUCTS WITH                                                                                                                                                                            WHAT DID WE DO?
                                                                                                                                                                                         During January and February 2020,
                                                                                                                                                                                                                                  HAS ANYTHING CHANGED?
                                                                                                                                                                                                                                  There have been some small improvements in making breakfast cereals with packaging
                                                                                                                                                                                                                                  that may appeal to children less unhealthy. The proportion of these cereals that

TOO MUCH SUGAR
                                                                                                                                                                                         Action on Salt and Action on Sugar       are high in sugar, high in salt or low in fibre has decreased, which is an encouraging
                                                                                                                                                                                         visited nine major supermarkets          improvement. However, the average nutrient content of these cereals hasn’t actually
                                                                                                                                                                                         (Aldi, Asda, the Co-operative, Lidl,     changed very much, with the average fibre content of children’s cereals increasing by
                                                                                                                                                                                         Marks and Spencer, Morrisons,            6%, while the average salt and sugar content has decreased by 4% and 2% respectively
                                                                                                                                                                                         Sainsbury’s, Tesco, and Waitrose         since 2019.
                                                                                                                                                                                         and Partners) to assess cereals with
                              The situation has started to improve, with the proportion of children’s                                                                                    child-friendly packaging. This time      There is therefore still a long way to go before they reach the appropriate and
                              cereals with a high sugar content decreasing by 12 percentage points                                                                                       120 breakfast cereals qualified – 43     recommended nutrient levels. Using the FSA’s traffic light labelling system, which
                              between 2019 and 2020.                                                                                                                                     more than in Broken Plate 2019.          categorises nutrients into high (red), medium (amber) and low (green), the majority
                                                                                                                                                                                                                                  would fail to obtain a green rating: only 9% for sugar, 41% for salt and 13% for fibre
                                                                                                                                                                                         It is worth noting that these data       (using Action on Sugar’s cut-offs for fibre).
                                                                                                                                                                                         were collected before the voluntary

                                                                                                                                                                                                                                  “
                                                                                                                                                                                         removal of cartoon characters from
      The proportion of breakfast cereal                                                                                                                                                 children’s cereals by Asda, Aldi                The proportion of children's cereals
      products with packaging that may appeal
                                                                                                                                                                                         and Lidl. It is unknown if this would
                                                                                                                                                                                         have impacted on the findings or
                                                                                                                                                                                                                                         that are high in sugar, high in salt or
      to children categorised as high in sugar                                                                                                                                           not, but it will be interesting to see          low in fibre has decreased, which is an
      and salt and low in fibre                                                                                                                                                          whether the removal of cartoon
                                                                                                                                                                                                                                         encouraging improvement.”
                                                                                                                                                                                         characters will change anything,
                                                                                                                                                                                         and whether new designs are less
                                  ✘ HIGH                                             ✘ HIGH OR                                                        ✘ LOW                              appealing to children.
                                 IN SUGAR                                          MEDIUM IN SALT                                                    IN FIBRE

             2019                49%                                                      86%                                                       48%

             2020                37%                                                      59%                                                       38%

                    SCORING SYSTEM FOR SUGAR:                                   SCORING SYSTEM FOR SALT:                            SCORING SYSTEM CREATED FOR FIBRE:
                      > 22.5G SUGARS PER 100G                                      >1.5G SALT PER 100G                                     < 5G FIBRE PER 100G
                   IS CLASSIFIED AS HIGH SUGAR                                 IS CLASSIFIED AS HIGH SALT                              IS CLASSIFIED AS LOW FIBER
                        < 5G SUGARS PER 100G                                        ≤ 0.3G SALT PER 100G                                      ≥ 10G FIBRE PER 100G
                    IS CLASSIFIED AS LOW SUGAR                                  IS CLASSIFIED AS LOW SALT                                 IS CLASSIFIED AS HIGH FIBRE

                                                                                                                                                                        With thanks to

     Please note: High, Medium, Low colour coding based on the Department of Health and Social Care’s Front of Pack traffic light labelling system.
     Source: Department of Health and Social Care. Guide to creating a front of pack (FoP) nutrition label for pre-packed products sold through retail outlets. 2016.

18     Food Foundation | THE BROKEN PLATE 2020                                                                                                                                                                                                                                THE BROKEN PLATE 2020 | Food Foundation      19
METRIC                                                                                                                                                                                                                               THEME
 ●                        Products with too little veg: Reformulate
 ●           07           products so they contain more veg
 ●                                                                                                                                                                                                                                       THE FOOD ON OFFER

PRODUCTS WITH                                                                                                                     WHAT DID WE DO?
                                                                                                                                  Working with the University of
                                                                                                                                                                         HAS ANYTHING CHANGED?
                                                                                                                                                                         This year’s survey included a much larger sample of ready meals (2,404 compared to
                                                                                                                                                                         1,350), with the use of a real-time food and drink database complementing the data

TOO LITTLE VEG                                                                                                                    Oxford’s foodDB team, Eating Better
                                                                                                                                  surveyed 2,404 ready meals in 11
                                                                                                                                  UK supermarkets (including Tesco,
                                                                                                                                  Asda, Sainsbury’s and Morrisons)
                                                                                                                                                                         collected in-store. This year’s survey shows that there has been a positive change in
                                                                                                                                                                         the proportion of meat-free options, with the proportion of ready meals that are meat
                                                                                                                                                                         free increasing by 33% in the space of just two years.

                                                                                                                                  during March 2020. The survey          The livestock sector accounts for 35% of total cropland use and 14.5% of greenhouse
                                                                                                                                  includes meals sold as a hot main      gas (GHG) emissions globally23,24. In the UK, just 0.75% of total agricultural land
                         This year 24% of ready meals were vegetarian or plant-based –                                            dish, including both own-brand and     is used to grow veg25, with vegetables having significantly lower GHG emissions
                         a 33% increase since 2018                                                                                branded meals, chilled and frozen      compared to other foods26. As a result, there are environmental benefits to eating
                                                                                                                                  options. The ingredient text for       less and better meat and more veg. Although this year’s results show that meat-free
                                                                                                                                  each ready meal was analysed to        options are becoming more available, there is still work to be done given that three
                                                                                                                                  see which products contained meat      quarters of ready meals were found to contain meat or fish. What’s more, almost half
                                                                                                                                  or fish, or could be categorised as    (49.5%) of those ready meals with meat contained red or processed meat. As well as
                                                                                                                                  either vegetarian or plant-based       health organisations globally recommending a reduction of red and processed meat
                                                                                                                                  (vegan). The results were then         consumption in high income countries, there are also environmental implications to diets
                                                                                                                                  compared to Eating Better's 2018       high in red meat. Cattle are responsible for 9% of global GHG emissions with 6% coming
                                                                                                                                  report on ready meals.                 from beef production alone27.

                                                                                                                                  Although the total number of           The increasing amount of public interest in plant-based diets and programmes such
                                     2018                                                                 2020
                                                                                                          2018                    ready meals included in the survey     as Peas Please (which works to mainstream veg as part of new product development)
                                                                                                                                  increased between 2018 and 2020,       may have helped to drive some of the changes seen here. However, going forward,
                                                                                                                                  this is not thought to have impacted   ensuring that plant-based options meet health objectives as well as environmental
                                                                                                                                  on the survey's findings, as the       ones will be important, as will making sure these products are accessible. Worryingly,
                                                                                                                                  proportion of meal types within        this year’s survey found that in four supermarkets plant-based ready meals were more
                                                                                                                                  different ranges remained relatively   expensive than meat, fish or vegetarian (dairy-based) alternatives.
                                                                                                                                  stable across data collected both
                                                                                                                                  online and in-store.

                  86%
                    MEAT
                                                    14%
                                                      MEAT
                                                                                                 76%
                                                                                                 MEAT
                                                                                                                 24%
                                                                                                                  MEAT
                    & FISH                            FREE*                                      & FISH           FREE

     *Please note: The proportion of ready meals that were meat free increased by 7 percentage                   With thanks to
     points excluding Ocado ready meals, as they were not included in 2018's survey.

20    Food Foundation | THE BROKEN PLATE 2020                                                                                                                                                                       THE BROKEN PLATE 2020 | Food Foundation      21
METRIC        Children with obesity: Obesity among children continues to be greater                                                                                                                                     THEME
 ●
 ●                    amongst the most deprived communities compared to the least deprived
 ●        08          and there has been little improvement in reducing these inequalities.                                                                                                                           THE IMPACT ON OUR HEALTH

CHILDREN WITH OBESITY                                                                                          WHAT DID WE DO?
                                                                                                               We gathered data collected by
                                                                                                                                                            HAS ANYTHING CHANGED?
                                                                                                                                                            Levels of childhood obesity continue to worsen in Scotland and England, with the
                                                                                                                                                            inequalities between the most and least deprived children widening. However, in Wales
                                                                                                               the various child measurement                not only has there been a decrease in obesity prevalence, but there has been a small
                                                                                                               programmes across the three                  reduction in the differences between the most and least deprived.
                                                                                                               nations on child obesity in 4-5 year
                    Obesity among children continues to be greater amongst the most                            olds. Northern Ireland uses different
                    deprived communities compared to the least deprived                                        definitions of obesity and we were
                                                                                                               therefore unable to compare it to
                                                                                                               the other three nations.

                                                                                                               The most deprived quintile has been
                                                                                                               compared with the least deprived
     Prevalence of                                                                                             quintile.

     obesity in children                                                                                       Sources:
                                                                       BROKEN                 BROKEN           ENGLAND: National Child Measurement
                                                                        PLATE
                                                                        2019                  2018
                                                                                               PLATE
                                                                                              2020             Programme 2017/18 and 2018/19. 28
                                                                                                               Age group – Reception (4-6-year-olds).
                                                                                                               SCOTLAND: Child Health Surveillance
                                                                      Scotland            Scotland             Programme 2017/18 and 2018/19. 29
                                                                                                               Age group – Primary 1 (4.5-6.5-year-olds).
                                                                        13.0%                  13.7%           WALES: Child Measurement Programme
                                                                                                               2016/17 and 2018/18. 30
                                                                        6.6%                   6.5%            Age group – 4-5-year-olds.

                                                                      England                 England
                                                                        12.3%                  12.7%

                                                                        6.8%                   6.3%

                                                                       Wales                  Wales

                                                                        14.9%                  14.2%

                                                                        8.7%                   8.2%

                                                                                              MOST DEPRIVED
                                                                                              LEAST DEPRIVED

22   Food Foundation | THE BROKEN PLATE 2020                                                                                                                                                          THE BROKEN PLATE 2020 | Food Foundation   23
METRIC                                                                                                                                               THEME
 ●                              Child growth: Ensure children have access to a
 ●                     09       nutritious diet during the first 1,000 days and beyond
 ●                                                                                                                                                            THE IMPACT ON OUR HEALTH

CHILD GROWTH
                               Children in deprived communities are more than 1 cm shorter on
                               average than children in wealthy communities by the time they
                               reach age 11*

           Height of White British children in year 6, by deprivation group

               146.0

               145.4

               145.0
 HEIGHT (CM)

               144.5

               144.0

                                                                                           ● 2018/19 FEMALE           ● 2018/19 MALE
               143.5
                                                                                           ● 2017/18 FEMALE           ● 2017/18 MALE

               143.0

               142.5    1          2            3             4           5            6            7            8        9          10
                                                                   DEPRIVATION DECILE (IDACI)
                        £                                          (MOST TO LEAST DEPRIVED)
                                                                                                                                     £
                                                         HAS ANYTHING CHANGED?
         WHAT DID WE DO?                                 We would not expect this metric to change in a short time frame, so unsurprisingly
         Working with Public Health England              there has been no change since the last Broken Plate report. Those in the most
         we used National Child Measurement              deprived groups were shorter than those least deprived groups in White British
         Programme data28 to calculate the               children and Asian children. The same pattern was not seen in children of Black
         average height of children in year 6            ethnicities and further assessment of this is needed.
         (aged 10–11 years) by deprivation

                                                         “
         (Income Deprivation Affecting
         Children Index – IDACI) group. The                       Those in the most deprived groups were
         data were split by ethnicity as there
         are some natural differences by                          shorter than tthose in the least deprived
         the time children reach puberty in                       groups in both White British and Asian
         average height across ethnic groups.
         We have compared 2018/19 data                            British children.”
         with 2017/18.
                                                         *With the exception of children of Black ethnicities.

24             Food Foundation | THE BROKEN PLATE 2020                                                                                        THE BROKEN PLATE 2020 | Food Foundation   25
METRIC        Diabetes: Ensure that the food                                                                                                                                                                THEME
 ●
 ●                    environment isn’t conducive to diet-related
 ●        10          disease and its serious complications                                                                                                                                                THE IMPACT ON OUR HEALTH

DIABETES                                                                                                WHAT DID WE DO?
                                                                                                        We took data from Public Health
                                                                                                                                                HAS ANYTHING CHANGED?*
                                                                                                                                                There were 9,155 diabetes-related amputations on average per year for the period
                                                                                                                                                2015/16 to 2017/18. This has increased from 7,733 amputations for the period 2011/12
                                                                                                        England’s Diabetes Foot Care            to 2013/14. Moreover, 27% of the amputations in 2015/16 to 2017/18 were major
                                                                                                        Profiles31, which are based on          amputations (above the ankle).
                                                                                                        data taken from Hospital Episode
                                                                                                        Statistics, the National Diabetes       Although England's population grew by 5.6% between 2011 and 201833, which will likely
                    Diabetes-related amputations have increased by 18% in four years.                   Audit, and the Quality and              have impacted on the absolute numbers seen here, this is still an alarming increase in
                                                                                                        Outcomes Framework. These data          diabetes-related amputations.

                                                                                                                                                “
                                                                                                        are reported for 3-year periods,
                                                                                                        from which we took a yearly
                                                                                                        average. These data include both
                                                                                                                                                       There were 9,155 diabetes-related
                                                                                                        type 1 and type 2 diabetes, with               amputations on average per year
     Average yearly number of diabetes-related amputations
                                                                                                        type 2 diabetes strongly associated
                                                                                                        with obesity and deprivation and
                                                                                                                                                       for the period 2015/16 to 2017/18.”
                                                                                                        comprising the majority (90%) of
     10000                                                                                              diabetes cases in the UK32.
      9000                                                                                              This year’s data cannot be directly
      8000                                                                                              compared to the figures reported
                                                                                                        for this metric in last year’s Broken
      7000                                                                                              Plate, as we were unable to obtain
                                                                                                        an update for the same dataset.
      6000                                                                                              This year’s data therefore uses a
      5000
                                                                                                        slightly different methodology to
                                                                                                        track diabetes-related amputations.
      4000

      3000

      2000

      1000

          0
                     2011/12                   2012/13          2013/13           2014/15     2015/16
                        –                         –                –                 –           –
                     2013/14                   2014/15          2015/16           2016/17     2017/18

                  MAJOR AMPUTATIONS               MINOR AMPUTATIONS       TOTAL AMPUTATIONS

26   Food Foundation | THE BROKEN PLATE 2020                                                                                                                                               THE BROKEN PLATE 2020 | Food Foundation     27
Trajectory for children born in 2020
     THE NEXT GENERATION?                                                                                                          ● Overweight ● Obesity ● Dead

                                                                                                                                   AT AGE 5/RECEPTION: FORECAST 2025

               The statistics in last year’s Broken Plate report
               illustrated that drastic action was required to transform   TIME FOR CHANGE
               our food system to deliver health, sustainability, and      This trajectory illustrates the fate of children
               equity. Our analysis this year has shown that not           born in 2020 if the government and businesses
               only is positive change failing to be delivered at the      do not act now to ensure that everybody is able         AT AGE 11/YEAR 6: FORECAST 2031
               pace required, but that for several of the metrics, the     to secure nutritious food. Children born this year
               situation has deteriorated. Three metrics have shown        will be at a high risk of obesity and several diet-
               improvement, with five non-movers, and two having           related chronic diseases throughout their lives. By
               worsened. These shocking statistics have real-life health   2085, nearly 1 in 5 people will have heart disease
               implications for millions of people.                        and more than 1 in 5 people will have type 2
                                                                           diabetes if we do not change UK diets. As we            AT AGE 21: FORECAST 2041
               MODELLING THE HEALTH OF THIS                                know, the poorest people are disproportionately
               YEAR’S BIRTH COHORT                                         more likely to suffer from these conditions.
               We calculated the projected health implications of diets
               for children born in 2020. The trajectory was modelled      But this is preventable. Government and industry
               using projected figures based on current trends, thus       should heed these warning signs of a broken
               showing us what the rates of overweight, obesity and        system, as illustrated by the metrics in this report,   AT AGE 65: FORECAST 2085
               diet-related disease will be for these children if things   and act now so that everyone is able to benefit
               continue as they are. These diseases are not exclusively    from healthy and sustainable diets. COVID-19 has
               related to overweight and obesity, but there is a           highlighted the fragility both of our health and of
               strong association between high BMIs and being at an        the UK’s food and health systems, but it has also
               increased risk of several diet-related                      created an unprecedented opportunity to change                                         AT AGE 65: DIABETES T1+T2
               chronic diseases. It is also worth                                         things for the better as society and
               noting that some individuals will                                               businesses start to rebuild.
               have multiple comorbidities, living                                                If action is not taken, and
               with several of the conditions                                                       soon, the situation will
               on the graph to the right at the                                                     continue to deteriorate.                                      AT AGE 65: CARDIOVASCULAR DISEASE
               same time.
                                                                                                                                         AT AGE 65:
                                                                                                                                        IN DETAIL
                                                                                                                                                                  AT AGE 65: CANCERS

                                                                                                                                                                  AT AGE 65: OSTEOPOROSIS

                                                                                                                                                                  AT AGE 65: TOOTH DECAY
                                                                                                                                       ● Dental decay
                                                                                                                                       ● People who've
                                                                                                                                         lost all teeth

                                                                                                                                   Note: Overweight is defined as a Body Mass Index (BMI) of 25 to 29.9 kg/m2, with obesity a BMI of 30 kg/m2 and above.

28   Food Foundation | THE BROKEN PLATE 2020                                                                                                                                                                                                  THE BROKEN PLATE 2020 | Food Foundation   29
REFERENCES                                                                                                                                       METHODS
1.  Tan M, He FJ, MacGregor GA. Obesity and covid-19: The role of the food industry. BMJ. 2020;369. doi:10.1136/bmj.m2237
2.  Food Foundation. FOOD FOUNDATION POLLING: fourth survey – seven weeks into lockdown - Food Foundation. https://foodfoundation.               Further detail and more information on the sources, data and methodologies used to calculate Broken Plate's metrics
    org.uk/vulnerable_groups/food-foundation-polling-fourth-survey-seven-weeks-into-lockdown/. Published 2020. Accessed July 8, 2020.            can be found in our Broken Plate technical report, available from the Food Foundation's website.
3.  Public Health England. Disparities in the risk and outcomes of Covid-19. 2020:89. https://www.gov.uk/government/publications/covid-19-
    review-of-disparities-in-risks-and-outcomes.
4. Public health matters. The burden of disease and what it means in England. https://publichealthmatters.blog.gov.uk/2015/09/15/the-
    burden-of-disease-and-what-it-means-in-england/. Published 2015. Accessed July 8, 2020.
5. NHS Confederation. Public reassurance needed over slow road to recovery for the NHS. https://www.nhsconfed.org/news/2020/06/road-
    to-recovery. Published 2020. Accessed July 8, 2020.
6. Propper C, Karjalainen H, Banks J. Recessions and Health: The Long-Term Health Consequences of Responses to the Coronavirus.; 2020.
    doi:10.1920/BN.IFS.2020.BN0281
7.  Horton R. Offline: CoHERE—a call for a post-pandemic health strategy. Lancet. 2020;395(10232):1242. doi:10.1016/S0140-6736(20)30895-3
8. ASA | CAP. Children’s exposure to TV ads for gambling, alcohol and high fat, salt and sugar foods: 2018 update. https://www.asa.org.uk/
    news/children-s-exposure-to-tv-ads-2018-update.html. Published 2019. Accessed July 8, 2020.
9. Critchlow N, Bauld L, Thomas C, Hooper L, Vohra J. Awareness of marketing for high fat, salt or sugar foods, and the association with
    higher weekly consumption among adolescents: A rejoinder to the UK government’s consultations on marketing regulation. Public Health
    Nutr. 2020;(7). doi:10.1017/S1368980020000075
10. Burgoine T, Sarkar C, Webster CJ, Monsivais P. Examining the interaction of fast-food outlet exposure and income on diet and obesity:
    Evidence from 51,361 UK Biobank participants. Int J Behav Nutr Phys Act. 2018;15(1):71. doi:10.1186/s12966-018-0699-8
11. Food Statistics in your pocket Summary - GOV.UK. https://www.gov.uk/government/publications/food-statistics-pocketbook/food-
    statistics-in-your-pocket-summary. Accessed July 16, 2020.
12. IGD. Store choice vs product choice: the influence of price. https://www.igd.com/articles/article-viewer/t/store-choice-vs-product-choice-
    the-influence-of-price/i/15839. Published 2015. Accessed July 8, 2020.
13. Public Health England. Sugar reduction: progress between 2015 and 2018 - GOV.UK. https://www.gov.uk/government/publications/sugar-
    reduction-progress-between-2015-and-2018. Accessed July 21, 2020.
14. Centre for Diet and Activity Research (CEDAR). Food environment assessment tool (Feat) (2020). Available at: www.feat-tool.org.uk
    (Accessed July 8, 2020).
15. Public Health England. Eatwell Guide.
16. Scarborough P, Kaur A, Cobiac L, et al. Eatwell Guide: Modelling the dietary and cost implications of incorporating new sugar and fibre
    guidelines. BMJ Open. 2016;6(12):e013182. doi:10.1136/bmjopen-2016-013182
17. Scott C, Sutherland J, Taylor A. Affordability of the UK's Eatwell Guide. Food Foundation. 2018.
18. Statistics O for N. Annual Survey of Hours and Earnings (ASHE).
    https://www.ons.gov.uk/surveys/informationforbusinesses/businesssurveys/annualsurveyofhoursandearningsashe. Published 2020.
    Accessed July 8, 2020.
19. The Living Wage. What is the real Living Wage? | Living Wage Foundation. https://www.livingwage.org.uk/what-real-living-wage. Accessed
    July 21, 2020.
20. Jones NRV, Conklin AI, Suhrcke M, Monsivais P. The Growing Price Gap between More and Less Healthy Foods: Analysis of a Novel
    Longitudinal UK Dataset. PLoS ONE. 2014; 9(10): e109343. doi.org/10.1371/journal.pone.0109343.
21. CPI INDEX 01 : FOOD AND NON-ALCOHOLIC BEVERAGES 2015=100 - Office for National Statistics. https://www.ons.gov.uk/economy/
    inflationandpriceindices/timeseries/d7bu/mm23. Accessed July 21, 2020.
22. National Diet and Nutrition Survey - GOV.UK. https://www.gov.uk/government/collections/national-diet-and-nutrition-survey#archive-of-
    ndns-reports. Accessed July 21, 2020.
23. FAO. Water Use of Livestock Production Systems and Supply Chains.; 2018.
24. Garnett T, Godde C, Muller A, et al. Grazed and confused? Ruminating on Cattle, Grazing Systems, Methane, Nitrous Oxide, the Soil
    Carbon Sequestration Question-and what it All Means for Greenhouse Gas Emissions. Food Clim Res Netw. 2017:1-127. https://www.fcrn.
    org.uk/sites/default/files/project-files/fcrn_gnc_report.pdf.
25. Food Foundation. VEG FACTS 2020 IN BRIEF.; 2020. www.foodfoundation.org.uk. Accessed June 22, 2020.
26. Clune S, Crossin E, Verghese K. Systematic review of greenhouse gas emissions for different fresh food categories. J Clean Prod.
    2017;140:766-783. doi:10.1016/j.jclepro.2016.04.082
27. The Behavioural Insights Team. A Menu for Change. https://www.bi.team/publications/a-menu-for-change/. Published 2020. Accessed
    July 8, 2020.
28. NHS Digital. National Child Measurement Programme. https://digital.nhs.uk/data-and-information/publications/statistical/national-child-
    measurement-programme. Published 2020. Accessed July 8, 2020.
29. Information Services Division Body Mass Index of Primary 1 Children in Scotland (2018). Available at: https://www.statisticsauthority.gov.
    uk/national-statistician/types-of-official-statistics/ (Accessed: 31 July 2020).
30. Child Measurement Programme - Public Health Wales . Available at: https://phw.nhs.wales/services-and-teams/child-measurement-
    programme/ (Accessed: 31 July 2020).
31. Public Health England. Diabetes Foot Care Profiles. https://fingertips.phe.org.uk/profile/diabetes-ft. Accessed July 8, 2020.
32. Diabetes UK. Diabetes in the UK 2010: Key Statistics on Diabetes.; 2010.
33. Office for National Statistics. 2011 Census: Population Estimates for the United Kingdom, March 2011; Population estimates for the UK,
    England and Wales, Scotland and Northern Ireland: mid-2018. Accessed September 7, 2020.

30    Food Foundation | THE BROKEN PLATE 2020
Food Foundation
           The Raincloud Victoria
             76 Vincent Square
                Westminster
                  London
                 SW1P 2PD

           +44(0)20 3086 9953
         www.foodfoundation.org.uk
           @Food_Foundation

       ©Food Foundation. All rights reserved.
Reproduction in part or in whole is prohibited without
     prior agreement with the Food Foundation.

              Charity number: 1187611
You can also read