CHATHAM LODGING TRUST - COMPANY PRESENTATION September 2019
←
→
Page content transcription
If your browser does not render page correctly, please read the page content below
CHATHAM LODGING TRUST
   COMPANY PRESENTATION
        September 2019
Safe Harbor Disclosure
We make forward-looking statements in this presentation that are subject to risks and uncertainties. These forward-looking statements include information
about possible or assumed future results of our business, financial condition, liquidity, results of operations, cash flow and plans and objectives. When we
use the words “believe,” “expect,” “anticipate,” “estimate,” “plan,” “continue,” “intend,” “should,” “may” or similar expressions, we intend to
identify forward-looking statements.

Statements regarding the following subjects, among others, may be forward-looking: the terms of the proposed financing, market trends in our industry,
interest rates, real estate values, the debt financing markets or the general economy or the demand for commercial real estate loans; our business and
investment strategy; our projected operating results; actions and initiatives of the U.S. government and changes to U.S. government policies and the
execution and impact of these actions, initiatives and policies; the state of the U.S. economy generally or in specific geographic regions; economic trends
and economic recoveries; our ability to obtain and maintain financing arrangements; changes in the value of our hotel portfolio; the degree to which our
hedging strategies may or may not protect us from interest rate volatility; impact of and changes in governmental regulations, tax law and rates,
accounting guidance and similar matters; our ability to satisfy the REIT qualification requirements for U.S. federal income tax purposes; availability of
qualified personnel; estimates relating to our ability to make distributions to our shareholders in the future; general volatility of the capital markets and
the market price of our common shares; and degree and nature of our competition.

The forward-looking statements are based on our beliefs, assumptions and expectations of our future performance, taking into account all information
currently available to us. Forward-looking statements are not predictions of future events. These beliefs, assumptions and expectations can change as a
result of many possible events or factors, not all of which are known to us. If a change occurs, our business, financial condition, liquidity and results of
operations may vary materially from those expressed in our forward-looking statements. Any forward-looking statement speaks only as of the date on
which it is made. New risks and uncertainties arise over time, and it is not possible for us to predict those events or how they may affect us. Except as
required by law, we are not obligated to, and do not intend to, update or revise any forward-looking statements, whether as a result of new information,
future events or otherwise.

Included in this presentation are certain “non-GAAP financial measures,” within the meaning of Securities and Exchange Commission (SEC) rules and
regulations, that are different from measures calculated and presented in accordance with GAAP (generally accepted accounting principles). The
company considers the following non-GAAP financial measures useful to investors as key supplemental measures of its operating performance: (1) FFO,
(2) Adjusted FFO, (3) EBITDA, (4) Adjusted EBITDA and (5) Hotel EBITDA. These non-GAAP financial measures could be considered along with, but
not as alternatives to, net income or loss, cash flows from operations or any other measures of the company’s operating performance prescribed by GAAP.

                                                                               1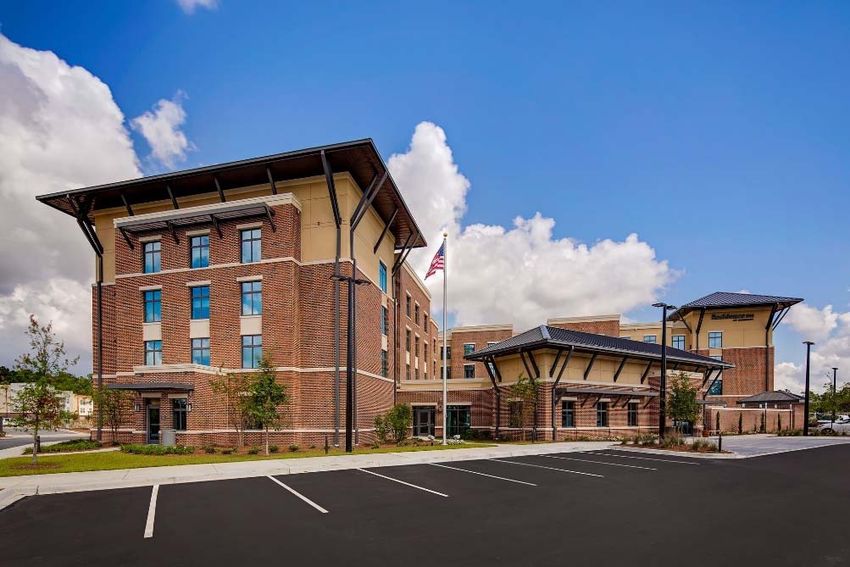
Highlights
Superior Quality Portfolio of 40 Premium-Branded,
Upscale Extended Stay and Select Service Hotels
Best-In-Class Operating Platform Generates Highest
Margins and Highest Limited Service RevPAR
Attractive Dividend Yield of ~7.3%
Accretively Recycling Capital
Recent Acquisitions of Five High Quality Hotels for $202
million
Favorable Debt Structure
Experienced Management Team with Track Record of
Generating Shareholder Value
2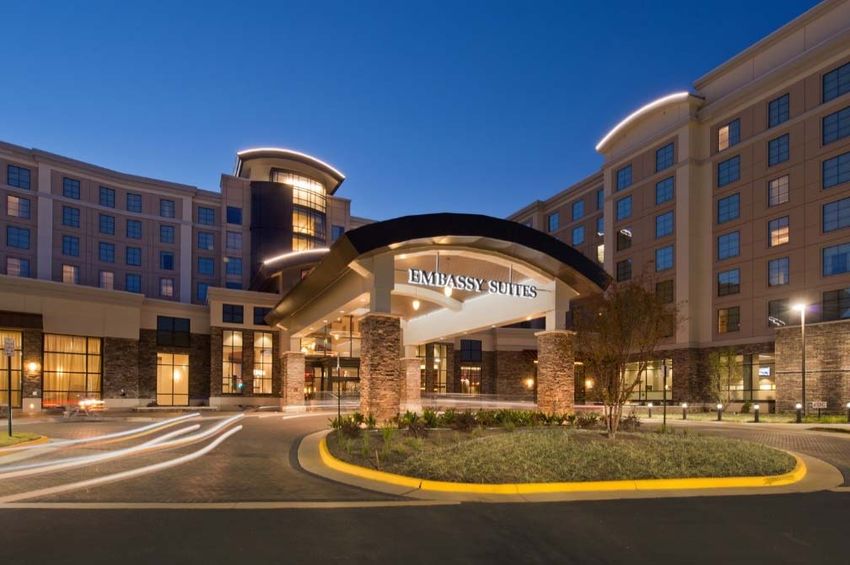
High Quality Hotels in High Quality Markets
Coastal Preference: 42% of portfolio located on the West Coast and 28% in the Northeast
2nd highest exposure to West Coast markets of all U.S. lodging REITs
Clusters of hotels in key markets enhance effectiveness of sales function and generate cost savings
Seattle (5%)
Portland, ME (2%)
New Hampshire (4%)
Minnesota (2%) Massachusetts (5%)
Connecticut (1%)
Pennsylvania (3%)
New York (5%)
Denver (4%)
PLACE
Silicon Valley (22%) Washington D.C. (9%)
PLACE
Northeast (28%)
Los Angeles (6%)
Nashville (1%)
Charleston, SC (3%)
San Diego (9%) Dallas (6%)
Houston (7%) Savannah, GA (3%)
Orlando (1%)
West Coast (42%)
San Antonio (2%) Ft. Lauderdale (2%)
Texas (15%)
_______________________
Note: Figures are rounded to the nearest whole percentage and therefore may not reflect the exact percentage. MSA/State reflects % of total undepreciated cost basis as of June 30, 2019.
3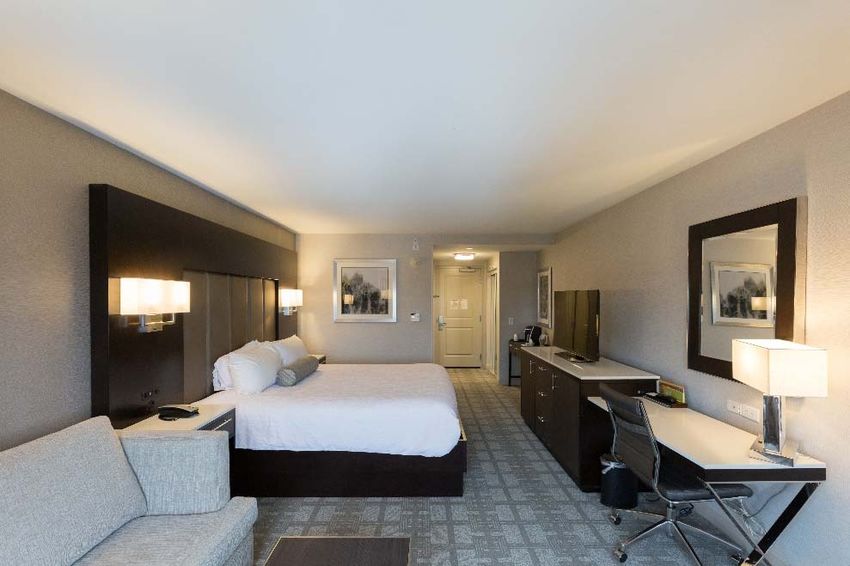
High Quality Hotels in High Quality Markets
Chatham’s superior portfolio quality is reflected by its top brands and attractive markets

                     Chatham Brands                                         Chatham Markets
            (% of LTM 6/30/19 Hotel EBITDA)                       (% of LTM 6/30/19 Hotel EBITDA)

                  Embassy SpringHill
                    4%       2%

                Hyatt
                Place                                                   Other
        Hampton 4%                                                                              Silicon
                                                                        19%
          6%                                                                                    Valley
                                                                                                 24%

      Courtyard                                          Denver
        7%                                                4%

                                       Residence        Seattle
     Hilton                               Inn            5%
                                                                                                          San Diego
   Garden Inn                            55%                                                                10%
     10%                                                 Boston
                                                          5%
                                                              Greater
            Homewood                                           NY
              Suites                                                                                      DC
                                                               6%        Los                              8%
               11%
                                                                        Angeles
                                                                         6%                 NH / ME
                                                                                  Houston
                                                                                              8%
                                                                                    7%

                                                   4
High Quality Hotels in High Quality Markets

                         5
Superior Select Service Portfolio
Chatham’s premium branded, select service hotels generate RevPAR higher than select service
brands and most full service brands
Focus on investing in great real estate in the best markets
Select Service Brands – 2018 RevPAR Full Service Brands – 2018 RevPAR
$150
$134 (1)
$132 $130
(2)
$127
$125 $125
(2)
(2)
$118 $115
Chatham’s $113 (2)
$102
Focus $101 $101
$100
PLACE
$100
$92
(2) (3)
$82 (3)
$87
$79
(3)
$75 $76
(3)
$63
$50 $51
$36
___________________________
Note: Reflects comparable system-wide RevPAR except where noted.
Note: Marriott reports a North American Upper Upscale Composite (2018 RevPAR: $132.64; includes 9 brands) and North American Limited Service Composite (2018 RevPAR: $99.29; includes 10 brands).
1. Represents comparable RevPAR as of 12/31/2018.
2. Reflects comparable Systemwide North American Properties as of 12/31/2018.
3. Reflects total Americas RevPAR.
6
Pure Play Limited Service Portfolio with High RevPAR
Chatham has the highest RevPAR of the three lodging REITs that are focused almost entirely in
the limited service segment

                 Limited Service Rooms as % of Total                                       2018 RevPAR

   100%                                                95.8%   96.3%   96.5%       $140                  $134

                                                                                                 $122
                                                                                   $120
     80%
                                                                                          $105
                                                                                   $100

     60%
                                     52.8%                                          $80
                  47.1%

                                                                                    $60
     40%

                                                                                    $40

     20%
                                                                                    $20

      0%                                                                            $0
                     HT               RLJ                INN   APLE    CLDT               APLE   INN     CLDT

___________________________
Source: Company filings and earnings announcements.
Note: 2018 RevPAR reflects Comparable or Pro Forma figures.

                                                                               7
Supply Growth In CLDT’s Markets Has Been Declining
Competitive upscale supply growth in Chatham’s market tracts has been declining over the last
two years

                                                                                        LTM Supply Growth %
  7.0%

                                                                                                                         6.0%
  6.0%
                                                                                                                  5.3%          5.2%
  5.0%

  4.0%                                                                                                                                                       3.8%
                                                                                            3.6% 3.7%

  3.0%                                                                                                                                               2.7%             2.7%

                                                                 2.0%
  2.0%                                     1.8% 1.8%                                                                                                                         1.8%
                                                                                                                                             1.6%
                                 1.3%

  1.0%                0.7%

  0.0%
                                   Industry - Overall                                                   Industry - Upscale                                  Chatham

                                                             12/31/2014             12/31/2015            12/31/2016       12/31/2017   12/31/2018

___________________________
Source: Smith Travel Research
Note: Chatham supply represents weighted average LTM upscale segment supply growth in Chatham’s market tracts .

                                                                                                                  8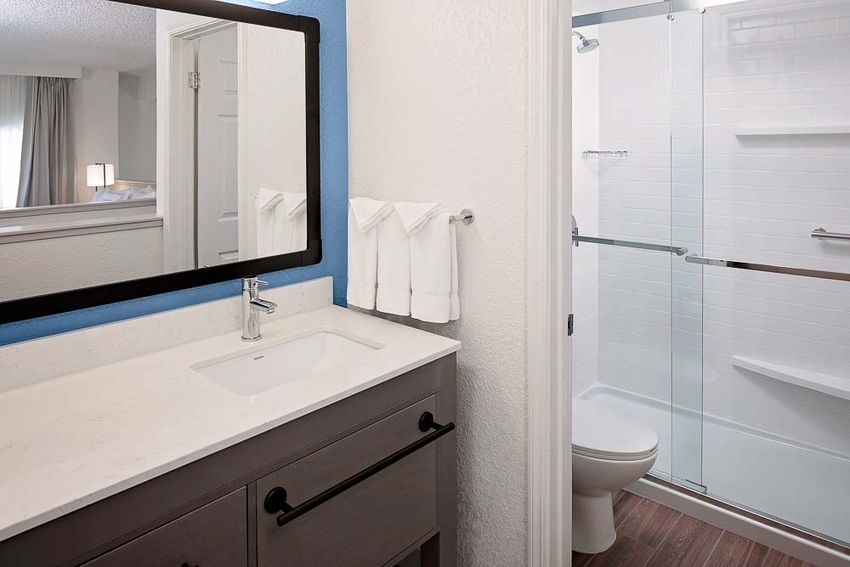
Industry Leading Hotel EBITDA Margins
Chatham’s model produces attractive RevPAR growth (premium brands in attractive markets)
with lower operating costs (select service hotels), which drives high EBITDA margins and flow-
through

                                                        Hotel EBITDA Margin (Year-Ended December 31, 2018)

   45.0%

                  39.0%
   40.0%                        37.2%          37.0%

   35.0%                                                     33.4%          33.2%          32.8%     32.4%   32.4%
                                                                                                                     31.3%    30.9%     30.3%
   30.0%                                                                                                                                             28.8%   28.8%   27.9%

   25.0%

   20.0%

   15.0%

   10.0%

     5.0%

     0.0%
                  CLDT          APLE            INN             HT           PEB               RLJ   CHSP    AHT     BHR      SHO       DRH           PK     HST     XHR

                                                                   Full-Service Lodging REITs                         Select-Service Lodging REITs

___________________________
Source: Company filings and earnings announcements. Based on Comparable / Pro Forma results.

                                                                                                        9
Attractive Common Dividend Yield
Chatham’s annual dividend has grown 89% since IPO in 2010
2019E payout ratio of 73%
Cash Dividend Yield
Full-Service Lodging REITs Select-Service Lodging REITs
9.0%
7.9% 7.7%
8.0% 7.5% 7.4% 7.4% 7.3% 7.3%
7.0% 6.6%
6.0%
6.0%
5.3%
5.1% 5.0% 5.0% 4.9%
5.0%
4.4%
4.0%
3.0%
2.0%
1.0%
0.0%
PK AHT RLJ CPLG HT APLE CLDT BHR INN PEB XHR DRH SHO HST RHP
___________________________
Source: Company fillings and FactSet.
Note: Based on closing stock prices as of 9/132019. Declaration of dividends are at board’s discretion.
10Accretively Recycling Capital
Chatham is actively pursuing and executing opportunities to enhance its portfolio quality and
generate value by accretively recycling capital
Key objectives of Chatham’s capital recycling strategy include:
Selling hotels where we believe value has been maximized
Slower RevPAR growth, older, higher risk of new supply, potentially significant capital needs, attractive valuations
/ lower yields than other investment opportunities
Sold Homewood Suites Carlsbad for $33 million in December 2017 and sold Courtyard Altoona / SpringHill Suites
Washington PA for approximately $10 million in May 2019
Acquiring hotels that we believe have significant upside
Higher RevPAR growth, newer, limited capex requirements, attractive valuations / higher yields, accretive to
portfolio quality, value and FFO/share
$43.5 million acquisition of Hilton Garden Inn Portsmouth, NH in September 2017, $20.2 million acquisition of
Courtyard Charleston Summerville, SC in November 2017; $68.0 million acquisition of Embassy Suites
Springfield / Washington DC in December 2017; $20.8 million acquisition Residence Inn Charleston Summerville
SC in August 2018; $49.0 million acquisition of Courtyard Dallas Downton in December 2018
Selectively expanding existing hotels / developing new hotels
New assets, superior markets / locations, higher returns than acquisitions, opportunities to utilize existing excess
land, potential synergies with existing Chatham hotels (ie shared GMs / sales teams)
$9 million 32-room expansion of Residence Inn Mt. View generated over 13% cash on cash return in first full year
of operation
Developing new hotel in Warner Center area of Los Angeles
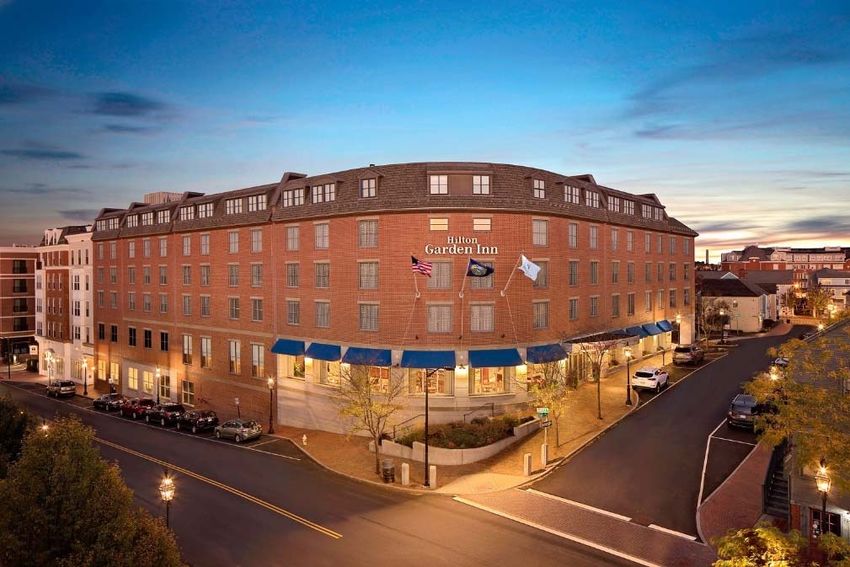
11Hilton Garden Inn Portsmouth Acquisition
Chatham acquired the 131 room Hilton Garden Inn
Portsmouth, NH for $43.5 million on September 20, 2017
Purchase price equates to $332k per room
Ideal location in center of downtown Portsmouth
Significant barriers to new supply
Strong and balanced demand from corporate, leisure and
government
Portsmouth Naval Shipyard employs approximately
7,000 people
Pease International Tradeport is a world class office
and industrial park with 250 companies / 10,000
employees
High quality property built in 2006 and fully renovated
within last two years
Very limited capital needs before 2022
2018 RevPAR of $161 makes this one of Chatham’s
highest RevPAR hotels
12Courtyard and Residence Inn Charleston Summerville
Acquisitions
Chatham acquired the 96 room Courtyard Charleston
Summerville for $20.2 million on November 15, 2017 and
the 96 room Residence Inn Charleston Summerville for
$20.8 million on August 27, 2018
Purchase price of $210k per room for Courtyard and $217k
per room for the Residence Inn
Located just outside Charleston in the highly anticipated and
rapidly growing new mixed use community of Nexton
Nexton development is expected to include ~10k homes,
8 mm sq. ft. of commercial space, and a medical campus
Charleston MSA is rapidly expanding:
Volvo recently completed its $500mm manufacturing
center, which is its first American factory, and will begin
delivering cars by early 2019
̶ Announced plans for a second production line
scheduled to be completed in 2020
Boeing and Daimler have major facilities in the North
Charleston area and are looking to expand operations
High quality properties built in 2014 and 2018 far exceed
brand standards due to strict requirements of Nexton
Virtually no expected capital needed for several years
13Embassy Suites Springfield Acquisition
Chatham acquired the 219 room Embassy Suites
Springfield for $68.0 million on December 6, 2017
Purchase price equates to $310k per room
The Embassy Suites is a very high quality, four year old
hotel that has been ranked the #1 Embassy Suites in the
brand the last two years
The hotel is located in a fast growing area of Fairfax
county about 15 miles SW of metro Washington, D.C.
with strong demand from both government and
government related corporate clients
The Springfield Market is expected to outperform over
next several years due to strong and growing demand and
limited supply
Fort Belvoir (5th largest military base in the country) is
located two miles from the Embassy Suites
The National Geospatial-Intelligence Agency’s main
campus is located a mile from the hotel
The TSA recently announced the relocation of its
headquarters to a site two miles from the Embassy
Suites by August 2020
14Courtyard Dallas Downtown Acquisition
Chatham acquired the 167 room Courtyard Dallas
Downtown for $49.0 million on December 5, 2018
Purchase price equates to $293k per room
Located two blocks from the Kay Bailey Hutchison
Convention Center in the fast growing downtown Dallas
market
High quality newly built hotel that opened in September
2018; first newly built hotel in downtown Dallas market
since 2011
Attractive mix of convention, corporate and leisure
demand
Kay Bailey Hutchison Convention Center is sixth
largest convention center in U.S. and generates more
than one million annual room nights of demand
Downtown Dallas is home to eight Fortune 1,000
corporate headquarters including AT&T, Tenet
Healthcare, Jacobs Engineering and HollyFrontier
Numerous arts, sports, entertainment and music venues
in downtown Dallas
15Renovated Silicon Valley Rooms
Chatham is in the process of renovating its Silicon Valley
hotels
Residence Inn Mountain View completed Q1 2018
Residence Inn Sunnyvale I completed Q1 2019 (pictured)
Residence Inn San Mateo renovation commenced Q2
2019
Residence Inn Sunnyvale II renovation commences Q4
2019
Upgraded room product is expected to enhance the
competitiveness of these hotels
162019 YTD Financial Performance
Chatham has produced solid financial results in the context of significant renovation activity in
2019 and limited overall industry RevPAR growth
Chatham YTD 6/30/19 Financial Results Chatham YTD 6/30/19 RevPAR in Largest Markets
8.0%
Comparable RevPAR -0.7%
4.8%
Total Revenue +3.4% 2.7%
0.5%
Adjusted EBITDA +2.7%
Hotel EBITDA +2.4%
Comparable Hotel EBITDA Margins -0.3% -7.3%
Silicon San Diego Washington NH / ME Houston
Valley DC
172019 Outlook
Company Guidance
($ in millions, except per unit data)
Projected Financials 2019E
Portfolio RevPAR $133 - $134
Portfolio RevPAR Growth (2.0%) - (1.0%)
Hotel EBITDA Margin 37.9% - 38.2%
Cash G&A $9.5
Adjusted EBITDA $127.7 - $131.0
Adjusted FFO / Share $1.77 - $1.84
JV EBITDA (Chatham's Share) $15.9 - $16.5
___________________________
Source: Company filings. Please refer to the Company earnings release on 7/31/2019 for additional details.
18Summary Capitalization
Capitalization Highlights
($ in millions) 6/30/2019
Weighted average cost of debt is 4.6%
Share Price (as of 9/13/19) $18.13
Common Shares and Units 47.4 86% of debt outstanding is fixed rate
Market Capitalization $859.0 Refinanced $250 million credit facility in March 2018
Unsecured Revolving Credit Facility 79.0
Extended maturity to 2023, reduced borrowing cost
Mortgage Debt (net of deferred financing cost) 499.4
Total Consolidated Debt $578.4 Weighted average fixed rate debt maturity of
Less: Unrestricted Cash (10.8) approximately 4.5 years
Net Debt $567.6
No debt matures before 2021
Plus: Share of Non-Recourse JV Net Debt 161.9
Fixed charge coverage of 3.2x
Enterprise Value $1,588.5
Consolidated Debt Maturity Schedule
($ in millions) Undrawn Unsecured Revolving Credit Facility
$500
$400
$300 $171
$200
$321
$228
$100
$13 $18
$0
2019 2020 2021 2022 2023 2024 2025
--% --% 2% --% 39% 55% 3%
___________________________
Sources: Company filings and announcements.
Note: Debt maturity schedule represents principal balances only and excludes unamortized debt issuance costs. Assuming exercise of extension option, RCF matures in 2023.
19You can also read