Computational timbre and tonal system similarity analysis of the music of Northern Myanmar-based Kachin compared to Xinjiang-based Uyghur ethnic ...
←
→
Page content transcription
If your browser does not render page correctly, please read the page content below
Computational timbre and tonal system similarity analysis of the music of
                                           Northern Myanmar-based Kachin compared to Xinjiang-based Uyghur
                                                                      ethnic groups
                                                                              Rolf Bader, Michael Blaß, and Jonas Franke
                                                                                      Institute of Musicology
                                                                                      University of Hamburg
                                                                            Neue Rabenstr. 13, 20354 Hamburg, Germany
arXiv:2103.08203v1 [cs.SD] 15 Mar 2021

                                                                                                 March 16, 2021

                                                                                                      Abstract

                                                The music of Northern Myanmar Kachin ethnic group is compared to the music of western China, Xijiang based
                                             Uyghur music, using timbre and pitch feature extraction and machine learning. Although separated by Tibet, the muqam
                                             tradition of Xinjiang might be found in Kachin music due to myths of Kachin origin, as well as linguistic similarities, e.g.,
                                             the Kachin term ’makan’ for a musical piece. Extractions were performed using the apollon and COMSAR (Computational
                                             Music and Sound Archiving) frameworks, on which the Ethnographic Sound Recordings Archive (ESRA) is based, using
                                             ethnographic recordings from ESRA next to additional pieces. In terms of pitch, tonal systems were compared using
                                             Kohonen self-organizing map (SOM), which clearly clusters Kachin and Uyghur musical pieces. This is mainly caused by
                                             the Xinjiang muqam music showing just fifth and fourth, while Kachin pieces tend to have a higher fifth and fourth, next
                                             to other dissimilarities. Also, the timbre features of spectral centroid and spectral sharpness standard deviation clearly
                                             tells Uyghur from Kachin pieces, where Uyghur music shows much larger deviations. Although more features will be
                                             compared in the future, like rhythm or melody, these already strong findings might introduce an alternative comparison
                                             methodology of ethnic groups beyond traditional linguistic definitions.

                                           Keywords:                                                           narratives of a common origin of Kachin with northern
                                           Computational Ethnomusicology, Machine Learning,                    ethnic groups, like the Mongols, as collected in several
                                         Timbre extraction, Tonal System                                       field trips of the first author in these regions over the last
                                                                                                               about ten years. Still, as the word for ‘song’ in Kachin is
                                                                                                               makan, a word very close to maqam, or Xinjiang muqam,
                                         1    Introduction                                                     the music tradition of Central Asia, the comparison with
                                                                                                               Uyghur pieces is performed first in the paper. Further
                                         The definition of ethnic groups in many countries in                  studies will include a comparison with Mongol music and
                                         Southeast Asia or China has been performed using lin-                 with regionally much closer music of the large ethnic di-
                                         guistic terms. In China, e.g., to constitute the VIII. Na-            versity found in Yunnan, southwestern China.
                                         tional Congress in 1956 in which all ethnic groups should                The paper first describes the music of both groups
                                         be represented, anthropologists were sent to field trips de-          briefly. After discussing the methodology and the descrip-
                                         termining ethnic groups along common words 30 . Deciding              tions of the features used, the result section presents dis-
                                         about similarities in ethnic groups in terms of music has             similarities, next to similarities between the two groups.
                                         been proposed based on musical features, mainly analyzed
                                         ’by hand’. Alan Lomax introduced cantrometrics 26 , com-
                                         paring the singing styles of music from all over the world            2     Music of the Kachin
                                         along with a long list of features like homophonic / poly-
                                         phonic, intense or calm singing, etc. Also, the relation              Kachin State is the most northern state in today’s Myan-
                                         between ethnic groups in terms of music was found closer              mar, with Myitkyina as its capital. The word ’Kachin’
                                         to gene expression when compared to linguistics 9 .                   was mainly coined by the Bama majority in Myanmar,
                                            This paper tries to compare the music of two ethnic                while the Kachin consider themselves as belonging to the
                                         groups, the northern Myanmar Kachin and the west-                     ethnic groups of Jinghpaw 33 . Still, other groups like the
                                         ern Chinese Uyghur ethnic groups, using Music Informa-                Lisu, Rawang, Lashi, Zai-Wa, or Maru might also consider
                                         tion Retrieval (MIR) extracted features trained in self-              themselves Kachin when comparing themselves with other
                                         organizing Kohonen maps (SOM). The reasons for com-                   regions in Myanmar or with the Bama.
                                         paring the two groups are linguistic and political Kachin               Music is also performed by traditional instruments like

                                                                                                          1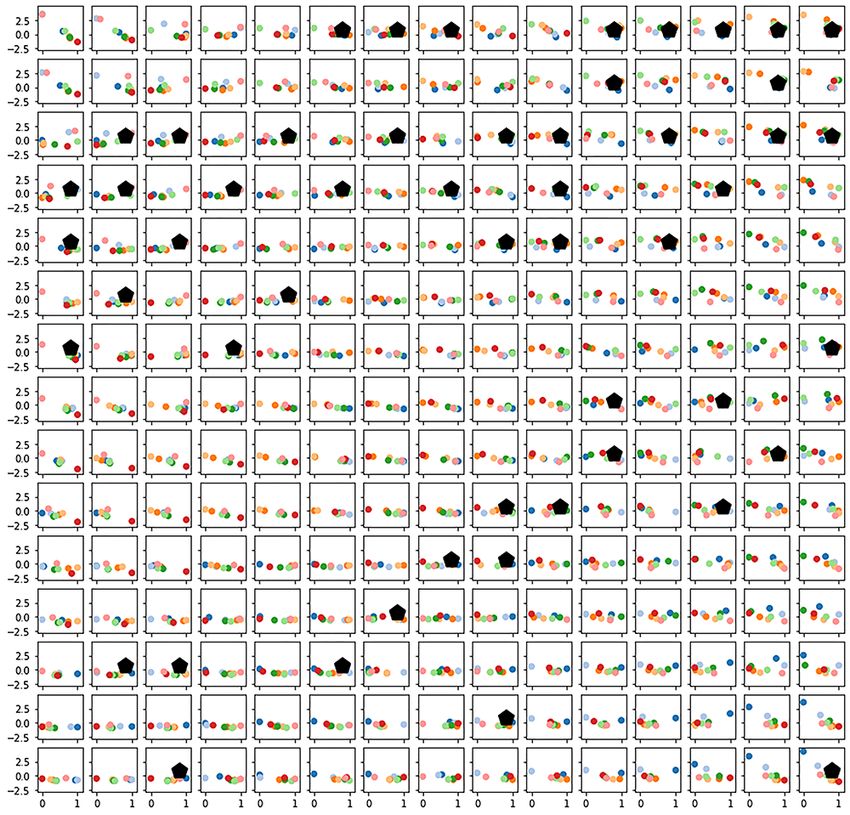
the sum pyi (bamboo flute) or the dum ba (double-reed               4     Method
wind instrument). An important ensemble is the wun-
pawng band (music band), a marching band playing at                 4.1    Music collections
weddings, funerals, house opening ceremonies, the Manaw
festival, each first Sunday at the local Baptist church,            Field recordings of the first author between 2013-2019 in
as well as church events like thanksgiving. Plucked and             Kachin state were used as the Kachin sample. According
bowed stringed instruments are called tschibu. The Jews             to the criteria discussed below, 69 pieces were used.
harp is also played, a tradition found in Southeast Asia for           The pieces from Kachin region were recorded using
lovers to relate songs with meaning only the lovers know.           many different setups in terms of microphones, recording
When playing the melody in public, secret messages could            venues, post-processing ,and the like. Some field record-
be sent.                                                            ings in the collection have been done using a four-channel
   Playing Western guitar is very popular among young               field recorder, with four microphones recordings simulta-
Kachin. Western instruments can be bought at a local                neously, where in the end the recording was chosen with
shop in Myitkyina, together with Western electric bass or           the least reverberation, broad-band spectrum, and lowest
Rock drum kits. As Rock music in Myanmar is very pop-               noise. Such recordings, although performed in the forest
ular since the 80th 29 , for many in their teens a hope is to       or jungle, are equivalent to studio recordings due to the
become rich and famous, especially among Christian mi-              high quality of A/D converters and microphones as well as
norities like the Kachin. They often got a solid education          very good microphone positioning. Still, other recordings,
in Western music and performing Western musical instru-             especially those during dancing, the gathering of many
ments, mainly guitar, organ, and singing, through Bible             people, or during the need of strong alcohol consumption
schools.                                                            by the fieldworker, are of less quality 24 . Sometimes infor-
   More contemporary music was raising with DJ and club             mants or musicians insist on performing in very reverber-
culture, mainly in Yangon. Experimental music is still              ant spaces, like churches or gathering halls, because they
very rare in Myanmar 17 .                                           consider the room acoustics there best, although, from an
                                                                    analysis standpoint, this is not the optimum choice as it
                                                                    blurs articulation and dynamics. Indeed there is no ob-
                                                                    jective point for recording such music and in all cases, the
3    Music of the Uyghur                                            most reasonable choice was selected. So, e.g., church mu-
                                                                    sic with heavy reverberation is included, as this is what
The muqam of Uyghur people living in western China Xin-             all participants in the ceremony are hearing.
jiang Aotonomous Region was traditionally taken as part                On the other hand, commercial recordings of typical
of the shashmaqam tradition of Central Asia, which was              ethnomusicological content often are also not recorded un-
shown to be a canonic construction, where local traditions          der the best conditions. Sometimes these are the field
may deviate strongly 19 . Still, many musical instruments           recordings of ethnomusicologists. Sometimes they are
are clearly of Central Asian origin 25 . Long-necked plucked        recorded in studios with inferior technical equipment com-
instruments include the two-stringed dutar, three-stringed          pared to that a contemporary fieldworker carries with him.
satar, two-necked diltar, or the tambur. Several rawab              Many of these recordings are mono or only slightly stereo.
forms, similar to those known from Usbekistan, are from             Therefore, a four or even eight-track recording with a
Dolan, Kashgar, or Kumul tradition, as well as a shep-              portable field recorder, placing each microphone close to
herd and a bass type. There is a barbab, similar to the             several instruments, e.g., in a pat wain, gamelan, or mo-
Chinese pi’pa. Bowed instruments include the ghirjek (in            hori orchestra leads to a high source separation already
various forms like the kumul, dolan, or ancient, as well as         in the recording very useful for further analysis. Even the
bass-ghirjek), or the bowed qushtar (with bass qushtar).            official muqam recordings used in this investigation dis-
The chang and the qalun are dulcimers. A surnay is used,            tributed via Video-Discs have a very low sound quality
clearly derived from the Turkish zurna. Flues include a             which is often heavily distorted.
nay and a baliman. Also, a horns called burgha duduk or                With commercial Pop, Rock, Hip-Hop, K-Pop, or such
spaya, a trumpet karnay, or a jews harp qowuz are played.           recordings, the final mix released seems to be more pre-
A dap frame drum, a naghara or tabilwas drums next to               cise at first, as in the mixing and mastering studio, the
several percussion instruments are used, like sticks, gongs,        sound is manipulated in many ways. Here we can expect
cymbals, stones, or wooden spoons.                                  the sound to precisely be wanted by the musicians. In-
   The tonal system of Uyghur music is mainly described             deed, this is again often not the case because of many
as showing no microtonality, different from many maqam              reasons. The loudness war of heavy compression added
traditions 19 . Below the comparison of tonal systems is            during the mastering session is mainly enforced by pro-
performed, where this is basically confirmed.                       ducers and considered very critical by musicians. Also,
   Timbre in Uyghur music is reported to be of importance           most music is streamed as MP3, which is a lossy format.
when concatenating sung ghazals, short lyrics mainly                Although with 192 kBit streaming quality with medium
lament on the unfulfilled love to God. The ghazal con-              quality playback equipment and in medium loudness level,
tent is not so important as the vowels the lyrics contain,          a normal consumer is not able to distinguish it from a
which need to fit the melody sung 23 .                              lossless format like PCM Wave or FLAC, with increased

                                                                2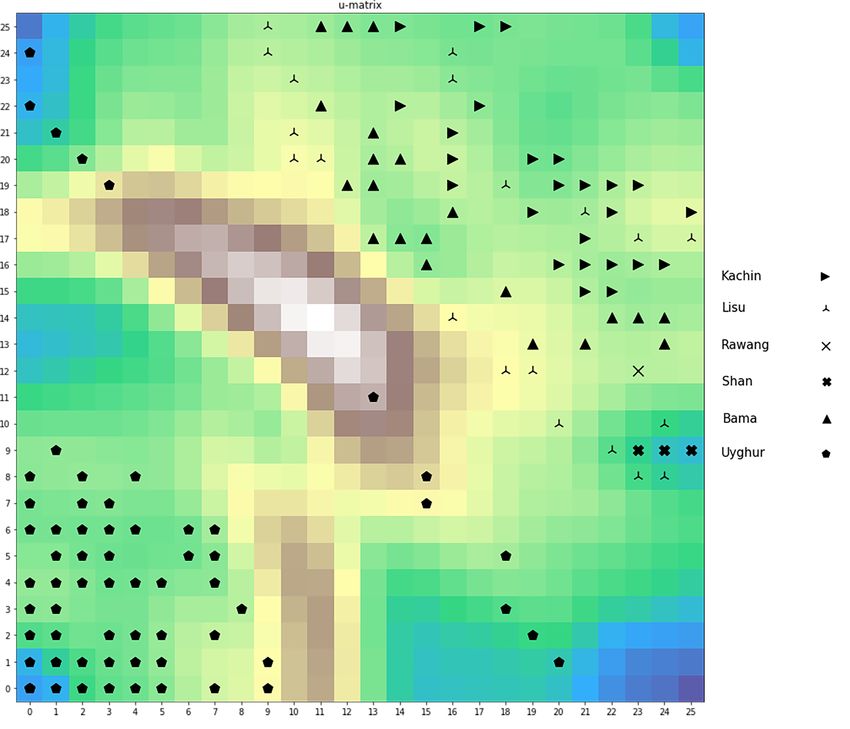
loudness, the difference is indeed considerable. The use of        mostly solo voice accompanied by a single instrument. Al-
playback equipment, in general, is also blurring the idea of       together 63 Uyghur pieces were used.
a commercial recording having a decisive timbre. When                 To arrive at a more widespread field in terms of ethnic
mixing a musical track in a recording studio, often two            groups of interest, the two ethnic groups are framed within
kinds of reference loudspeakers are used, a high-end main          a larger sample of songs from Southeast Asia, China, Sri
monitor and a very low-end stereo setup. The finding is            Lanka, and Nepal. Still, as the scope of this paper is to
that although a piece might sound fantastic with high-end          compare Kachin and Uyghur pieces, the results concen-
speakers, it still might sound bad with low-level playback         trate on their relations only.
equipment, as cheap in-ears, headphones, car sound sys-
tems, or the like. Maybe indeed most music today is heard          4.2       Feature Extraction                   and       Machine
about in-ears or headphones instead of loudspeakers.
                                                                             Learning
   So there is no reference timbre we can rely on. On the
other hand, the psychoacoustically relevant features 34 35         The musical pieces are analyzed with respect to timbre
are so robust that we expect them to survive all these             and tonal system. The analysis is two-step.
changes. A guitar sounds like a guitar, no matter which
microphone we use for recording or which playback en-               1. In a first step, using algorithms of Music Information
vironment to listen to this recording. Music with chang-               Retrieval (MIR), features are extracted.
ing loudness, roughness, or sharpness over its performance          2. In a secon step, using a Kohonen self-organizing map
is reflected in all these parameters. Musical pitches,                 (SOM), the extracted feature vectors arrange in a
rhythms, etc., are maintained too. To turn it the other                two-dimensional neural field, displaying clusters.
way around, if music is recorded or presented in a way it
does no longer meet these parameters, we would no longer              Investigating what is different in the music of ethnic
consider them as valid recordings or presentations. This           groups does include determining what is similar. All
can be judged by ears, and therefore recordings not suit-          methods used show both the similar and the dissimilar.
able for a study have been excluded.                               Comparing different musical styles can therefore be per-
   Although the first author also did fieldwork in Xinjiang        formed qualitatively, as well as quantitatively. Ending in
among the Uyghur people, not enough recordings were                one judgment how far away the music of two ethnic groups
collected to have a reasonable comparison. Therefore the           is is not the aim of this paper. It is rather to give insights
Uyghur pieces were collected from these recordings:                into details. Such a judgment would include a decision
                                                                   which features to take for such a judgment, how to weight
  • Uighur Autonomous Region Song and Dance Ensem-                 them, and how to combine them to arrive at a single value.
    ble, King Records, 1991 (instruments: rewap, bala-             If this is reasonable to do might be discussed elsewhere.
    man, dutar, tambur, dombura, tambourine, voice,
    ghijak, husitar, rawap, satar, ajek, dap)
                                                                   4.2.1      Timbre similarity
  • Sanubar Tursun, Felmay, Italy, 2013 (instruments:              There are two kinds of analysis, a forward and a backward
    Voice, tambur, satar, dutar).                                  or inverse analysis. In the forward analysis, musical pieces
  • Collected by Laurent Jeanneau, Shi Tanding, Sub-               are analyzed with features chosen from a feature set and
    leme Frequencies, 2009 (instruments: dongbra, tam-             sorted in the SOM. There are two decisions to make, a)
    burg, voice, dotar, satar, ,omuz, rawa, topchar,               which musical pieces to analyze, and b) which features
    tschang)                                                       to use. Depending on these choices, the SOM similarity
                                                                   estimation is different.
  • Qetik, Taklamakan Rock, Dreyer Gaido Musikpro-                    The inverse or backward analysis is going the same
    duktionen, 2013 (instruments: Vocals, guitar, dumb-            way back1 . Starting from a research question with an
    ura, keyboards, drums, bass).                                  intended SOM result, like separating musical pieces in a
                                                                   two-dimensional map, those pieces and audio features are
  • muqäddimä of 12 muqam of the China Uighur Twelve             chosen, which arrive at this estimation. Still, there is no
    Muqam Symposium 10 recordings of the Uighur Au-                strict proof that this is a global maximum, the optimum
    tonomous Region, Song and Dance Ensemble.                      choice. Still, if we arrive at a clustering, we have found
                                                                   relevant psychoacoustic parameters separating the musi-
   The Uighur Autonomous Region Song and Dance En-
                                                                   cal corpora.
semble was the official state ensemble located in Ürümqi.
                                                                      In this paper, the reasoning for inverse solving is that of
The recordings of Sanubar Tursun are mainly voice and a
                                                                   psychoacoustics. Within the last about 150 years, starting
single instrument. The collection of Laurent Jeanneau and
                                                                   from Helmholtz’s idea of perceptual roughness as the ba-
Shi Tanding include various artist. The Qetik recording
                                                                   sis for musical scale 20 , psychoacoustic research has exten-
is Rock music with many traditional components. The
                                                                   sively been performed, and most salient timbre features
12 muqäddimä are taken from the official release of the
                                                                   perceived by listeners all over the world, and respective
Uighur Song and Dance Ensemble, which covers twelve
                                                                   analyzing MIR algorithms are known. Discussing these
CDs (VCDs) of the canonical 12 muqam. From each the
introduction section, the muqäddimä, was taken which is            1 For   a systematic description of Inverse Problems, see 18 .

                                                               3
parameters in detail is beyond the scope of this paper, for             minimum length a pitch event needs to have, here 30 ms,
reviews see 34 35 7 .                                                   and a maximum allowed cent deviation, here ± 60 cents.
                                                                        This allows for including vibrato and pitch glides within
4.2.2    Tonal system similarity                                        about one semitone, often found in vocal and some instru-
                                                                        mental music. With flues, often very straight pitches were
Tonal systems are most often understood as a small set                  found. Still, these pitches might be different at different
of cent values, pitches of a musical piece, located within              parts of the piece. Lowering the allowed deviation leads
one octave. Still, performance practice leads to a vari-                to to the exclusion of pitches that often have quite strong
ety of pitches used for played notes. Therefore, in this                deviations. As an example, an excerpt of 13 seconds of a
study, tonal systems are taken as histograms of all pitches             Lisu solo flute piece is shown in Figure 1 on the top left.
performed in musical notes, accumulated in 1 cent inter-                Some pitches show a quite regular periodicity, some are
vals within one octave, resulting in 1200 cent values. This             slurs or grace-notes.
definition includes all deviations, vibrato, melismas to a                 The third abstraction stage determines single pitches
certain extend, or different pitches presented at different             for each detected event by taking the strongest value of a
occurrences of a note. As shown in the result section, this             pitch histogram. As can be seen in the top left Figure,
approach clusters the music investigated in this study.                 pitches are often stable, only to end in some slur in the
                                                                        end. Therefore, taking the mean of these pitches would
4.3     Music Information Retrieval (MIR)                               not represent the main pitch. Using the maximum of a
                                                                        histogram, on the other side, detects the pitch most fre-
        analysis
                                                                        quency occurring during the event. On the bottom left,
The analysis is performed with the apollon 1 framework                  this is performed and can be compared to the top left plot.
of the Computational Music and Sound Archiving (COM-                    When listening to the piece, this representation seems to
SAR) 12 project at the Institute of Systematic Musicology               contain still too many pitch events. So. e.g., the events
at the University of Hamburg 4 12 . It is implemented as                around 6000 cents (above fmin = 27.5 Hz) are clearly per-
an online version in the Ethnographic Sound Recordings                  ceived as notes. Still, those small events preceding around
Archive (ESRA) 15 of historical and contemporary music                  6200 cents are heard as grace-notes. Therefore, to obtain
ethnological recordings at the Institute (The 1932 Cairo                a melody without grace-notes, a fourth stage needs to be
Congress of Arab Music, Collectin Wilhelm Heinitz of                    performed.
African Music, Collection Bader). It can also be used as                   In this fourth stage, pitch events are selected using
an offline tool in a jupyter notebook browser environment               three constraints to qualify as melody notes allow for
based on Python programming language.                                   n-gram construction. n-grams have shown to represent
   In apollon and COMSAR many analysis tools for tim-                   melodies stable and robust in terms of melody identifica-
bre, rhythm, tonal system, or melody are implemented.                   tion 13 . Still, no n-gram melody SOM is constructed, as
All of them take the digital or digitalized recordings as               detecting melodies from polyphonic pieces is not covered
input. We restrict our presentation to only those features              by autocorrelation algorithms. The amount of single-line
used in the present paper, i.e., melody, tonal system, and              pieces in the Kachin music collection was too small to al-
timbre.                                                                 low comparison with other ethnic group music. Still, note
                                                                        detection needs to be performed detecting tonal systems,
4.3.1    f0 estimation and note detection                               as the pitch values calculated by autocorrelation also in-
                                                                        clude transients, pauses, or other non-pitch events.
All pieces are analyzed in terms of pitch. Five levels of                  To qualify as a note, excluding grace-notes, slurs, etc.,
abstraction are performed, as shown for the example of a                the notes need to have a minimum length, here 100 ms.
Lisu solo flute piece in Figure 1 2 .                                   Additionally, a lower and upper limit for adjacent note in-
  In a first analysis stage, f0 extraction is performed, with           tervals is applied for n-gram construction. The lower limit
overlapping frames of 25 ms resulting in 100 f0 values                  is 0 cent here to allow tone repetition, especially expected
per second using an autocorrelation algorithm 38 27 , allow-            for Uyghur pieces. The upper limit was set to ± 1200 cent,
ing a minimum frequency of 40 Hz. The f0 values are                     so two octaves, most often enough for traditional music.
transferred into cent values, starting at fmin = 27.5 Hz,               This does not mean that traditional pieces do not have
the subcontra A and allowing eight octaves above fmin ,                 larger intervals, as, e.g., expected in jodeling. Still, such
which is more a theoretical choice as higher octaves are                techniques are not used in the present music corpus, and
way above pitches used in traditional music.                            even when present, they are not expected to be more fre-
  The second abstraction stage uses an agent-based ap-                  quent than smaller intervals. Indeed, small intervals are
proach, where musical events, notes, grace-notes, slurs,                most prominent in traditional music, as also confirmed in
melismas, etc., are detected. The agent follows the cent                the present study. In Figure 1 top right, we see the pitch
values from the start of each musical piece and concate-                contours for all allowed notes used in n-gram calculation.
nates adjacent cent values according to two constraints, a              Indeed, all grace-notes are gone.
  2 ESRA   index 626https://esra.fbkultur.uni-hamburg.de/explore/
                                                                           In the last step, shown in the bottom right plot, the
view?entity id=626, https://vimeo.com/showcase/5259277/video/           pitches of each event are again taken as the maximum of
278497941                                                               the historgram of each event. Now following the musical

                                                                    4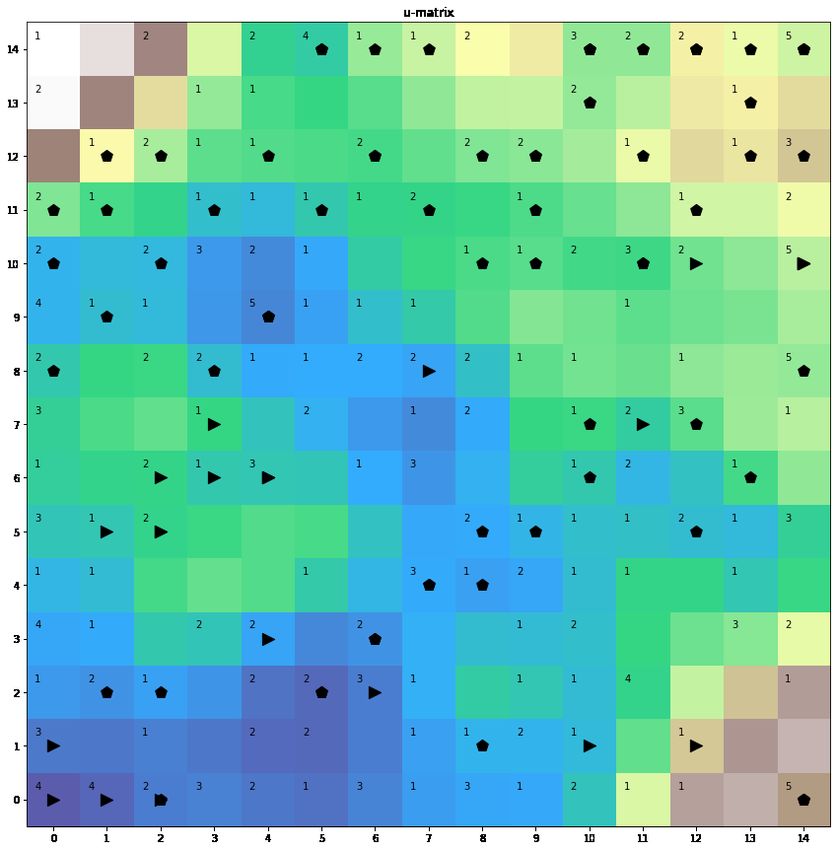
a singer is accompanied by a dutar, or a strong melody
                                                                      instrument is overwhelming an ensemble. Although when
                                                                      a real polyphonic texture is present, the algorithm fails,
                                                                      for some part of the piece it calculates performed pitches.
                                                                      Therefore, in the tonal system analysis, those pieces which
                                                                      show correct melodic fragments were included in the sam-
                                                                      ple. The note identification algorithm discussed above en-
                                                                      sures that only these correct pitches are used in the tonal
                                                                      system analysis. If a piece showed too few such cases, it
                                                                      was excluded.

                                                                      4.3.3   Timbre
                                                                      All timbre features use a Fourier Transform to analyze
Figure 1: Example of pitch and melody extraction using                the sound in adjacent, non-overlapping frames of 80 ms.
  Lisu flute solo, ESRA index 626https://esra.fbkultur.               The analyzed discrete spectrum Ai with amplitude A and
     uni-hamburg.de/explore/view?entity id=626. The                   N frequency entries fi is then further processed in using
analysis has five stages of abstraction. 1) f0 is calculated          four features. Here i is used as the vector bins, which
over the whole piece. From f0 values to melodies: 2) top              map into frequency values through the sample frequency
left: Pitch contours of detected notes, 3) top right) pitch           s and the analysis window length l in samples like fi = i
    contour of notes allowed for n-grams (melodies), 4)               / (l / s). The choice of the parameters is motivated by
 bottom left: mean pitches of allowed notes from plot 2)              psychoacoustics, as discussed above.
 still showing grace-notes, 5) bottom right: mean pitches               Spectral Centroid
               of notes allowed for n-grams.                            The spectral centroid C is the center of a spectrum,
                                                                      where the sum of amplitudes of frequencies above and
                                                                      below this center are equal, and is calculated as
piece aurally, the events represent the melody.
                                                                                                PN
4.3.2   Tonal System                                                                                     fi Ai
                                                                                           C = Pi=0
                                                                                                 N
                                                                                                                 .             (1)
Since the proposal to calculate tonal systems using pitch                                           i=0   Ai
and cent values 14 this method was widely used to deter-                 This corresponds to psychoacoustic brightness percep-
mine the tuning of musical instruments. Gamelan tunings               tion.
in gong kebyar tended to sharper intervals over the course               Roughness
of the 20th century 40 . In listening tests, it was found that           Roughness calculations have been suggested in sev-
by varying the tuning of gamelan, the original tuning was             eral ways (for a review, see 36 , 7 .). Basically, two algo-
considered most suitable, although iz shows a maximum                 rithms exist, calculating the beating of two sinusoidals
roughness 41 . Historical development of tuning systems               close to each other (Helmholtz 20 , Helmholtz/Bader 36 ,
was shown for Burmese music, including so-called neural               Sethares 37 ), or integrating energy in critical bands on the
intervals also influenced by Thai music 42 . In a survey of           cochlear (Fastl 43 , Sottek 39 ). The former has been found
tuning systems, a preferred interval of around 170 cents              to work very well with musical sounds, the latter with
was found for tonal systems in Southeast Asia, which cor-             industrial noise.
responds to the interval of a 7-tone equidistant scale 28 .
                                                                         In this paper, a modified Helmholtz/Bader algorithm
Automatic Indian Rāga estimation has been performed
                                                                      is used. Like Helmholtz, it assumes a maximum rough-
based on pitch estimation 21 11 . Taking musical instru-
                                                                      ness of two sinusoidals at 33 Hz frequency difference. As
ment building and performance practice into considera-
                                                                      Helmholtz did not give a mathematical formula how he did
tion, it was argued that tonal systems in Southeast Asia
                                                                      calculate roughness, according to his verbal descriptions,
are temperaments, just like in Western music, compro-
                                                                      a curve of the amount of roughness Rn is assumed between
mises between musical instrument building, performance
                                                                      two frequencies with distance dfn which have amplitudes
practice, and harmonic intervals 5 .
                                                                      A1 and A2 like
   A tonal system in this study, therefore, is the accumu-
lation of all f0 values transferred into cent of all notes, ex-                                    |dfn | −|dfn |/fr
tracted as discussed above, within one octave. The lowest                            Rn = A1 A2          e           .         (2)
                                                                                                  fr e−1
frequency of this octave is the peak of all f0 values accu-
mulated over eight octaves, starting from fmin = 27.5 Hz.               with a maximum roughness at fr = 33 Hz. The rough-
A precision of 1 cent is used to arrive at a tonal system             ness R is calculated as the sum of all possible sinusoidal
vector of 1200 entries.                                               combinations like
   Contrary to melody extraction, which can only be rea-                                           N
sonably performed for single-line melodies, tonal systems
                                                                                                   X
                                                                                             R=          Ri .                  (3)
can also be extracted from some musical pieces where, e.g.,                                        i=1

                                                                  5
The only difference between the algorithm used in apol- Still, the algorithm is used to obtain dB-values most read-
lon and that described in 36 is the precision with which the ers are used to. As all psychoacoustic parameters are nor-
frequencies are calculated. To arrive at very precise values malized before inputting them into the SOM, the absolute
in 36 a wavelet analysis is performed, allowing for an ar- value is not relevant.
bitrary precision of frequency estimation. As this is very
expensive in terms of computational time, in the present All timbre parameters were integrated over the whole
study, the above-described Fourier analysis precision is piece as mean and standard deviation. Concatenating
used. In 36 the research aim was to tell the perceptual them arrives at the feature SOM training vector.
differences between tuning systems like Pure Tone, Werk-
meister, Kirnberger, etc. in a Baroque piece of J.S. Bach.
The present analysis is not aiming for such subtle differ-
ences but for the overall estimation of roughness.
Sharpness 4.3.4 Machine learning using self-organizing neu-
Perceptual sharpness is related to the work of Bis- ral maps (SOMS)
marck 8 and followers 2 3 16 . It corresponds to small
frequency-band energy. According to 16 it is measured in
acum, where 1 acum is a small-band noise within one crit- The COMSAR architecture used in this paper uses the
ical band around 1 kHz at 60 dB loudness level. Sharpness self-organizing map 22 . The two-dimensional map consists
increases with frequency in a nonlinear way. If a small- of 26 × 26 neurons for the tonal system and 15 × 15
band noise increases its center frequency from about 200 for timbre feature vectors. As the timbre feature vector
Hz to 3 kHz sharpness increases slightly, but above 3 kHz is much smaller than that of tonal systems, for tonal sys-
strongly, according to perception that very high small- tems, a larger neural net allows for a better differentiation
band sounds have strong sharpness. Still, sharpness is for the larger vector. The training set consists of either
mostly independent of overall loudness, spectral centroid, the timbre feature vector or the tonal system feature vec-
or roughness, and therefore qualifies as a parameter on its tor of all pieces in the collections, including Yunnan, Sri
own. Lanka, Nepal, and related regions. Training showed fast
To calculate sharpness, the spectrum A is integrated convergence in both cases, and 500 iteration steps were
with respect to 24 critical or Bark bands, as we are con- used each. Training the map means correlating the fea-
sidering small-band noise. With loudness LB at each Bark ture vector of each musical piece with all feature vectors
band B sharpness is of the neural map, which is initiated randomly at the be-
P24Bark ginning. For each trained feature vector, the neuron on
B=0 LB gB B the map with the strongest correlation and its neighbor-
S = 0.11 acum, (4)
P24Bark
LB ing neurons are altered towards the training vector using
B=0
a Mexican-hat function. This is repeated for all train-
where a weighting function gB is used strengthening ing vectors, so for all musical pieces, the map is trained
sharpness above 3 kHz like 31 with. After one such cycle, the map already starts self-
organizing, where distinct training feature vectors tune
1 ifB < 15
gB = (5) different regions of the map towards the training data.
0.066e0.171B ifz ≥ 15
This training is repeated in 500 cycles for each training
Loudness set.
Although several algorithms of sound loudness have
been proposed 16 , for music, still no satisfying results have After training, different regions of the map are similar
been obtained 32 . Most loudness algorithms aim for indus- within the region and slide over to other regions more dis-
trial noise, and it appears that musical content consider- similar. A u-matrix shows the similarity or dissimilarity of
ably contributes to perceived loudness. Also, loudness is neighboring neurons on the map to display where regions
found to statistically significantly differ between male and of similarity are present. Therefore, the distance between
female subjects due to the different constructions of the two neurons is not only the spatial distance on the map
outer ears between the sexes. Therefore a very simple es- but also displayed by the similarity between neighboring
timation of loudness is used, and further investigations in neurons. In the plots below, blue and green regions show
the subject are needed. The algorithm used is strong similarity, while brown, gray, or white regions are
very dissimilar.
v
uN
1u X A2 Arbitrary feature vectors, musical pieces, can be po-
i
L = 20 log10 t . (6) sitioned on the trained map, where their position is the
N i=0 A2ref
neuron with the highest correlation with respect to the
This corresponds to the definition of decibel, using a musical piece. The distribution of musical pieces from
rough logarithm-of-ten compression according to percep- different ethnic groups shown below therefore tells if the
tion and multiplying with 20 to arrive at 120 dB for a music of these groups can be identified and distinguished
sound pressure level of about 1 Pa. Of course, the digital by a feature, here timbre or tonal system, or if the group’s
audio data are not physical sound pressure levels (SPL). music is similar in this respect.
6Figure 2: The Kohonen neural map trained with
collection Bader and Uyghur musical pieces in terms of
their tonal systems. The background color is the
Figure 3: Tonal systems as trained by the map in
u-matrix, telling how similar or dissimilar neighboring
Figure 2, showing regions of similar and dissimilar tonal
neurons are, where blue and green denote similar, brown,
systems.
gray, or white denote dissimilar neighborhoods.
Therefore, the plot shows a strong split between Uyghur
pieces, mainly on the lower left, and Lisu, Kachin,
which are all from the Uyghur Rock/Pop band Qetik.
Rawang, Shan, or Bama pieces on the upper right side.
Other pieces around position (0,0) are traditional pieces,
like those of Sanubar Tursun, the Xinjiang muqam art en-
5 Results semble, or other such recordings. The Qetik tracks are
multi-track. Still, analysis is possible here due to strong
melody lines in the tracks detected by the algorithm. In
5.1 Tonal system Kachin/Uyghur com-
Figure 4 in the first row, one example of the Qetik piece,
parison Derdi Tolidur Yarning is shown. On the left, the analysis
Figure 2 shows the u-matrix of the SOM trained with the result of the piece. On the right, the map feature vector,
collection Bader and other Uyghur recordings with respect the trained tonal system on position (0,0) is shown where
to their tonal system. As described above, each neuron the piece is located. Remember that the tonal system map
is a feature vector of length 1200, containing the accu- on the right is a representation of all musical piece’s tonal
mulated cent values for all notes within each piece. The systems located on this node. Although the tonal system
background color displaying the similarity between neigh- on the left has no perfectly clear peaks, the trained tonal
boring neurons shows a clear ridge, splitting the lower-left system has. Its fifth, e.g., is at 702 cent, representing just
corner from the upper right side. Indeed, most Uyghur intonation rather than an equidistant 12-tone scale. Still,
pieces are in the lower-left corner, with additional pieces the fifth is at 503 cent, 498 cent would be just intona-
on the upper left corner and some following the main ridge tion, and a minor third at 307 cent, again 316 would be
downwards. All Kachin, Lisu, Rawang, Shan, and Bama just intonation. Still, as all Qetik pieces are located at
pieces, also shown in the map, are on the right upper this node, the tonal system map at (0,0) is closest to all
corner. Therefore, a clear difference between the tonal these pieces compared to all other map vectors. As shown
system used by the Uyghur and the Kachin and related in Figure 3, neighboring nodes around (0,0) are similar,
ethnic group’s music appears. and therefore the vector shown in Figure 4 for (0,0) is
To have an idea about the regions of similar tonal sys- like a fingerprint to Uyghur musical pieces tonal systems
tems, in Figure 3 the tonal systems of all neurons on the analyzed in this study.
map are shown. Comparing with Figure 2, the lower-left In Figure4 in the middle row, a Kachin solo flute piece
corner where many Uyghur pieces are located shows dis- is shown. The recording analysis shows sharp peaks, still
tinguished pitches, while other regions on the right upper distributed around fifth and fourth, next to the major
side have a more widespread distribution of pitches over second. The trained SOM vector this piece fits best finds
the octave. these fifths and fourths to be most characteristic for this
Multiple musical pieces can be placed on a single neu- piece, always in comparison to all other pieces the map is
ron. In most cases, on the map, only one or two pieces trained by.
are present. Still, on position (0,0), 11 pieces are located, Yet a third example is again a flute solo piece of Lisu
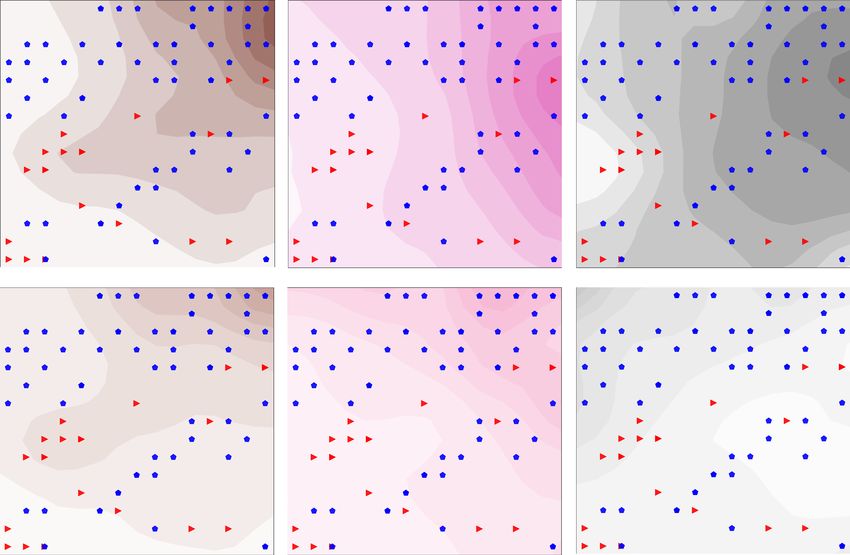
7Figure 5: Difference of mean tonal systems of upper
right and lower left triangular matrix of the tonal system
map in Figure 2, showing enhanced or reduced tone
regions for Kachin and associated ethnic groups vs.
Uyghur pieces.
Figure 4: Three examples of tonal systems as calculated
from sound file (left column) and as vector on the neural
map on the location the musical pieces fits best (right
column). Top: Uygur Rock/Pop piece by Qetik, Middel:
Kachin flute solo piece, Bottom: Lisu flute solo piece.
music showing considerably stronger pitches around the
sixth (around 900 cent) and strong peaks around the ma-
jor second (around 200 cent), while fifth and fourth are
not so prominent compared to the piece in the middle row
of the Figure. The trained map shows the sixth and the
second very prominent, while also strong fifth and fourth
are present. Both these trained SOM tonal systems are
therefore fingerprints of the musical pieces, not only in
terms of pitches present but also according to how often
these pitches appear in the pieces.
Therefore we can conclude that Uyghur and Kachin mu-
sical pieces clearly have different tonal systems. They are
split by a sharp ridge in the u-matrix. Also pieces within
Kachin music are present, differentiating Kachin, Lisu, or
Rawang pieces.
To estimate main differences, the map is split into an
upper right and a lower left triangular matrix, justified
by the clear ridge in the u-matrix. The upper right side
contains the Kachin and related ethnic groups, while the Figure 6: Self-organized map (SOM) trained using
lower left is the Uyghur side. For both triangular matrices, timbre feature vectors extracted by MIR tools of
a mean tonal system is calculated, and the lower-left mean Collection Bader (ESRA Archive) and Uyghur pieces,
is subtracted from the upper right. Figure 5 shows this with best-matches for Uyghur musical pieces (Xinjiang,
difference. Peaks larger than zero mean tone regions more China), and Kachin pieces Northern Myanmar). Colors
prominent with Kachin, and peaks below zero tone regions indicate the similarity of neighboring neurons (brown
more prominent in Uyghur tonal systems. The lowest, fun- and green are more dissimilar, blue more similar). Most
damental (0 cent) is omitted, as it outperforms all other Uyghur pieces are found in the upper half with more
peaks in favor of Kachin to make the rest of the plot better dissimilarity, while Kachin pieces appear to be more
readable. The fifth region shows that Kachin pieces tend similar.
to have a higher fifth compared to Uyghur pieces. The
same holds for the fourth. In both cases, Uyghurs center
8around just intervals, while Kachin tends to be higher.
There are sharp peaks at the major sixth, major second,
and major third regions stronger with Kachin pieces, and
an enhanced seventh region with the Uyghur music. Still,
the dominance of a fundamental at 0 cent with Kachin
music compared to Uyghur pieces outperforms all these
minor differences. The standard deviation of both regions
is nearly perfectly the same, pointing to a similar consis-
tence of tonal systems between the two groups.
Note that this definition of tonal system deviates from
that of a small set of cent values, one for each note in
the tonal system. As recordings nearly never show such
clear pitches, the suggested method is that of correlat-
ing an amplitude spectrum of pitches present in musical
pieces. These are fingerprints with characteristics such as Figure 7: Correlation of trained SOM feature vector with
presence, slight presence, or absence of pitches, deviations roughness (left), sharpness (middle), and loudness (left)
of pitches from a maximum, or bright vs. sharp spectra. for mean (upper plots) and standard deviation (lower
All these contribute to the perception of a tonal system plots). So e.g. the neurons in the upper right corner
present in musical pieces. have the highest mean and standard deviation of
roughness. Pieces with best-fit in this region therefore
are also strong in these parameters.
5.2 Timbre-based Kachin/Uyghur com-
parison
(Figure 7, maximum at upper right plot). Indeed, per-
Figure 6 shows a self-organizing map trained by Collec- ceptually this music is very loud.
tion Bader pieces of Southeast Asia, China, Sri Lanka, or
Nepal. For the training vector, timbre features have been
extracted from the pieces using MIR tools. After train- 5.3 Detailed display of features
ing, music from Uyghur ethnic group (Xinjiang, China), As mentioned above, each of the four used features of spec-
as well as Kachin ethnic group (Northern Myanmar) have tral centroid, roughness, sharpness, and loudness have a
been plotted as the best fit to the 15 x 15 neuron matrix. value for their mean and standard deviation at each neu-
The background color shows the similarity between neigh- ron position. These are displayed in Figure 8 includ-
boring neurons, where white, brown, or green mean more ing only the Kachin and in Figure 9 including only the
dissimilarity, and blue indicates stronger similarity. Uyghur pieces. These plots allow examining the feature
In the upper third of the plot, only Uyghur pieces are vectors responsible for placing pieces at certain neurons.
found, correlating with roughness mean and standard de- These plots show full detail, still are harder to read.
viations (upper left corner) and sharpness standard devi- The up-down axis of each plot shows the strength of each
ation (upper middle) (see Figure 7)). Musically the high feature normalized with respect to the maximum and min-
standard deviation corresponds to a strong fluctuation of imum value for this feature all over the map. The left-
these parameters within the pieces. right axis shows the importance of each feature with re-
A correlation between traditional and modern music is spect to sorting a musical piece right at this neuron. Al-
found at the best-fit pieces on the neuron with the highest though the association of pieces to neurons are performed
sharpness standard deviation, where a traditional piece as the correlation between the neuron and musical piece
Waderiha, as well as the Qetin Rock piece ‘Dolan muqam’ feature vectors, features similar in both contribute con-
are both located. This shows this characteristic timbre siderably stronger to the musical piece placement on the
feature of strong sharpness variations during the piece to map. These features are more on the left of each sub-
be continued in Rock music of modern Uyghur performers. plot, while features on the right are less nor nearly not
Closer examination of the Uyghur pieces at the up- important for the placement.
per left side shows correspondence with high centroid and As an example, the neuron at the very bottom on the
loudness standard deviation and overall low loudness. All very right has a very high spectral centroid mean (dark
these pieces have a characteristic bel canto-like singing blue) on the very left with the other features separated to
style, where all such pieces are only found in this plot the right. Therefore, sorting musical pieces on this neu-
region. ron is caused by the high spectral centroid mean of these
The Kachin pieces are most often sorted in blue re- pieces. Another case is the neuron in the fourth row on the
gions of Figure 6, indicating a stronger similarity within very left. Here all features have a medium value (up-down
the music of this ethnic group. One exception is the axis), but here most are on the very left. Therefore sorting
Kachin Wunpawng marching band, consisting of drums a musical piece here means that the values of all features
and zurna-like instruments, which have their best-fit at on the left fit very well with the neuron features. Yet,
the position of highest sharpness and loudness neurons a third example is the neuron in the first row in column
9Figure 8: Detailed display of feature strength and feature Figure 9: Same as 8 for the Uyghur pieces.
importance with respect to sorting a musical piece at a
neuron position for the Kachin pieces. The up-down axis
shows the strength of each feature, the left-right axis its with the other Uyghur pieces. We can not conclude from
importance with respect to sorting a piece at this the present database that bel canto in general is char-
position, where the most left features are the most acterized by these timbre features. Still, the strong loud-
important. Spectral centroid (blue), Roughness (orange), ness changes in the song are clearly corresponding to form
Sharpness (green), Loudness (red), mean is darker color, parts, large-scale forms, those with and without singing.
standard deviation is brighter color (e.g. dark blue = Although geographically quite distant, there is no con-
mean centroid, light blue = standard deviation centroid). siderable difference between music from Myitkyina and
Pota-O. The Wunpawng marching band stands out from
all other Kachin music with its highest sharpness and
six. Only one feature, the sharpness standard deviation loudness. Still, it does not fit into Uyghur timbre, too,
(light green) is on the left, meaning this is the important as the loudness shows no considerable standard deviation.
feature, still, its value is medium (up-down axis). Interesting are the two timbre similarities between tra-
ditional and Rock music, the Uyghur pieces of sharpness
standard deviation.
6 Conclusions The proposed method of using MIR and ML algorithms
to compare music from different ethnic groups has four
Connections between Kachin and Uyghur pieces are com- main advantages compared to traditional ethnomusicolog-
pared with respect to tonal system and timbre. The tonal ical analysis ’by hand’:
systems clearly split both ethnic groups, where Uyghur
pieces are closer to just intonation while Kachin music • The results are objective. As the algorithms used
shows sharp fifth and fourth, next to a strong sixth. The are based on decades of research on music and sound
Uyghur pieces have a strong seventh. The Uyghur pieces perception, we can be sure that the differences are
are much more similar to one another in terms of the tonal musically meaningful, and, therefore, the measures
system, while Kachin music shows a greater variety. are objective. The used parameters, timbre, pitch, or
Contrary to tonal systems, in terms of timbre, Kachin tonal system are clearly the main features of music.
pieces are more similar to one another compared to Although additional features could be used (rhythm,
Uyghur music. Kachin music also has less standard devia- melismas, musical instruments, etc.), those investi-
tions, especially with respect to sharpness and brightness. gated are main features, and differences and similar-
One might find this corresponding to subjective findings ities found here are crucial for the comparison of the
of the much more expressive music of the Uyghur people music of ethnic groups.
and smoother performance with the Kachin.
The Uyghur bel canto pieces form a timbre group on • The method uncovers unexpected differences or simi-
their own, still again distant from Kachin music. They larities. The near-perfect clustering in terms of tonal
also have a high standard deviation, still mainly on loud- systems has not been expected. Although differences
ness, by at the same time low loudness mean, different could be assumed, the ability of tonal system analysis
from the high standard deviation of sharpness present to clearly identify pieces as having its origin in one of
10the two groups and that tonal system is the feature [5] Bader, R. (2019). Temperament in Tuning Systems
separating both most clearly could not be assumed in of Southeast Asia and Ancient India. In: R. Bader (ed.):
the first place. Computational Phonogram Archiving, Springer Series
’Current Research in Systematic Musicology’, Vol. 5:
• The results are qualitative. That Uyghur pieces show 75-108.
enhanced dynamics compared to Kachin music might
be clear from listening. Still that this mainly differs [6] Bader, R. (2016). Finite-Difference model of mode
in the standard deviation of sharpness, also to some shape changes of the Myanmar pat wain drum circle us-
amount in brightness, and not in SPL or roughness, ing tuning paste. Proc. Mtgs. Acoust. 29, 035004; DOI:
is much harder to determine aurally. As sharpness 10.1121/2.0000450
mainly focuses on 1-3 kHz region, this effect corre-
sponds to the so-called loudness-war of Western pop- [7] Bader, R. (2013). Nonlinearities and Synchronization
ular music, where pushing energy into this frequency in Musical Acoustics and Music Psychology, Current
region leads to increased perceptual loudness. Links Research in Systematic Musicology, vol. 2., Springer,
to instrument building of dutars or setars are inter- Berlin, Heidelberg,
esting to draw in the future.
[8] Bismarck, G. v. (1974). Sharpness as an attribute
• The results are quantitative. The differences in of the timbre of steady-state sounds, Acustica 30: 159-
tonal systems show main similarities and differences 172.
in tonal systems of these two groups quantitatively,
[9] Brown, S., Savage, P. E., Ko, A. M.-Sh.,
showing relevant and irrelevant difference regions.
Stoneking, M., Ko, Y.-Ch., Loo, J. H. and Tre-
The use of a tonal system much closer to just in-
jaut, J. A. (2014). Correlations in the population
tonation of the Uyghur compared to the Kachin can
structure of music, genes and language, Proc Biol Sci.,
be quantified.
281 (1774): 1-7.
• The method allows details. The presented results aim
to find differences in the music of two ethnic groups. [10] (2002). China Uighur Twelve Muqam Symposium.
Still, many details in the analysis of pieces can addi- Precious Souvenir For Collectors. Two Boxes, 12 CDs,
tionally be found in the analysis results, again objec- 12 VCDs. The People’s Government Of The Xinjiang
tively, quantitatively, as well as qualitatively. Autonomous Region, China.
[11] Chordia, P. and Şentürk, S. (2013). Joint Recog-
The analysis might be considered a first step of defining
nition of Raag and Tonic in North Indian Music, Com-
ethnic identity. Still, on the other hand, many similarities
puter Music Journal, 37(3): 82-98.
have been found too. The study is therefore also about
both unity and diversity. [12] https://comsar.fbkultur.uni-hamburg.de/
https://gitlab.rrz.uni-hamburg.de/bal7668/comsar
7 Funding Information [13] Downie, J.S. (1999). Evaluating a simple approach
to music information retrieval: Conceiving melodic n-
The project was funded by the Deutsche Forschungs- grams as text, Ph.D. dissertation, Univ. Western On-
gemeinschaft (DFG) as project ’Music Information tario, Canada.
Retrieval-Basierte Dateninfrastruktur für Ethnographis-
che Tonträgerarchive’, GZ BA 2208/11-1 [14] Ellis, A. J. (1884). Tonometrical Observations on
Some Existing Nonharmonic Musical Scales. Proceed-
ings of the Royal Society 37: 368-85.
References
[15] https://esra.fbkultur.uni-hamburg.de/
[1] https://gitlab.rrz.uni-hamburg.de/bal7668/apollon
[16] Fastl H. and Zwicker, E. (2007). Psychoacoustics.
[2] Aures, W. (1985). Der sensorische Wohlklang als Facts and Models. 3rd edition, Springer.
Funktion psychoakustischer Empfindungsgrös̈sen [Sen-
sory pleasing sounds as function of psychoacoustic per- [17] Fermont, C. della Faille, D. (2016). Not your
ception parameters], Acustica 58: 282-290. world music. Noise in Southeast Asia. Art, Poli-
tics, Identity, Gender and Global capitalism. Syrphe,
[3] Aures, W. Berechnungsverfahren für den sen- Hushush, Berlin, Ottawa.
sorischen Wohlklang beliebiger Schallsignale [Calcula-
tion methods of sensory pleasing sounds for arbitrary [18] Groetsch, Ch. W. (1993). Inverse problems in
sound signals], Acustica 59: 130-141. mathematical sciences. Vieweg.
[4] Bader, R. (2019). Compuational Phonogram Archiv- [19] Harris, R. (2008). The making of a musical canon
ing. Springer Series ’Current Research in Systematic in Chinese Central Asia : the Uyghur Twelve Muqam,
Musicology, vol. 5. Ashgate.
11[20] von Helmholtz, H. (1863). Die Lehre von den [34] Schneider, A. (2018a). Pitch and Pitch Perception.
Tonempfindungen als physiologische Grundlage für die R. Bader (ed.):Springer Handbook of Systematic Musi-
Theorie der Musik [On the Sensations of tone as a phys- cology: 605-685, Springer Heidelberg.
iological basis for the theory of music]. Vieweg, Braun-
schweig. [35] Schneider, A. (2018b). Perception of Timbre and
Sound Color. R. Bader (ed.):Springer Handbook of Sys-
[21] Koduri, G. K., Gulati, S., Rao, P. and Serra, X. tematic Musicology: 687-725, Springer Heidelberg.
(2012). Rāga Recognition based on Pitch Distribution
Methods. J. New Music Research, 41(4): 337–350. [36] Schneider, A., von Ruschkowski, A., and
Bader, R. (2009). Klangliche Rauhigkeit, ihre
[22] Kohonen, T. (2001). Self-organizing maps. 3rd edi- Wahrnehmung und Messung. In: Bader, R. (ed. /
tion, Springer, Berlin. Hrsg.).: Musical Acoustics, Neurocognition and Psy-
chology of Music / Musikalische Akustik, Neurokogni-
[23] Light, N. (2008). Intimate Heritage: Creating tion und Musikpsychologie. Hamburger Jahrbuch für
Uyghur Muqam Song in Xinjiang. Halle Studies in the Musikwissenschaft 25: 101-144.
Anthropology of Eurasia, Lit Verlag.
[37] Sethares, W. (1993). Local consonance and the re-
[24] Lissoir, M.-P. (2017). Drinking, singing, and bond- lationship between timbre and scale, J. of the Acoust.
ing Ethnomusicology and alcohol among the Tai Dam Soc. of America 94: 1218-1228.
of northern Laos. Civilisation 66(1): 159-175.
[38] Six, J., Cornelis, O. and Leman, M. (2013).Tar-
[25] Litip. T. and Turson, I. (2012). Uyghur Musical sos, a Modular Platform for Precise Pitch Analysis of
Instruments. Kashgar Uyghur Press. Western and Non-Western Music. J. New Music Re-
search, 42(2): 113–129.
[26] Lomax, A. (1977). A worldwide evolutionary clas-
sification of cultures by subsistence systems, Current [39] Sottek, R. (1994). Gehörgerechte Rauhigkeits-
anthropology Chicago, Univ. of Chicago Press, 18(4): berechnung [Roughness calculation fitting perception],
659-708. Tagungsbericht DAGA ´94, Dresden: 1197-1200.
[27] Nazcgm, N. and Dixon, S. (2014). PYIN: A funda- [40] Tenzer, M. (2000). Gamelan Gong Kebyar. The Art
mental frequency estimator using probabalistic thresh- of Twenthieth-Century Balinese Music. Chicago, Uni-
old distributions. IEEE International Conference on versity of Chicago Press.
Acoustic, Speech and Signal Processing (ICASSP): 659-
663. [41] Wendt, G. and Bader, R. (2019). Analysis and
Perception of Javanese Gamelan Tunings. In: R. Bader
[28] Mcbridge, J. and Tlusty, T. (2019). Imperfect fifth (ed.): Computational Phonogram Archiving, Springer
pack into musical scales. arXiv:1906.06171v1 [cs.SD] 13 Series ‘Current Research in Systematic Musicology’,
Jun. Vol. 5: 129-144.
[29] Mac Lachlan, H. (2011). Burma’s pop music indus- [42] Williamson, M. (2000). Burmese Harp. Illinois,
try: creators, dirstributors, censors, Rochester Press. Nothern Illinois Monograph Series of Southeast Asia.
Vol. 1.
[30] Mullaney, Th. S. (2011). Coming to terms with the
nation. Ethnic Classification in Modern China, Univer- [43] Zwicker, E. and Fastl, H. (1999). Psychoacoustics.
sity of California Press. Facts and models. 2nd ed. Berlin, New York, Springer.
[31] Peeters, G. (2004). A large set of audio
features for sound description (similarity and
classification) in the CUIDADO project. http:
//recherche.ircam.fr/anasyn/peeters/ARTICLES/
Peeters 2003 cuidadoaudiofeatures.pdfIrcam.
[32] Ruschkowski, A. v. (2013). Lautheit von Musik:
eine empirische Untersuchung zum Einflus̈s von Or-
ganismusvariablen auf die Lautstärkewahrnehmung von
Musik. [Loudness of music: an empirical investigation
on the impact of Organism variables on loudness percep-
tion of music.] https://katalogplus.sub.uni-hamburg.
de/vufind/Record/78110422X?rank=1 Hamburg.
[33] Sadan, M. (2013). Being and becoming Kachin. His-
tories beyond the state in the borderworlds of Burma.
Oxford University Press.
12You can also read