Coon Creek Watershed District - Pleasure Creek Watershed Community Survey Author: Madeleine Hansen-Connell - Wilder Foundation
←
→
Page content transcription
If your browser does not render page correctly, please read the page content below

Coon Creek
Watershed District
Pleasure Creek Watershed
Community Survey
Author: Madeleine Hansen-Connell

M A Y   2 0 2 0
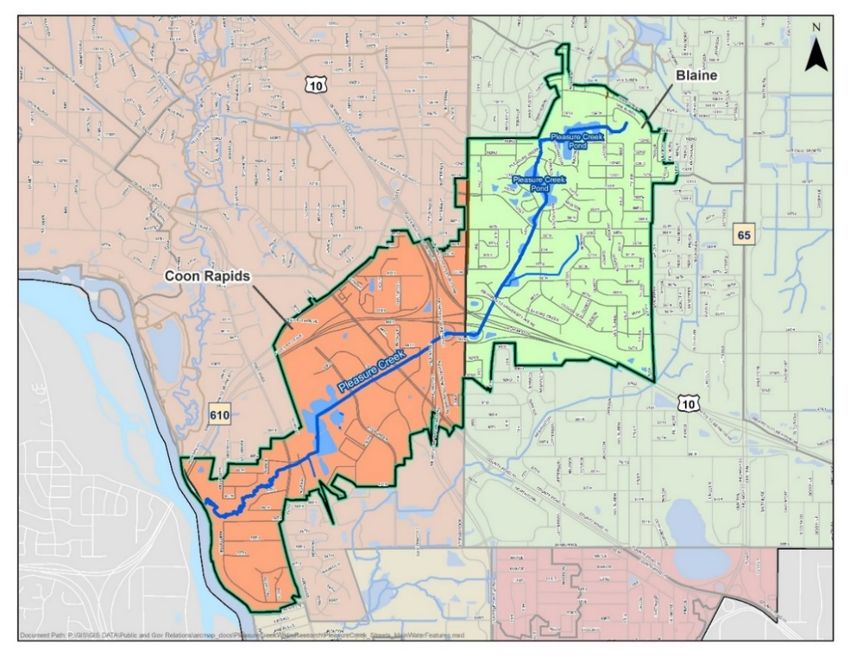
Introduction
In 2019 the Coon Creek Watershed District (CCWD), in partnership with the cities of
Blaine and Coon Rapids, contracted with Wilder Research (Wilder) to do a web survey of
residents who live in the Pleasure Creek watershed (Figure 1). Pleasure Creek is on the
Minnesota Pollution Control Agency’s Impaired Waters List for excessive E. coli
bacteria and phosphorus pollutants. CCWD and the City of Blaine are addressing these
impairments with several new projects including an in-ground biochar/iron-enhanced
sand filter near the outlet of the Pleasure Creek ponds into Pleasure Creek. CCWD also
has secured funding to install dog waste bag stations in the area and wants to do a larger
outreach campaign about water quality and how people impact it.

The goal of this survey was to inform these outreach and education strategies by learning
more about residents’ current knowledge of and experience with Pleasure Creek, the
Pleasure Creek Ponds and surrounding trails, and water pollutants and issues.

1.    Map of the Pleasure Creek watershed area

Pleasure Creek Watershed Community Survey                           1 | Wilder Research, May 2020
Methods
To conduct the web survey, Wilder received a list of all household addresses in the Pleasure
Creek watershed from CCWD, determined using the “Address Points” data set from Anoka
County GIS data. In total 3,377 households, including apartment dwellers, are located within the
watershed. Wilder randomly selected 2,800 households to receive an invitation to participate
in the survey. In February 2020, an initial postcard was mailed to selected households with a
unique PIN and web address to complete the survey online. Follow-up postcards were mailed
one week later to remind people to complete the survey. Participants who completed the survey
were given the opportunity to enter to win one of five Target gift cards to encourage participation
and thank respondents for their time.
Overall, 197 people responded to the web survey. This is a response rate of 7%, which is an
expected rate for a web survey using this methodology.
Limitations
The self-administered push-to-web survey methodology was selected to optimize the available
budget and time resources, while still gathering information critical to answering the research
questions. However, the push-to-web survey methodology and this survey tool have limitations,
including:
Limited in-depth data. For self-administered web surveys without large participant incentives,
it is important that most questions are easy-to-read, closed-ended, and the survey is kept
as short as possible. This limits the amount of in-depth qualitative data that can be collected.
A higher cost and more time intensive mixed method study would likely yield a higher
response rate, more extensive quantitative data, and greater in-depth qualitative data.
Respondents likely only included English speakers and those with access to the internet. To
keep costs lower, the survey was administered in English and required web access. Although
there are few non-English speakers in these communities, it is likely that community-members
with limited English language proficiency and those without internet access did not participate.
We cannot determine whether the sample of participants is representative of the Pleasure
Creek area community. The survey asked very few demographic questions, so we are
unable to compare the sample of participants to the broader community in terms of age,
education, family status, and other demographic characteristics. A robust response rate or the
ability to statistically test the demographics of respondents against the larger population
are necessary to understand the degree to which results are generalizable.
Every study has limitations. Given the cost and time constraints, this methodology was an
effective way of exploring community members’ perceptions at this point in time.
Pleasure Creek Watershed Community Survey 2 | Wilder Research, May 2020Findings
Below are the findings from the web survey. Data were analyzed in aggregate and also
by city. Responses were often very similar whether the respondent was from Blaine (125
respondents) or Coon Rapids (72 respondents). Therefore, findings are generally presented in
aggregate; however, differences of 15 percentage points or more between Blaine and Coon
Rapids respondents are noted in this section. Full breakdowns of the data by Blaine and
Coon Rapids respondents are included in the Appendix.
Use of the pond area or surrounding trails
Overall, 70% of survey respondents used the Pleasure Creek pond area and surrounding
trails. A lower percentage of Coon Rapids residents said they use the ponds and surrounding
trails (59% compared to 76% of Blaine residents). Of those who used the ponds, the majority
of respondents from either city said that they use the pond area for walking without a dog
(77%; Figure 2). Over 40% also said they used the pond area for biking, wildlife viewing, or
walking a dog. Additionally, less than 10% of respondents indicated that they used the ponds
for fishing or feeding wildlife. These two activities are generally discouraged by and are of
particular interest to CCWD and the City of Blaine as feeding wildlife can increase bacteria
levels, and high bacteria levels along with stormwater pollutants can be harmful for human
consumption of fish.
2. Pond or surrounding trail use activities (N=137)
Walking (without a dog) 77%
Biking 48%
Wildlife viewing 46%
Walking a dog 42%
Running 23%
Feeding wild ducks or geese 9%
Fishing 8%
Ice skating 1%
Note: Respondents could select multiple responses, so percentages do not sum to 100.
Pleasure Creek Watershed Community Survey 3 | Wilder Research, May 2020Dogs and dog waste
Dog waste, along with waste from wild animals, can increase bacteria levels in surface
water systems. Survey respondents who used the trails or pond area were asked how
often they saw dog waste when using the trails. Twelve percent indicated they saw dog
waste “most of the time,” while a third said they saw it “sometimes,” and another third
saw it “rarely” (Figure 3). Twenty-two percent said they have not noticed dog waste.
3. How often do you see dog waste (dog poop) when you are using the trails
around the ponds?
(N=138) N %
Most of the time 17 12%
Sometimes 46 33%
Rarely 45 33%
I have not noticed dog waste 30 22%
Respondents were also asked about their own dogs and dog habits. Forty-two percent of
respondents had a dog in the past year. Of those, 43% said they picked up dog waste in
their yards every day, 40% said they picked up dog waste once a week, and the remainder
picked up dog waste less frequently (Figure 4.)
4. How often do you pick up dog waste in your own yard?
(N=82) N %
Every day 35 43%
Once a week 33 40%
Once a month 6 7%
Less than once a month 4 5%
Never 4 5%
Note: One person indicated that they own a dog but do not have a yard.
Respondents were then asked about their habits with walking dogs. Forty-eight percent of
respondents had walked a dog in the past year (some respondents may not own a dog, but
may have walked a dog in the area). These respondents were asked how often they picked up
after their dog when the dog poops in someone else’s yard, on public paths or in other public
areas, and in ungroomed public areas. The vast majority of people indicated that they always
pick up their dog waste in someone else’s yard or on public paths or in other public areas;
fewer indicated they always pick up their dog waste in ungroomed public areas (Figure 5).
Pleasure Creek Watershed Community Survey 4 | Wilder Research, May 20205. How often do you pick up the dog's waste in the following places (N=94)
2%
In someone else's yard 93% 4%
1%
4%
On public paths or in other public areas 94% 1%
1%
In ungroomed public areas 65% 17% 7% 6% 4%
Always Usually Sometimes Rarely Never
Although CCWD expected that people would be less likely to pick up dog waste in the
winter, very few respondents indicated they would be less likely (3%; Figure 6). Most
said they would be neither more or less likely (73%), and 20% said they would be much
more likely to pick up their dog’s waste on walks in the winter.
6. In the winter season, are you more or less likely to pick up your dog's
waste on walks?
(N=94) N %
Much more likely 19 20%
Somewhat more likely 3 3%
Neither more or less likely 69 73%
Less likely 2 2%
Much less likely 1 1%
Respondents who had walked a dog were also asked about reasons they might not pick up
waste on walks. The top reason was “I forgot a bag,” chosen by 59% of respondents (Figure 7).
7. If you do not pick up dog waste, what are some of the reasons that you do
not pick up waste on walks? (N=63)
I forgot a bag 59%
The dog was in a place that I could… 30%
I didn't notice my dog pooped 21%
There are no trash cans nearby 10%
I don't need to because it is natural 8%
I am physically unable to pick it up 2%
I don't want to 0%
Note: Respondents could select multiple responses, so percentages do not sum to 100.
Pleasure Creek Watershed Community Survey 5 | Wilder Research, May 2020A higher percentage of Coon Rapids residents (20%) felt they did not need to pick up
their dog waste because it is natural (compared to 2% of Blaine residents). However the
number of people who answered this question was smaller than other questions (20 for Coon
Rapids and 43 for Blaine), so while the difference was greater than 15 percentage points
between the cities, Coon Rapids only had 3 more people choose this as an option
(4 respondents vs 1 respondent).
CCWD is also considering implementing bag stations with trash cans along the trails or
sidewalks in the area to help people pick up after their dog. Sixty-one percent of respondents
said they would be much more likely to pick up after their dog if trash cans and bags were
provided along the trails or sidewalks (Figure 8).
8. If there were trash cans and bags along the trails or sidewalks, would you
be more likely to pick up your dog's waste?
(N=82) N %
Much more likely 50 61%
Somewhat more likely 9 11%
Not more likely 23 28%
Yard care and home impacts
Yard waste, in particular leaves and grass that flow into stormwater systems, can also have a
negative impact on water quality. Respondents were therefore asked how they deal with
leaves, grass, and other yard waste in their yards and driveways. Twenty-seven percent of
respondents said they did not have a yard or have responsibility for their yard. Of those who
did have a yard and responsibility for it, an equal number of people (38%) said they place
them into bags for yard waste collection by their garbage hauler or the city or they mow over
leaves and grass and leave them in their yard (Figure 9).
Pleasure Creek Watershed Community Survey 6 | Wilder Research, May 20209. How do you generally deal with leaves, grass, or other yard waste/organic
matter in your yard or driveway? (N=144)
Mow over leaves and grass and
38%
leave them in the yard (mulching)
Place them into bags for yard waste
38%
collection by garbage hauler or city
Take them to the county compost site 14%
Compost them in a bin in my yard 9%
Place them in with regular garbage 1%
Rake/blow/place them into the street 1%
I do not do anything with them 1%
Note: Due to rounding, percentages do not sum to 100.
Respondents were also asked how flooding effects their home. They vast majority (81%)
said that their home or property is not affected by flooding (Figure 10). An additional 8%
said their yard has standing water, and 4% said their house or another building gets wet.
10. How does flooding impact your home?
(N=196) N %
My home or property is not affected by 159 81%
flooding
My yard will have standing water 15 8%
My house or other building on my property 8 4%
gets wet
I don't know 19 10%
Note: Respondents could select all that apply, so percentages do not sum to 100. If respondents selected don’t know,
they could not select other options.
Pleasure Creek Watershed Community Survey 7 | Wilder Research, May 2020Stormwater and algae knowledge
CCWD was also interested in what residents know about stormwater and algae to gauge
their understanding of surface water systems and potential pollutants. The majority of
respondents had heard of the term “stormwater” and felt they had a good idea about its
definition (Figure 11).
11. Have you heard of the term "stormwater"?
(N=196) N %
Yes, and I have a good idea about what 145 74%
it means
Yes, but I’m not sure what it means 42 21%
No 9 5%
When asked a contextual question about stormwater in their area, 55%-60% of respondents
understood that stormwater drains into nearby creeks, nearby ponds, the Mississippi River,
and the ground, which are all accurate understandings of the flow of stormwater (Figure 12).
Only 16% thought the stormwater goes to a treatment plant (which it does not). Blaine
residents were much more likely to recognize that stormwater drains into nearby ponds
(69% compared to only 39% of Coon Rapids residents). However, technically, the Pleasure
Creek ponds are in Blaine and are farther upstream, so stormwater from Coon Rapids
homes would not likely drain into those ponds. Since we asked specifically about stormwater
from their home and neighborhood that may be a correct response. Blaine residents were
also slightly more likely to indicate that water drains into the ground and into nearby creeks,
but less likely to say it drains into the Mississippi, so residents may be thinking more about
their immediate area. Education about the full stormwater system may benefit residents
from both cities.
12. Where do you think stormwater goes from your home and neighborhood?
Coon Rapids
Overall (N=197) Blaine (N=125) (N=72)
N % N % N %
Drains into nearby creeks 118 60% 78 62% 40 56%
Drains into nearby ponds 114 58% 86 69% 28 39%
Drains into the Mississippi River 110 56% 66 53% 44 61%
Drains into the ground 108 55% 75 60% 33 46%
To a water treatment plant 31 16% 18 14% 13 18%
I don't know 18 9% 8 6% 10 14%
Note: Respondents could select all that apply, so percentages do not sum to 100. If respondents selected don’t know,
they could not select other options.
Pleasure Creek Watershed Community Survey 8 | Wilder Research, May 2020Respondents were also asked to identify causes of algae in the ponds. The majority of
respondents correctly identified fertilizer from lawns (67%) and leaves and organic
material (57%) as sources contributing to algae growth (Figure 13). Fewer indicated
fertilizer from parks (42%) and wildlife droppings or dog waste (38%) as contributors to
algae. About one-third of respondents (31%) indicated that algae was a natural plant.
13. What do you think causes the algae? (N=197)
Fertilizer from lawns 67%
Leaves and organic material 57%
Fertilizer from parks 42%
Wildlife droppings/dog waste 38%
It's a natural plant 31%
I don't know 10%
Note: Respondents could select all that apply, so percentages do not sum to 100. If respondents selected don’t know,
they could not select other options.
Connection with Coon Creek Watershed and water issues
Sixty-three percent of survey respondents had heard of the Coon Creek Watershed District.
Of those, the majority of people had heard about CCWD through a city or community
newsletter (81%; Figure 14). A higher percentage of Blaine residents said they have
heard of CCWD through a community event (29% of Blaine residents, 11% of Coon
Rapids residents) or through the biochar filtration construction project (27% of Blaine
residents, 2% of Coon Rapids residents), which is in Blaine.
Pleasure Creek Watershed Community Survey 9 | Wilder Research, May 202014. How did you hear about the Coon Creek Watershed District?
Overall Blaine Coon Rapids
(N=124) (N=79) (N=45)
N % N % N %
City or community newsletter 100 81% 64 81% 36 80%
Community event (ex. the Blaine Festival, 28 23% 23 29% 5 11%
Coon Rapids Summer in the City, Blaine
Open House, Blaine WorldFest, etc.)
New filter construction project on 22 18% 21 27% 1 2%
Pleasure Creek Parkway
Website search 14 11% 8 10% 6 13%
Social media 11 9% 5 6% 6 13%
I needed a Coon Creek Watershed 3 2% 1 1% 2 4%
District development permit
Farmers market 2 2% 1 1% 1 2%
Other 20 16% 8 10% 12 27%
Note: Responses that differed by more than 15 percentage points between city residents are highlighted in blue. Respondents could
select all that apply, so percentages do not sum to 100.
We asked respondents how they would like to hear about water issues in their community,
and overwhelmingly, they said they would prefer city newsletters as a mode of
communication (88%; Figure 15).
15. How would you like to hear about water issues?
N=196 N %
City newsletters 172 88%
Email 49 25%
Social media 41 21%
NextDoor 35 18%
Neighborhood meetings 23 12%
Door hangers 20 10%
I do not want any information 7 4%
Note: Respondents could select all that apply, so percentages do not sum to 100.
Twenty-one percent said they would like to hear about water issues through social media.
In a follow-up question, the vast majority of respondents said Facebook would be a preferred
type of social media (85%; Figure 16). Blaine residents were more likely to indicate that
they would follow Instagram (33% Blaine residents to 14% Coon Rapids residents), and
Pleasure Creek Watershed Community Survey 10 | Wilder Research, May 2020Twitter (26% Blaine residents to 7% Coon Rapids residents), however very few people answered this question (14 Coon Rapids residents, and 27 Blaine residents) so differences should be interpreted cautiously. 16. Type of social media N=41 N % Facebook 35 85% Instagram 11 27% YouTube 11 27% Twitter 8 20% LinkedIN 4 10% Other 2 5% Note: Respondents could select all that apply, so percentages do not sum to 100. Of the people who said they would be interested in getting information (N=190), none of the respondents said they would like information in a language other than English. Though respondents did not need information in another language, the survey was conducted in English, so it likely did not capture those who primarily speak other languages. In looking at data from MN Compass, compiled from the US Census Bureau 2017 American Community Survey Estimates, 14% of Blaine residents and 11% of Coon Rapids residents speak a language other than English. Only 5% of Blaine residents and 4% of Coon Rapids residents report that they speak English less than “very well.” While these data represent the cities of Blaine and Coon Rapids, rather than the specific Pleasure Creek area, some materials in other languages may still be helpful in designing education and outreach campaigns. Demographics The vast majority of respondents indicated they were white or Caucasian. Of those who provided an answer (N=186), 96% selected only white or Caucasian as their race or ethnicity, and only 4% identified as Native American or a person of color. According to data from MN Compass, people of color comprise 20% of the population in Blaine and 17% of the population in Coon Rapids. While this does not necessarily represent the demographics of the specific Pleasure Creek subwatershed within Blaine and Coon Rapids, it does indicate that the voices of people of color in these areas were largely missed with this survey. Additional outreach to these communities would be beneficial. Most survey respondents have lived in the area long time, with 68% indicating they have lived there for longer than 10 years (Figure 17). Pleasure Creek Watershed Community Survey 11 | Wilder Research, May 2020
17. How long have you lived in the area?

 N=196                                                         N     %
 Less than 6 months                                            2     1%
 6 months to a year                                            4     2%
 More than a year to 5 years                                   36    18%
 More than 5 years to 10 years                                 21    11%
 More than 10 years                                            133   68%
Note: One person indicated that they preferred not to answer

Over half of respondents said that having ponds and streams nearby was not at all a factor
in their decision to move into the neighborhood, while only 12% said it was a main factor
(Figure 18).

18. How much was having ponds and streams nearby a factor in your decision
    to move into the neighborhood?

 N=196                                                         N     %
 Not at all a factor                                           106   54%
 Somewhat of a factor                                          67    34%
 A main factor                                                 23    12%

Pleasure Creek Watershed Community Survey                                  12 | Wilder Research, May 2020
Recommendations
In reviewing the data, the following recommendations could be considered when designing
education and outreach materials and strategies.
Of note, a smaller percentage of Coon Rapids residents use the Pleasure Creek ponds
and trail system. This could be because they are farther away from the ponds, but they
also may not be aware of the ponds and trail system. It may be helpful to conduct
outreach to Coon Rapids residents with information about the ponds and trail system.
Walking was a primary use of the pond and trail area. CCWD could highlight walking to
promote the trails, or select other approved activities to highlight.
The majority of people said they were prompt in picking up dog waste in their own
yards (within one week), and always picked up waste in other people’s yards or in
public areas. Fewer people picked up waste in ungroomed areas. It may be helpful to
make the case about the importance of picking up after your dog in ungroomed areas
in educational materials.
Forgetting bags was a main reason that people did not pick up dog waste, and the
majority of people indicated they would be much more likely to pick up dog waste if
bags and trash cans were provided along the trails. The data therefore suggest the
installation of dog waste stations could make an impact on the amount of waste picked
up by owners.
The majority of households maintained their yards in ways that minimize water pollution.
Therefore, yard care may not need to be emphasized as heavily in outreach materials.
While most respondents had some level of understanding of stormwater drainage and
causes of algae, more education could bolster a more comprehensive understanding of
water flows and pollution.
The majority of respondents who had heard about CCWD were familiar with them
because of a city or community newsletter. The majority of respondents also indicated
they would like to find out about water issues through city newsletters. While there
may be some connection between these responses and respondent bias, this still
indicates that city newsletters would be preferred and effective ways of communicating
messages to residents. Additionally, while less than a quarter of respondents indicated
that they would like to get information through social media, if CCWD does choose
that medium, Facebook was the most popular platform.
The vast majority of survey respondents were white, and more consideration of and
outreach to communities of color would be important in future outreach efforts.
Pleasure Creek Watershed Community Survey 13 | Wilder Research, May 2020Appendix
A1. Pond or surrounding trail use activities
Overall (N=196) Blaine (N=125) Coon Rapids (N=71)
N % N % N %
I do not use the pond area or 59 30% 30 24% 29 41%
surrounding trails
Overall (N=137) Blaine (N=95) Coon Rapids (N=42)
Of those who use the pond area or N % N % N %
trails
Walking (without a dog) 106 77% 74 78% 32 76%
Biking 66 48% 45 47% 21 50%
Wildlife viewing 63 46% 41 43% 22 52%
Walking a dog 58 42% 41 43% 17 40%
Running 31 23% 24 25% 7 17%
Feeding wild ducks or geese 12 9% 8 8% 4 10%
Fishing 11 8% 9 9% 2 5%
Ice skating 2 1% 2 2% 0 0%
Note: Responses that differed by more than 15 percentage points between city residents are highlighted in blue. Respondents
could select multiple responses, so percentages do not sum to 100.
A2. How often do you see dog waste (dog poop) when you are using the trails
around the ponds?
Overall(N=138) Blaine(N=95) Coon Rapids(N=43)
N % N % N %
Most of the time 17 12% 14 15% 3 7%
Sometimes 46 33% 33 35% 13 30%
Rarely 45 33% 30 32% 15 35%
I have not noticed dog waste 30 22% 18 19% 12 28%
A3. Do you have a dog(s) or have you had a dog(s) in the past year?
Overall (N=196) Blaine (N=125) Coon Rapids (N=71)
N % N % N %
Yes 83 42% 55 44% 28 39%
No 113 57% 70 56% 43 61%
Pleasure Creek Watershed Community Survey 13 | Wilder Research, May 2020A4. How often do you pick up dog waste in your own yard?
Overall (N=82) Blaine (N=55) Coon Rapids (N=27)
N % N % N %
Every day 35 43% 26 47% 9 33%
Once a week 33 40% 23 42% 10 37%
Once a month 6 7% 1 2% 5 19%
Less than once a month 4 5% 2 4% 2 7%
Never 4 5% 3 5% 1 4%
Note: Responses that differed by more than 15 percentage points between city residents are highlighted in blue.
A5. Have you walked a dog(s) in the past year?
Overall (N=196) Blaine (N=125) Coon Rapids (N=71)
N % N % N %
Yes 94 48% 63 50% 31 43%
No 103 52% 62 50% 41 57%
A6. How often do you pick up the dog's waste in the following places?
Always Usually Sometimes Rarely Never
Overall (N=94)
In someone else's yard 93% 0% 1% 2% 4%
On public paths or in other
public areas 94% 4% 1% 1% 0%
In ungroomed public areas 65% 17% 7% 6% 4%
Blaine (N=63)
In someone else's yard 90% 0% 0% 3% 6%
On public paths or in other
public areas 92% 6% 2% 0% 0%
In ungroomed public areas 68% 11% 10% 6% 5%
Coon Rapids (N=31)
In someone else's yard 97% 0% 3% 0% 0%
On public paths or in other
public areas 97% 0% 0% 3% 0%
In ungroomed public areas 58% 29% 3% 6% 3%
Pleasure Creek Watershed Community Survey 14 | Wilder Research, May 2020A7. In the winter season, are you more or less likely to pick up your dog's waste on
walks?
Overall (N=94) Blaine (N=63) Coon Rapids (N=31)
N % N % N %
Much more likely 19 20% 14 22% 5 16%
Somewhat more likely 3 3% 3 5% 0 0%
Neither more or less likely 69 73% 44 70% 25 81%
Less likely 2 2% 2 3% 0 0%
Much less likely 1 1% 0 0% 1 3%
A8. If you do not pick up dog waste, what are some of the reasons that you do not
pick up waste on walks?
Overall (N=63) Blaine (N=43) Coon Rapids (N=20)
N % N % N %
I forgot a bag 37 59% 24 56% 13 65%
The dog was in a place that I could not 19 30% 13 30% 6 30%
get to
I didn't notice my dog pooped 13 21% 9 21% 4 20%
There are no trash cans nearby 6 10% 4 9% 2 10%
I don't need to because it is natural 5 8% 1 2% 4 20%
I am physically unable to pick it up 1 2% 1 2% 0 0%
I don't want to 0 0% 0 0% 0 0%
Another reason (specify): 13 21% 11 26% 2 10%
Note: Responses that differed by more than 15 percentage points between city residents are highlighted in blue. Respondents
could select multiple responses, so percentages do not sum to 100.
A9. If there were trash cans and bags along the trails or sidewalks, would you be
more likely to pick up your dog's waste?
Overall (N=82) Blaine (N=57) Coon Rapids (N=25)
N % N % N %
Much more likely 50 61% 35 61% 15 60%
Somewhat more likely 9 11% 4 7% 5 20%
Not more likely 23 28% 18 32% 5 20%
Pleasure Creek Watershed Community Survey 15 | Wilder Research, May 2020A10. How do you generally deal with leaves, grass, or other yard waste/organic matter
in your yard or driveway?
Overall (N=197) Blaine (N=125) Coon Rapids (N=72)
N=197 N % N % N %
I do not have a yard or responsibility 53 27% 28 22% 25 35%
for my yard
Overall (N=144) Blaine (N=97 Coon Rapids (N=47)
Of those with a yard N % N % N %
Mow over leaves and grass and leave 54 38% 33 34% 21 45%
them in the yard (mulching)
Place them into bags for yard waste 54 38% 38 39% 16 34%
collection by garbage hauler or city
Take them to the county compost site 20 14% 17 18% 3 6%
Compost them in a bin in my yard 13 9% 8 8% 5 11%
Place them in with regular garbage 1 1% 0 0% 1 2%
Rake/blow/place them into the street 1 1% 0 0% 1 2%
I do not do anything with them 1 1% 1 1% 0 0%
Note: Due to rounding percentages may not sum to 100.
A11. How does flooding impact your home?
Overall (N=196) Blaine (N=125) Coon Rapids (N=71)
N % N % N %
My home or property is not affected by 159 81% 104 83% 55 77%
flooding
My yard will have standing water 15 8% 8 6% 7 10%
My house or other building on my 8 4% 5 4% 3 4%
property gets wet
I don't know 19 10% 12 10% 7 10%
Note: Respondents could select all that apply, so percentages do not sum to 100. If respondents selected don’t know, they could
not select other options.
A12. Have you heard of the term "stormwater"?
Overall (N=196) Blaine (N=125) Coon Rapids (N=71)
N % N % N %
Yes, and I have a good idea about 145 74% 99 79% 46 65%
what it means
Yes, but I’m not sure what it means 42 21% 19 15% 23 32%
No 9 5% 7 6% 2 3%
Pleasure Creek Watershed Community Survey 16 | Wilder Research, May 2020A13. Where do you think stormwater goes from your home and neighborhood?
Overall (N=197) Blaine (N=125) Coon Rapids (N=72)
N % N % N %
Drains into nearby creeks 118 60% 78 62% 40 56%
Drains into nearby ponds 114 58% 86 69% 28 39%
Drains into the Mississippi River 110 56% 66 53% 44 61%
Drains into the ground 108 55% 75 60% 33 46%
To a water treatment plant 31 16% 18 14% 13 18%
I don't know 18 9% 8 6% 10 14%
Note: Responses that differed by more than 15 percentage points between city residents are highlighted in blue. Respondents could
select all that apply, so percentages do not sum to 100. If respondents selected don’t know, they could not select other options.
A14. What do you think causes the algae?
Overall (N=197) Blaine (N=125) Coon Rapids (N=72)
N % N % N %
Fertilizer from lawns 132 67% 89 71% 43 60%
Leaves and organic material 112 57% 72 58% 40 56%
Fertilizer from parks 82 42% 50 40% 32 44%
Wildlife droppings/dog waste 74 38% 49 39% 25 35%
It's a natural plant 61 31% 41 33% 20 28%
I don't know 19 10% 10 8% 9 13%
Note: Respondents could select all that apply, so percentages do not sum to 100. If respondents selected don’t know, they could
not select other options.
A15. Have you heard of the Coon Creek Watershed District?
Overall (N=197) Blaine (N=125) Coon Rapids (N=72)
N % N N % N
Yes 124 63% 79 63% 45 63%
No 73 37% 46 37% 27 38%
Pleasure Creek Watershed Community Survey 17 | Wilder Research, May 2020A16. How did you hear about the Coon Creek Watershed District?
Overall (N=124) Blaine (N=79) Coon Rapids (N=45)
N % N N % N
City or community newsletter 100 81% 64 81% 36 80%
Community event (ex. the Blaine 28 23% 23 29% 5 11%
Festival, Coon Rapids Summer in the
City, Blaine Open House, Blaine
WorldFest, etc.)
New filter construction project on 22 18% 21 27% 1 2%
Pleasure Creek Parkway
Website search 14 11% 8 10% 6 13%
Social media 11 9% 5 6% 6 13%
I needed a Coon Creek Watershed 3 2% 1 1% 2 4%
District development permit
Farmers market 2 2% 1 1% 1 2%
Other 20 16% 8 10% 12 27%
Note: Responses that differed by more than 15 percentage points between city residents are highlighted in blue. Respondents
could select all that apply, so percentages do not sum to 100.
A17. How would you like to hear about water issues?
Overall (N=196) Blaine (N=124) Coon Rapids (N=72)
N % N % N %
City newsletters 172 88% 111 90% 61 85%
Email 49 25% 31 25% 18 25%
Social media 41 21% 27 22% 14 19%
NextDoor 35 18% 24 19% 11 15%
Neighborhood meetings 23 12% 13 10% 10 14%
Door hangers 20 10% 14 11% 6 8%
I do not want any information 7 4% 5 4% 2 3%
Note: Respondents could select all that apply, so percentages do not sum to 100.
Pleasure Creek Watershed Community Survey 18 | Wilder Research, May 2020A18. Type of social media
Overall (N=41) Blaine (N=27) Coon Rapids (N=14)
N % N N % N
Facebook 35 85% 24 89% 11 79%
Instagram 11 27% 9 33% 2 14%
YouTube 11 27% 7 26% 4 29%
Twitter 8 20% 7 26% 1 7%
LinkedIN 4 10% 2 7% 2 14%
Other 2 5% 1 4% 1 7%
Note: Responses that differed by more than 15 percentage points between city residents are highlighted in blue. Respondents
could select all that apply, so percentages do not sum to 100.
A19. Race or ethnicity
Overall (N=186) Blaine (N=121) Coon Rapids (N=65)
N % N % N %
Black or African American 1 1% 0 0% 1 2%
African native, including Oromo, 0 0% 0 0% 0 0%
Somali, Ethiopian
Asian, including Southeast Asian 1 1% 0 0% 1 2%
Hispanic or Latino/a/e 2 1% 2 2% 0 0%
Native American 2 1% 1 1% 1 2%
White or Caucasian 179 96% 118 98% 61 94%
Another race or ethnic group (specify): 2 1% 1 1% 1 2%
Note: Respondents could select all that apply, so percentages do not sum to 100. Eleven people overall said they preferred not
to answer, including 4 Blaine residents and 7 Coon Rapids residents.
A20. How long have you lived in the area?
Overall (N=196) Blaine (N=124) Coon Rapids (N=72)
N % N % N %
Less than 6 months 2 1% 1 1% 1 1%
6 months to a year 4 2% 3 2% 1 1%
More than a year to 5 years 36 18% 22 18% 14 19%
More than 5 years to 10 years 21 11% 13 10% 8 11%
More than 10 years 133 68% 85 69% 48 67%
Note: One person indicated that they preferred not to answer
Pleasure Creek Watershed Community Survey 19 | Wilder Research, May 2020A21. How much was having ponds and streams nearby a factor in your decision to
move into the neighborhood?
Overall (N=196) Blaine (N=124) Coon Rapids (N=72)
N % N % N %
Not at all a factor 106 54% 69 56% 37 51%
Somewhat of a factor 67 34% 41 33% 26 36%
A main factor 23 12% 14 11% 9 13%
Pleasure Creek Watershed Community Survey 20 | Wilder Research, May 2020Acknowledgments Wilder Research, a division of Amherst H.
Wilder Foundation, is a nationally respected
The authors would like to thank CCWD staff for nonprofit research and evaluation group. For
their efforts in assisting with data collection and
more than 100 years, Wilder Research has
writing this report, especially Dawn Doering and
Britta Dornfeld. We would also like to thank the
gathered and interpreted facts and trends to help
cities of Coon Rapids and Blaine for helping families and communities thrive, get at the core
promote the survey. of community concerns, and uncover issues that
are overlooked or poorly understood.
Wilder Research would also like to acknowledge
the following staff who played key roles in data 451 Lexington Parkway North
collection, analysis, and the creation of this report: Saint Paul, Minnesota 55104
651-280-2700 | www.wilderresearch.org
Jenny Bohlke
Alice Lubeck
Maria Robinson
Mandi Spradling
Dan SwansonYou can also read