Credit Conditions North America Q1 2022: As Recovery Rolls On, Inflation Risks Remain - Dec. 7, 2021 - S&P Global
←
→
Page content transcription
If your browser does not render page correctly, please read the page content below
Credit Conditions North America Q1 2022:
As Recovery Rolls On, Inflation Risks Remain
Dec. 7, 2021

                               S&P Global Ratings' North America Credit Conditions Committee took place on Nov. 22, 2021.
                               This report does not constitute a rating action.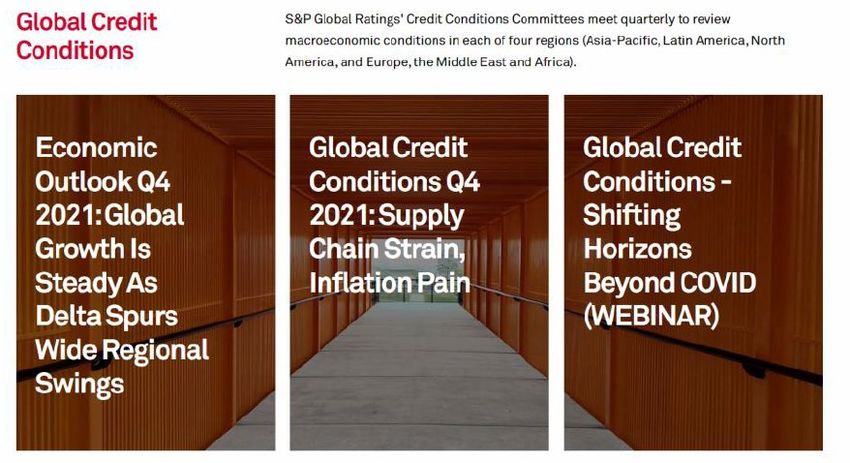
Contents
                                                          Slide
A.   Key Takeaways                                           3
B.   North America Top Risks                                 4
C.   Macroeconomic Outlook      U.S.                         5
                                Canada                       6
D.   Financing Conditions                                   7-8
E.   Ratings Trends                                        9-10
F.   U.S. Debt Ceiling                                      11
G.   Practice Trends            U.S. Public Finance         12
                                Nonfinancial Corporates   13-14
                                Structured Finance        15-16
                                Financial Institutions      17
                                Insurance                   18
Appendix 1: Economic Data And
                                                            19
Forecast Summaries
Appendix 2: Contacts                                        20
Related Research                                            21

                                                                  2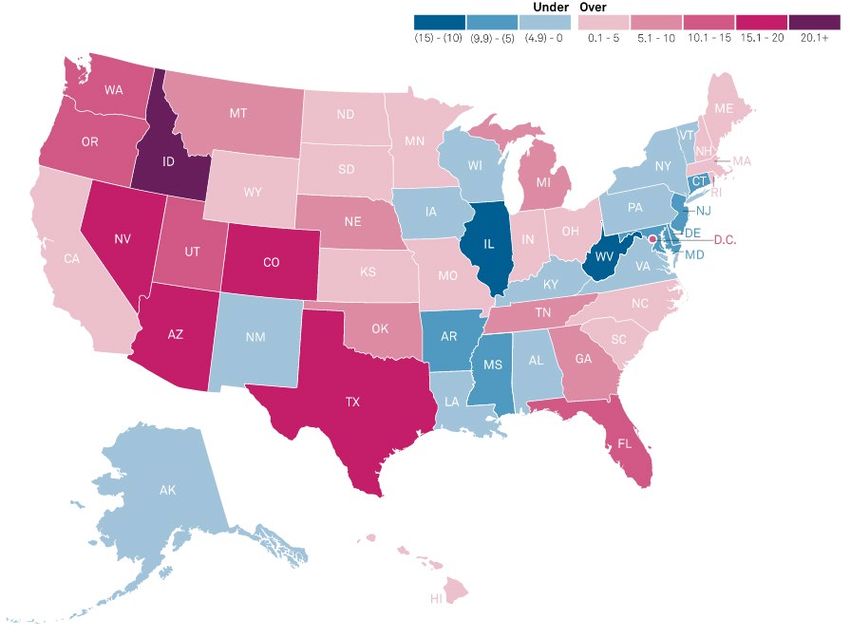
Key Takeaways

   – Overall: Credit conditions remain largely favorable, although risks are looming—primarily those around inflation
     pressures and supply disruptions (including labor shortages) that many borrowers face. The potential for
     coronavirus variants such as omicron adds another layer of uncertainty about the pandemic and its effects on the
     economy and credit.
   – Credit: The North American net negative outlook bias among corporate borrowers has narrowed to just 5%, the
     lowest since December 2014. In this light, we see the U.S. trailing-12-month speculative-grade default rate
     reaching 2.5% by September of next year.
   – Risks: With inflation running “stronger and longer,” the potential for central bank policy missteps has increased. As
     price pressures combine with supply constraints, investors could soon demand higher returns for the risks they’re
     assuming. This could result in the repricing of financial and real assets, higher debt-servicing costs, and tighter
     financing conditions.

Source: S&P Global Ratings. Credit Conditions North America: As Recovery Rolls On, Inflation Risks Remain, Dec. 1, 2021.

                                                                                                                             3
North America Top Risks
Risk Level Risk Trend
Persistent high inflation pushes investors to reprice risk High Unchanged
High debt, sustained cost pressures threaten credit quality High Unchanged
COVID crisis persists, curbing economic activity Elevated Worsening
Structural Risks
Energy transition and ESG factors affect business operations,
Elevated Worsening
borrowing costs
Cyberattacks disrupt business operations and hurt credit quality Elevated Unchanged
U.S.-China strategic confrontation worsens Elevated Unchanged
Declining demand for commercial real estate (office space, in
Elevated Improving
particular) pressures asset valuations, hurts lenders
* Risk levels may be classified as very low, moderate, elevated, high, or very high, are evaluated by considering both the likelihood and systemic impact of such an event occurring over the next one to two years.
Typically, these risks are not factored into our base case rating assumptions unless the risk level is very high.
** Risk trend reflects our current view on whether the risk level could increase or decrease over the next twelve-months.
Source: S&P Global Ratings. Credit Conditions North America: As Recovery Rolls On, Inflation Risks Remain, Dec. 1, 2021.
4U.S. Economic Outlook | Cruising At A Lower Altitude
U.S. Real GDP Scenarios
– GDP growth. As supply-chain disruptions
November 2021 baseline November 2021 downside continue, we forecast U.S. GDP to grow 5.5% in
November 2021 upside 2018-19 trend 2021 and 3.9% in 2022.
5,600
– Labor force/unemployment. The decline in labor
5,400 force participation, particularly among prime-age
Billions: chained 2012 prices
workers, is an issue for productivity and growth.
5,200 We expect the adjusted unemployment rate to
5,000 reach its precrisis lows in the first quarter of 2023.
– The Fed. We expect the Fed to reduce monthly
4,800
asset purchases by a larger amount next year to
4,600 reach zero three months earlier in 2022 than at
the current $15 billion pace, with the first rate hike
4,400 a little later in the year. Inflation should reach the
Fed’s 2% target by late 2023.
4,200
– Downside scenario. Risks that could lead to a
1Q 2018
2Q 2018
3Q 2018
4Q 2018
1Q 2019
2Q 2019
3Q 2019
4Q 2019
1Q 2020
2Q 2020
3Q 2020
4Q 2020
1Q 2021
2Q 2021 f
3Q 2021 f
4Q 2021 f
1Q 2022 f
2Q 2022 f
3Q 2022 f
4Q 2022 f
1Q 2023 f
2Q 2023 f
3Q 2023 f
4Q 2023 f
1Q 2024 f
2Q 2024 f
3Q 2024 f
4Q 2024 f
slower-growth downside scenario include the Fed
tightening monetary policy faster than it would
like, disorderly reflation, repricing risk, distribution
f—Forecast. Sources: Bureau of Economic Analysis, Oxford Economics, and S&P Global Economics’ forecasts. of COVID-19 vaccines, new COVID-19 variants, and
See Economic Outlook U.S. Q1 2022: Cruising At A Lower Altitude, Nov. 29, 2021.
increasing trade tensions with China.
.
5Canada Economic Outlook | Economy Set To Expand Strongly,
COVID-19 And Inflation Risks Remain
Inflation Likely To Slowdown To 2% By H2 2022
– GDP growth. Despite the setback from third
Headline inflation BoC core CPI (ex: indirect taxes) Core CPI (ex. food and energy) and fourth waves of COVID in 2021, the
5 Canadian economy is still on course to expand
by a robust 5.0%, and 2022-2023 will likely
4 bring above-potential growth.
Year-over-year, change (%)
3 – Inflation. Our forecast is that consumer price
inflation will peak in the fourth quarter of
2 2021 and early 2022 (on a year over year
basis) before reverting in the second half of
1 2022 to its 2% average, in line with Bank of
Canada's (BoC) target. We continue to see
0
inflation as a specific feature of the pandemic
-1 crisis that will fade. We now anticipate the
BoC will begin its rate hike cycle in April 2022.
-2 – Risks. The delta and omicron variants may not
represent the virus’ last assault, and higher-
and longer-than-expected inflation could
derail the domestic demand from a robust
f—Forecast. Q—Quarter. CPI — Consumer Price Index. Sources: Oxford Economics and S&P Global Economics.
See Economic Outlook Canada Q1 2022: Economy Set To Expand Strongly, COVID-19 And Inflation Risks Remain, Nov. 29, 2021.
growth path.
6Financing Conditions | On Cruise Control
While Looking At Potholes Ahead
U.S. Speculative-Grade Debt Issuance Sets New Record In 2021 Market Pricing Implies Some Excess Optimism In Fixed Income
As Omicron Threat Grows
2018 2019 2020 2021 Speculative-Grade Spread Estimated Spread
1800
1,200
$1,142
1600
1,000
1400
800 $766 1200
$741
($ billion)
(bps)
$706 1000
600
800
400 600
400
200
200
0 0
Jan Feb Mar Apr May Jun Jul Aug Sep Oct Nov Dec
Chart displays combined speculative-grade bond, and leveraged loan issuance. Data through Nov. 30, 2021. Data through Nov. 30, 2021. Source: S&P Global Ratings.
Sources: S&P Global Ratings; Refinitiv; LCD, an offering of S&P Global Market Intelligence.
7Financing Conditions | Upcoming Speculative-Grade Maturities
Sharply Reduced In The Past Year
U.S. Speculative-Grade Nonfinancial Corporate Maturity Wall
As of July 2020 As of Jan. 2021 As of July 2021
– Near term: Companies have reduced
600 speculative-grade maturities in the next 18
months (second half of 2021-2022) by 40%,
500 to $208 billion.
400 – Medium term: Speculative-grade debt
maturities from 2023-2024 also declined by
($ billion)
300 21% in the past year.
200
– Longer term: Spec-grade maturities in 2026
rose 26% as companies lengthened their
100 maturity profile with new issuance.
0
H2 2021 2022 2023 2024 2025 2026
Note: Includes bonds, loans, and revolving credit facilities that are rated by S&P Global Ratings on the respective report date. Source: S&P Global Ratings.
8Ratings Trends | Ratings Outlooks Improve, But Risks Remain
– The North American net outlook bias has narrowed significantly from the pandemic peak of -42%, to just -5% in November.
– Downgrade potential has improved across all sectors, with the most marked outlook improvement in the oil and gas, transportation, and
retail sectors. But sectors including aerospace and defense, utilities, and autos still reflect somewhat elevated downgrade risk.
– Still, the ratings distribution among U.S. nonfinancial corporate borrowers is heavily spec-grade (63%)—among which 10% of borrowers
are in the ‘CCC’ category and 36% at ‘B-’ or below.
North American Ratings Net Outlook Bias (%) North American Nonfinancial Corporate Bias
Aerospace & Defense
North America Europe Global Utility
0% Autos
Media & Entertainment
-5%
Consumer Products
-10% Health Care
Net Outlook Bias (%)
Telecom
-15% Metals, Mining & Steel
Capital Goods
-20%
CP&ES
-25% Oil & Gas
Insurance
-30% FP&BM
-35% Homebuilders/Real Estate Co.
Transportation
-40% Retail/Restaurants
Financials (ex. Insurance)
-45% High Technology
May-14
May-15
May-16
May-17
May-18
May-19
May-20
May-21
Jan-14
Jan-15
Jan-16
Jan-17
Jan-18
Jan-19
Jan-20
Jan-21
Sep-14
Sep-15
Sep-16
Sep-17
Sep-18
Sep-19
Sep-20
Sep-21
0% 20% 40% 60% 80% 100%
Negative bias (%) Stable bias (%) Positive bias (%) Negative Bias (%) Dec. 31. 2020
Net outlook bias is defined as negative bias (%) subtracted from positive bias (%). Datafrom Dec. 31, 2013 to Nov. Data as of Nov. 11, 2021. CP&ES—Chemicals, packaging and environmental services. FP&BM—Forest
11, 2021, and includes nonfinancial corporates, financial institutions, and insurance. Source: S&P Global Ratings. products and building materials. Source: S&P Global Ratings.
9Ratings Trends | Defaults Likely To Remain Low Through 2022
U.S. Trailing-12-Month Speculative-Grade Default Rate And September 2022 Forecast
U.S. speculative-grade default rate (actual) Base forecast (2.5%) – We expect the U.S. trailing-12-month
Optimistic (1.5%) Pessimistic (5.5%) speculative-grade corporate default rate to
16 reach 2.5% by September 2022 from 2.4% in
14
September 2021.
– Almost all near-term indicators of future
12
defaults suggest a still low default rate ahead,
10 with credit metrics stabilizing, continued
favorable lending conditions, over $1 trillion in
(%)
8 spec-grade issuance this year, and a strong
6 economic rebound expected next year.
– However, a growing list of risks could push a
4
still-weak rating distribution to produce more
2 defaults: persistent inflation, possible policy
missteps, a very high proportion of covenant-
0
lite loans, and potential COVID-19 mutations,
to name a few.
Shaded areas are periods of recession as defined by the National Bureau of Economic Research. Sources: S&P Global Ratings and S&P Global
Market Intelligence's CreditPro®. See The U.S. Speculative-Grade Corporate Default Rate Could Reach 2.5% By September 2022, Nov. 16, 2021.
10U.S. Debt Ceiling
– On Oct. 14, President Biden signed legislation to raise the government’s debt ceiling by $480 billion (to reach $28.9 trillion), effectively
extending the ceiling till Dec. 3, coinciding with the deadline for funding the U.S. government.
– The U.S. Treasury resumed issuing debt but reached the new ceiling by the end of October and started undertaking “extraordinary
measures” that allow it to service its debt.
– Treasury announced it would likely exhaust its fiscal capacity by Dec. 15th, based on its projected cashflows. (S&P does not make any such
calculation on its own, but other organizations—like CBO—calculate that the Treasury will run out of cash before the end of December).
– We expect Congress will continue to engage in brinksmanship with the debt ceiling but will address it on time, either raising it or
suspending it, understanding that the consequences on the financial markets of not doing so will be severe.
– During the last decade, Congress has passed legislation (and the president has signed it) to raise or suspend the debt ceiling on six
occasions (2011, 2013, 2017, 2018, 2019, and 2021) during a similar impasse.
– Congress can raise or suspend the debt ceiling by using a Reconciliation resolution (needing a simple majority in both the Senate and the
House) or by ordinary legislation (effectively needing at least 60 out of 100 votes in the Senate). Both parties are using the debt ceiling as a
tool for either forcing or blocking the passage of other legislation.
– It would be unprecedented in modern times for an advanced, wealthy country such as the U.S. to default on its sovereign debt. In the event
of such a default, our Criteria would prescribe a lowering of the U.S. rating to Selective Default (SD). After the default is cured, a committee
would need to consider the new circumstances and determine a rating accordingly.
Source: S&P Global Ratings.
11U.S. Public Finance | Strong Economic Growth
And Federal Support Bode Well For USPF Credit Quality
Long-Awaited IIJA Provides $550 Billion In USPF-Related Spending
– Issuers across USPF will benefit from support for traditional infrastructure needs like roads and bridges, as well as funding for emerging
risks related to climate resiliency, energy transition, and cybersecurity.
– Infrastructure funding from IIJA frees up budget space for some issuers who would otherwise make capital investments from operating
revenue, allowing for greater stability over the long term.
– Funding from IIJA adds to the billions of dollars in federal aid already received from prior rounds of pandemic-related stimulus, supporting
both short- and long-term needs.
ESG Remains Front And Center Across All Sectors
– Given the frequency and severity of hurricane, drought, flooding, and wildfire activity this year, issuers will need to address ongoing storm
hardening to prepare for coming years.
– Without mitigation efforts, historic Western U.S. drought and related water supply challenges will pressure some municipal utilities,
irrigation districts, and local governments.
– Preparedness for future weather and climate disruptions is critical for issuer credit stability over the long term; focus on the “S” and “G” of
ESG may not be visible to the naked eye but are also imperative.
Strong Economy And Federal Stimulus Provide Foundation For Credit Stability In 2022…
– Stable credit environment expected in the near term as the economy continues to expand, but lack of labor availability presents a growing
challenge for many issuers.
– Year-over-year revenue growth remains strong for most states, and continued strength in the housing market should contribute to healthy
property valuation growth for many local governments.
– Inflation and supply chain disruptions affecting consumers have not led to direct USPF credit deterioration to date.
…But Some Lingering Uncertainties Remain
– The pandemic lingers and thus far uneven vaccination and hospitalization rates have not led to stark differences in regional economic
recovery across the U.S., but winter spikes could create more pressure.
– Delayed return to office could have implications for the downtown core in urban centers and transportation providers; could also affect
sales and property taxes over the medium term.
– Revenue softness for some business and leisure-related hospitality-backed debt, like convention centers, remain the exception rather
than the norm.
Source: S&P Global Ratings.
12Nonfinancial Corporates | Rising Costs Unlikely To Weigh Too Heavily
On Corporate Credit Quality, Though Pressures May Persist
– Balancing the tension between surging demand
for many products and services vs. the sharp rise
in input prices amid supply disruptions is a
primary concern for many North American
corporates.
– For many, pent-up demand outweighs escalating
costs, allowing for cost pass-throughs and profit
margin support. But not all sectors/companies
have been able to pass on higher costs.
– Looking ahead, most sectors will likely see rising
labor and non-labor costs next year—with supply
bottlenecks and labor shortages only easing in
the second half of 2022.
– The new omicron variant is a stark reminder that
the COVID-19 pandemic is far from over. We can
expect a precautionary stance in markets, and
short-term containment measures put in place by
governments. These could reverse the progress
towards resolving supply chain disruptions.
Source: S&P Global Ratings' corporate ratings sector analysts were surveyed with between Nov. 1 and Nov. 14, 2021.
13Many N.A. Sectors Expect Supply Bottlenecks And Labor Shortages
To Only Ease In The Second Half Of 2022
Question: If your sector is being affected by or benefitting from supply chain and
cost issues, how long do you expect the most important effect to persist?
To End H2 2022
- Aerospace & Defense
- Airlines
- Autos
- Building Materials
- Chemicals
- Consumer Products
- Cruise
- Engineering & Const’n
- Freight Transportation
- Gaming
- Healthcare Services
To End H1 2022 - Leisure Manufacturing
- Metals & Mining
- Capital Goods - Paper & Packaging Into 2023
This Year Only - Lodging - Regulated Utilities
- Midstream Energy - Retail & Restaurants - Business & Consumer Services
- Pharmaceuticals - Telecommunications - Technology - Homebuilders & Developers
H1 H2 H1 H2 H1 H2
2021 2022 2023
Source: S&P Global Ratings' corporate ratings sector analysts were surveyed with between Nov. 1 and Nov. 14, 2021. See Supply Chain Strains and Rising Costs Will Pressure Profitability in 2022, Nov. 18, 2021.
14Structured Finance
North America Structured Finance Sector Trends (12-Month Outlook) Q1 2022
Collateral Performance
Outlook
Rating Trends – The structured finance credit picture remains stable-
Residential mortgages to-improving, buoyed by gains in employment and
RMBS Somewhat Weaker Stable
RMBS - Servicer Advance Somewhat Weaker Stable
wages, robust economic growth, and a relatively positive
Commercial mortgages picture for U.S. consumers, despite inflation pressures.
CMBS - N.A. Conduit/Fusion Somewhat Weaker Stable to Negative
CMBS - Large Loan/Single Borrower Somewhat Weaker Stable to Negative – LIBOR transition. More than 90% of U.S. SF exposure is
CMBS - Large Loan/Single Borrower (Retail) Weaker Stable to Negative
CMBS - Large Loan/Single Borrower (Lodging) Somewhat Weaker Stable to Negative concentrated among the CLO, legacy RMBS, and student
CMBS - Large Loan/Single Borrower (office) Somewhat Weaker Stable to Negative loan ABS sectors.
Asset-backed securities
ABS - Prime Auto Loans Somewhat Stronger Stable to Positive – Most caution within CMBS. Class B and C malls in
ABS - Subprime Auto Loans Stable Positive
ABS -Auto Lease Somewhat Stronger Stable secondary and tertiary locations continue to struggle.
ABS - Auto Dealer Floorplan Stable Stable The lodging sector is improving, though group/business
ABS - Credit Cards Somewhat Weaker Stable
ABS - Unsecured Consumer Loans Somewhat Weaker Stable to Negative demand has lagged. Return-to-office plans will likely
ABS - FFELP Student Loan
ABS - Private Student Loan
Somewhat Weaker
Stable
Stable
Stable
start to emerge in earnest in 2022, which should buoy
ABS - Commercial Equipment Stable Stable lodging (and aircraft) and shed more light on the outlook
Asset-backed Commercial Paper
Structured credit
Somewhat Weaker Stable
for office.
CLOs Somewhat Weaker Stable
Timeshares Stable Stable
– CLOs saw record issuance this year. We are watching a
Small Business Somewhat Weaker Stable modest deterioration in recovery ratings that could
Tobacco Somewhat Weaker Stable
Transportation - Aircraft Somewhat Weaker Stable to Negative
affect some pre-pandemic CLOs, and a historically high
Transportation - Container Stable Stable proportion of single ‘B-’ rated obligors in recent vintages.
Transportation - Railcar Stable Stable
Whole Business Stable Stable
Triple Net Lease Stable Stable
Note: FFELP—Federal Family Education Loan Program. Source: S&P Global Ratings.
15U.S. RMBS | The Shift From Under To Overvalued
RMBS Over/Under At State Level
– U.S. home prices have made significant gains. We
have updated the home value assessments we use
when evaluating mortgage pools backing certain
residential mortgage-backed securities.
– Nationwide, we estimate housing is about 5%
overvalued. However, the picture varies at the state
level and by core-based statistical area (CBSA). That
is, some states and CBSAs are overvalued while
others are undervalued.
– The impact of home values on a residential mortgage
pool is based on the specific CBSAs and their
geographic representation in that pool.
Source: S&P Global Ratings. See The Shift From Under To Overvalued: What It Means For U.S. RMBS, Oct. 29, 2021.
16Financial Institutions
Banks
– We continue to have confidence in the health of the U.S. banking system. Bank earnings—which have risen sharply in 2021 on reserve
releases—should fall in 2022 as provisions for credit losses climb from the negative levels of 2021. However, pre-provision profitability
should rise on higher net interest income due to an acceleration in loan growth and some rise in rates.
– Bank asset quality looks set to remain in good shape, and capital ratios will edge down towards pre-pandemic levels. Funding and liquidity
will remain in good shape but are unlikely to improve further given the Fed’s tapering and potential rate hikes.
– Competitive pressures from advances in fintech and the shadow banking system will likely continue to drive significant M&A activity.
Finance Companies
– We think the likelihood of substantial further deterioration in the loan portfolios of commercial real estate finance companies has
lessened. Nevertheless, there may be property-specific issues to work through.
– We now have stable outlooks on all business development companies we rate. Overall portfolio valuations have substantially recovered
from the depths of the pandemic-related shutdowns.
– Performance in the consumer finance segment was surprisingly resilient during the pandemic and has remained strong.
Asset Managers
– Our outlook on traditional and alternative asset managers remains stable. This reflects our belief that secular industry headwinds will
continue to be offset by higher asset prices, supporting assets under management (AUM) levels and margins.
– Low interest rates continue to fuel the active strategic pairings between life insurance companies and asset managers. Some of these
asset managers will now become more exposed to the risks that annuity providers face; depending, too, upon the asset manager’s
willingness to provide some form of support to the insurer under certain stress scenarios.
Source: S&P Global Ratings.
17Insurance
– Ratings activity was very limited in the fourth quarter 2021 with no assessed changes to current business conditions. Our ‘somewhat
stronger’ business conditions outlook assessment sustained for the life, health, and global reinsurance sectors.
– Overall, the average financial strength rating for the core North American insurance portfolio (life, health, property/casualty) is at the
upper end of the strong (‘A’) category. A very high percentage (>90%) of our ratings maintain stable outlooks.
– Major rating factors include natural catastrophes, investment yield, regulatory and legislative policy, and competitive conditions.
– Accommodative financial conditions combined with valuation (life) and intent to diversify beyond insurance (health) are providing ongoing
support for consolidation.
– Balance-sheet strength remains supportive of credit quality for the portfolio, providing a measure of protection from risks.
North America Insurance Sector Trends Q1 2022 Rating And Outlook Distribution
AA A BBB Lower Positive Stable Negative CW Pos CW Neg
Current Business Business Conditions 3% 2% 2%
100% 100% 4%
Sector Outlook 5% 8% 2% 5% 13%
Conditions Outlook 14%
23%
80% 80%
Life Insurers Satisfactory Somewhat Stronger Stable
Health Insurers Satisfactory Somewhat Stronger Stable 55% 71%
60% 78% 60% 57%
73%
100% 100% 96% 100% 100%
Property & Casualty Insurers Satisfactory No Change Stable 62%
95% 93% 83%
40% 40%
Global Reinsurers Weak Somewhat Stronger Negative
Bond Insurers Satisfactory No Change Stable 20% 20%
37% 29%
29%
20% 23%
Title Insurers Satisfactory No Change Stable 15% 5%
0% 0%
Mortgage Insurers Satisfactory No Change Stable
Note: Business conditions and sector outlook are for the next 12 months. Source: S&P Global Ratings.
Data as of Oct. 31, 2021. CW Pos--CreditWatch with positive implications. CW Neg--CreditWatch with
negative implications. Source: S&P Global Ratings.
18Appendix 1: Economic Data And Forecast Summaries
U.S. – S&P Global Ratings Economic Outlook
2020 2021f 2022f 2023f 2024f
Real GDP (year % ch.) (3.4) 5.5 3.9 2.7 2.3
Real consumer spending (year % ch.) (3.8) 8.0 3.8 2.5 2.5
Real equipment investment (year % ch.) (8.3) 13.1 2.1 4.4 5.3
Real nonresidential structures investment (year % ch.) (12.5) (7.9) 0.6 6.3 5.4
Real residential investment (year % ch.) 6.8 8.6 (2.8) 0.6 2.6
Core CPI (year % ch.) 1.7 3.4 3.5 2.6 2.3
Unemployment rate (%) 8.1 5.4 4.0 3.7 3.4
Housing starts (annual total in mil.) 1.4 1.6 1.5 1.5 1.5
Federal Reserve’s fed funds policy target rate range (year-end %) 0-0.25 0-0.25 0.25-0.50 1.00-1.25 1.5-1.75
Note: All percentages are annual averages, unless otherwise noted. Core CPI is consumer price index excluding energy and food components. f—forecast. Sources: Bureau of Economic Analysis, Bureau of Labor Statistics,
the Federal Reserve, Oxford Economics, and S&P Global Economics’ forecasts.
Canada – S&P Global Ratings Economic Outlook
2020 2021f 2022f 2023f 2024f
Real GDP (year % ch.) (5.3) 5.0 3.7 2.7 2.1
Household real final consumption (year % ch.) (5.9) 4.1 4.8 3.0 2.2
Real equipment investment (year % ch.) (17.4) 7.5 8.6 5.4 3.2
Real nonresidential structures investment (year % ch.) (11.3) (4.7) 6.3 5.3 3.2
Real residential investment (year % ch.) 4.1 18.1 (3.4) (0.2) 1.7
Core CPI (year % ch.) 1.1 2.2 2.5 1.7 2.0
Unemployment rate (%) 9.6 7.6 6.3 5.9 5.6
Housing starts (annual total in thousands) 219.0 275.3 239.2 230.0 227.5
MLS house price index (year % ch.) 8.5 21.0 2.8 0.0 1.7
Government of Canada 10-year bond yield (%) 0.8 1.4 2.3 2.9 3.1
Bank of Canada policy rate (year-end %) 0.6 0.3 0.6 1.1 1.6
Note: All “year % ch.” are annual averages percent change. Core CPI is consumer price index excluding energy and food components. f—forecast. Sources: Statistics Canada, Oxford Economics, and S&P Global Economics’
forecasts.
19Appendix 2: Contacts
Contacts
David Tesher Joe Maguire Yucheng Zheng
Credit Research
david.tesher@spglobal.com joe.maguire@spglobal.com yucheng.zheng@spglobal.com
Beth Ann Bovino Satyam Panday
Macroeconomic Outlook
bethann.bovino@spglobal.com satyam.panday@spglobal.com
Financing Conditions & Nick Kraemer Evan Gunter Nicole Serino
Ratings Trends nick.kraemer@spglobal.com evan.gunter@spglobal.com nicole.serino@spglobal.com
Robin Prunty Jane Ridley
U.S. Public Finance
robin.prunty@spglobal.com jane.ridley@spglobal.com
Chiza Vitta
Nonfinancial Corporates
chiza.vitta@spglobal.com
Winston Chang James Manzi Tom Schopflocher
Structure Finance
winston.chang@spglobal.com james.manzi@spglobal.com tom.schopflocher@spglobal.com
Stuart Plesser Matthew Carroll Elizabeth Campbell
Financial Institutions
stuart.plesser@spglobal.com matthew.carroll@spglobal.com elizabeth.campbell@spglobal.com
Joseph Marinucci
Insurance
joseph.marinucci@spglobal.com
Joydeep Mukherji
Sovereigns
joydeep.mukherji@spglobal.com
Ben Macdonald Trevor D’Olier-Lees
Infrastructure
ben.macdonald@spglobal.com trevor.dolier-lees@spglobal.com
Lekha Prabhakar
Research Contributor
CRISIL Global Analytical Center, an S&P affiliate
20Related Research
– Credit Conditions North America : As Recovery Rolls On, Inflation Risks Remain, Dec. 1, 2021
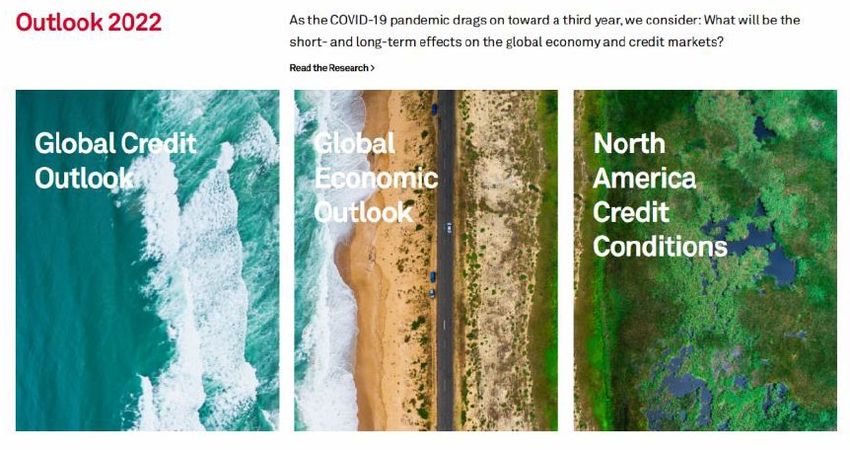
– Global Credit Outlook 2022: Aftershocks, Future Shocks, And Transitions, Dec. 1, 2021
– Economic Outlook Q1 2022: Rising Inflation Fears Overshadow A Robust Rebound, Nov. 30, 2021
– Economic Outlook Canada Q1 2022: Economy Set To Expand Strongly, COVID-19 And Inflation Risks Remain, Nov. 29, 2021
– Economic Outlook U.S. Q1 2022: Cruising At A Lower Altitude, Nov. 29, 2021
– Supply Chain Strains and Rising Costs Will Pressure Profitability in 2022, Nov. 18, 2021
– The U.S. Speculative-Grade Corporate Default Rate Could Reach 2.5% By September 2022, Nov. 16, 2021
– The Shift From Under To Overvalued: What It Means For U.S. RMBS, Oct. 29, 2021
You might also be interested in the following regularly updated articles:
– COVID-19 Impact: Key Takeaways From Our Articles
– Global Actions On Corporations, Sovereigns, International Public Finance, And Project Finance To Date In 2021
– Ratings Weekly Digest, Dec. 1, 2021
21Please also visit the
Global Credit Outlook
2022 and Global Credit
Conditions pages for our
latest articles, webcasts,
topical videos, ...
https://www.spglobal.com
/ratings/en/research-
insights/topics/outlook-
2022
https://www.spglobal.com
/ratings/en/research-
insights/topics/global-
credit-conditions
22Copyright © 2021 by Standard & Poor’s Financial Services LLC. All rights reserved.
No content (including ratings, credit-related analyses and data, valuations, model, software or other application or output therefrom) or any part thereof (Content) may be modified, reverse engineered, reproduced or distributed in any form by any
means, or stored in a database or retrieval system, without the prior written permission of Standard & Poor's Financial Services LLC or its affiliates (collectively, S&P). The Content shall not be used for any unlawful or unauthorized purposes. S&P
and any third-party providers, as well as their directors, officers, shareholders, employees or agents (collectively S&P Parties) do not guarantee the accuracy, completeness, timeliness or availability of the Content. S&P Parties are not responsible
for any errors or omissions (negligent or otherwise), regardless of the cause, for the results obtained from the use of the Content, or for the security or maintenance of any data input by the user. The Content is provided on an "as is" basis. S&P
PARTIES DISCLAIM ANY AND ALL EXPRESS OR IMPLIED WARRANTIES, INCLUDING, BUT NOT LIMITED TO, ANY WARRANTIES OF MERCHANTABILITY OR FITNESS FOR A PARTICULAR PURPOSE OR USE, FREEDOM FROM BUGS, SOFTWARE ERRORS
OR DEFECTS, THAT THE CONTENT'S FUNCTIONING WILL BE UNINTERRUPTED, OR THAT THE CONTENT WILL OPERATE WITH ANY SOFTWARE OR HARDWARE CONFIGURATION. In no event shall S&P Parties be liable to any party for any direct,
indirect, incidental, exemplary, compensatory, punitive, special or consequential damages, costs, expenses, legal fees, or losses (including, without limitation, lost income or lost profits and opportunity costs or losses caused by negligence) in
connection with any use of the Content even if advised of the possibility of such damages.
Credit-related and other analyses, including ratings, and statements in the Content are statements of opinion as of the date they are expressed and not statements of fact. S&P's opinions, analyses, and rating acknowledgment decisions
(described below) are not recommendations to purchase, hold, or sell any securities or to make any investment decisions, and do not address the suitability of any security. S&P assumes no obligation to update the Content following publication in
any form or format. The Content should not be relied on and is not a substitute for the skill, judgment and experience of the user, its management, employees, advisors and/or clients when making investment and other business decisions. S&P
does not act as a fiduciary or an investment advisor except where registered as such. While S&P has obtained information from sources it believes to be reliable, S&P does not perform an audit and undertakes no duty of due diligence or
independent verification of any information it receives. Rating-related publications may be published for a variety of reasons that are not necessarily dependent on action by rating committees, including, but not limited to, the publication of a
periodic update on a credit rating and related analyses.
To the extent that regulatory authorities allow a rating agency to acknowledge in one jurisdiction a rating issued in another jurisdiction for certain regulatory purposes, S&P reserves the right to assign, withdraw, or suspend such acknowledgement
at any time and in its sole discretion. S&P Parties disclaim any duty whatsoever arising out of the assignment, withdrawal, or suspension of an acknowledgment as well as any liability for any damage alleged to have been suffered on account
thereof.
S&P keeps certain activities of its business units separate from each other in order to preserve the independence and objectivity of their respective activities. As a result, certain business units of S&P may have information that is not available to
other S&P business units. S&P has established policies and procedures to maintain the confidentiality of certain nonpublic information received in connection with each analytical process.
S&P may receive compensation for its ratings and certain analyses, normally from issuers or underwriters of securities or from obligors. S&P reserves the right to disseminate its opinions and analyses. S&P's public ratings and analyses are made
available on its Web sites, www.standardandpoors.com (free of charge), and www.spcapitaliq.com (subscription) and may be distributed through other means, including via S&P publications and third-party redistributors. Additional information
about our ratings fees is available at www.standardandpoors.com/usratingsfees.
Australia: S&P Global Ratings Australia Pty Ltd holds Australian financial services license number 337565 under the Corporations Act 2001. S&P Global Ratings' credit ratings and related research are not intended for and must not be distributed to
any person in Australia other than a wholesale client (as defined in Chapter 7 of the Corporations Act).
STANDARD & POOR'S, S&P and RATINGSDIRECT are registered trademarks of Standard & Poor's Financial Services LLC.
spglobal.com/ratings
23You can also read