Destination Cape Breton Strategy 2020-21 - Cape Breton Island
←
→
Page content transcription
If your browser does not render page correctly, please read the page content below
Destination Cape Breton Strategy 2020-21
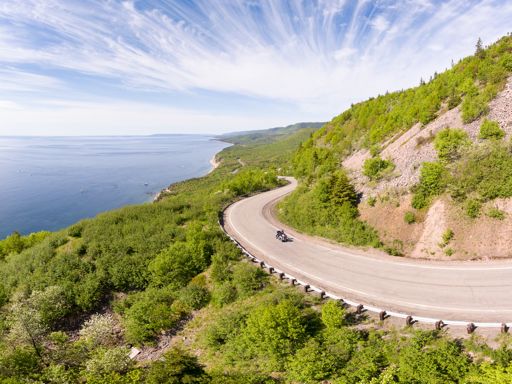
Table of Contents

Section                 Page
2019 Results              2
Strategy Overview        11
Research                 14
Product Innovation       19
Marketing                25
Niche Markets            34
Industry Mobilization    39

                               1
2019 Results
               2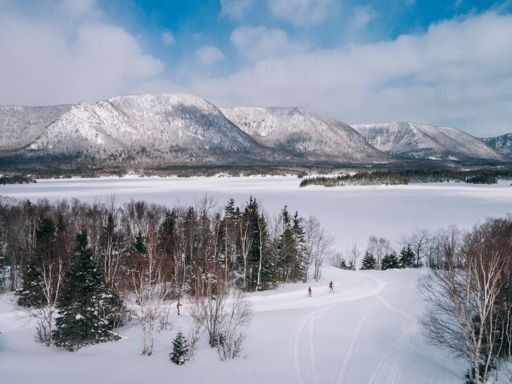
2019 Results
The year started with a record winter season with licensed room nights
sold up 14% from January to March. This was boosted by hosting the
Scotties Tournament of Hearts in Sydney, which brought an estimated
3,000 room nights sold in February.

Overall, the tourism season showed mixed results. Licensed room
nights sold were down in the spring and summer, but up 7% in October.
From January to October, licensed room nights sold were down 1%.

However, this was only part of the accommodation picture. Shared
economy unit nights sold from January to October were up 44%. While
a portion of these units are offered by licensed accommodations, it is
estimated that 70-75% are unlicensed. An estimate of the combined
licensed room nights and unlicensed shared economy unit nights sold
shows that, overall, the Island was up 3% for the year to the end of
October.

In addition to licensed room nights and shared economy unit nights
sold, Destination Cape Breton tracks progress the following indicators:
• Visitation to experiential icons;
• Traffic and engagement on visitcapebreton.com; and
• Social media insights.
The detailed results of each are provided on the following pages.

                                                                          3
Licensed Room Nights Sold by Month
January-October 2015-19
100
90
90 86 86
83 83
79
80 77
74 73
70 71
69 68
Room Nights Sold (000s)
70
61 62
60
Source: Nova Scotia Tourism Indicators
53 52 54
50 49 50
50 46 47
43
40
40
32
30
30 28
26
21
19 19 19
20 17 17 16 17 17 16 16
14 13 13 15
12 11 13 12 12 11
10
0
Jan Feb Mar Apr May Jun Jul Aug Sep Oct
2015 2016 2017 2018 2019
Overall, licensed room nights sold were down 1% from Air visitation to the province was down 7%, with the
January to October compared to 2018. Nova Scotia grounding of the Boeing 737 Max and its impact on flight
overall, was down 2% for the same period, so the Island schedules being a major contributing factor. The CAT
fared slightly better comparatively. The occupancy rate ferry being out of service was an other challenge. Many
for the Island was on par with 2018 at 53%. operators reported experiencing many cancellations in
September as a result of Hurricane Dorian. 4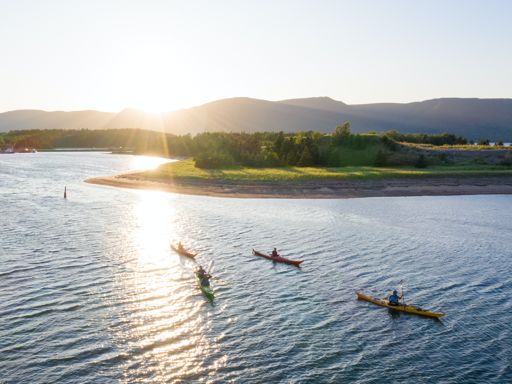
Shared Economy Unit Nights Sold by Month
                                                         January-October 2017-19
                   25,000

                                                                                                             21,943

                   20,000
                                                                                                 18,328

                                                                                                             14,867
                   15,000                                                                                               13,577
Unit Nights Sold

                                                                                                 13,080

                                                                                                                                    11,211
                                                                                                                        10,045
                                                                                      9,565
                   10,000                                                                                    8,993                  8,696
                                                                                                  7,089
                                                                                      6,285
                                                                          5,159                                          5,349
                                                                                                                                    4,801

                                                                                                                                              Source: AIRDNA
                    5,000                                                 3,638
                                                            2,558                     2,858
                                     1,530       1,747      1,590
                            1,142                 893                     1,262
                             543
                             140      527
                                      222         254        435
                        0
                            Jan       Feb        Mar        Apr           May          Jun        Jul        Aug         Sep        Oct

                                                                2017         2018       2019

               The chart illustrates the significant increase in shared           experienced relatively few overnight visitors, such as
               economy unit night sold over the past three years. In              Glace Bay or Arichat. However, in communities with
               2019, there was a 44% increase in unit nights sold. This           many overnight visitors, such as Chéticamp or Baddeck,
               growth has supported the dispersal of visitors around              it further divided the share of room nights, resulting in
               the Island to communities that had previously                      difficult seasons for some operators.
                                                                                                                                              5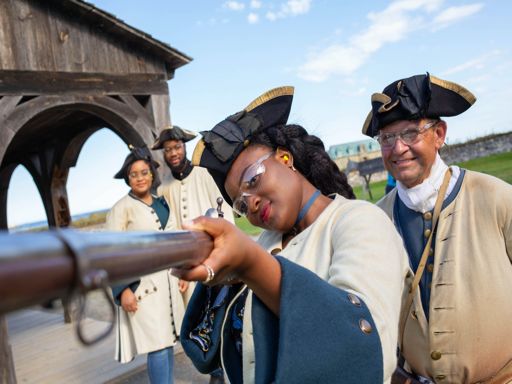
Combined Room/Unit Nights Sold
                                         January-October 2017-19
               500,000

               450,000
                                        41,682                                 61,954
               400,000

               350,000

                                                                                                                      Source: Nova Scotia Tourism Indicators, AIRDNA
               300,000

               250,000

               200,000                 415,000                                411,000

               150,000

               100,000

                50,000

                     0
                                        2018                                    2019

                                       Licensed       Shared Economy (Unlicensed)

The chart illustrates and estimate of the combination of    It should be noted that the shared economy unit nights
licensed room nights sold and unlicensed shared             could include a rental of an entire house with multiple
economy unit nights. Although there was a 4,000             bedrooms, which are counted as one unit rather than
decrease in licensed room nights sold, there was a          multiple rooms.
20,000 increase in unlicensed unit nights.                                                                            6
Visitation to Parks Canada Sites 2018-19
                    350

                                                                                                295        301
                    300

                    250
Admissions (000s)

                    200

                    150

                                                                                                                             Source: Parks Canada
                    100         80                           86        87
                                           70

                     50

                      0
                          Fortress of Louisbourg NHS   Alexander Graham Bell NHS            Cape Breton Highlands NP

                                                          2018     2019

As with the season overall, visits to Parks Canada sites           experienced a challenging year with visitation down
showed mixed results. Visitation to the Cape Breton                13%.
Highlands National Park increased 2% to 301,270.
Revenues at the Park also increased 2%, but revenues               The Alexander Graham Bell National Historic Site
for experience programs increased 15%.                             experienced a modest 1% increase to 87,000 visits. This
                                                                   was aided to a great degree by cruise ship visits.
The Fortress of Louisbourg National Historic Site                                                                            7
visitcapebreton.com Sessions 2015-19
  900,000
                                                                                                    816,096
                                                                               795,278
  800,000

  700,000                                                 673,005

  600,000

  500,000                              471,344

  400,000

                292,671
  300,000

                                                                                                                        Source: Google Analytics
  200,000

  100,000

       0
                 2015                   2016               2017                 2018                  2019

The chart shows the growth of website traffic over the      This recovered to a stable rate after a couple of months,
past five years. Sessions in 2019 were up 180% over         but did impact overall traffic.
2015, which indicates significant growth. Over the past
year, sessions were up 3% over 2018.                        Additionally, although website traffic was up, site
                                                            engagement levels showed decreases, mostly attributed
A new website was launched in June 2019, which              to more awareness tactics within the digital campaign
                                                                                                                        8
resulted in a temporary dip in organic search traffic.      such as display and social ads.
visitcapebreton.com Sessions by Market 2018-19
180,000

160,000          152,962                                      152,248
                                                        137,686
140,000
           126,634
120,000

100,000
                                         83,287
 80,000
                                63,338

                                                                                                                       Source: Google Analytics
 60,000

 40,000                                                                                                      34,822
                                                                                                    30,348
                                                                              24,022 23,717
 20,000

      0
              Ontario              Quebec                 Maritimes          Massachusetts            New York

                                                   2018           2019

Traffic from all target markets was up, with the              Quebec continued to grow as a market, with traffic
exception of Massachusetts, which was down slightly.          increasing by 32%.
Ontario continued to be the top market with a 21%
increase in traffic, followed by the Maritimes, which         Within the United States, New York increased 15%,
increased 11%. Within the Maritimes, Nova Scotia was          while Massachusetts decreased 1%. Although not
up 3%, but New Brunswick was up 66% and Prince                targeted, Illinois traffic grew by 208% to over 10,800
                                                                                                                       9
Edward Island was up 31%.                                     sessions.
Social Media Follower Growth 2018-19
120,000
109,810
100,000
82,317
80,000
Source: Facebook, Instagram, Twitter Insights
72,415
58,012
60,000
40,000
27,289
20,000 15,200
9,105 10,106
0
Facebook Instagram Twitter Total
December 31, 2018 December 13, 2019
Social media follower growth increased 33% in 2019 to 57% to over 900,000. Video views for the year increased
almost 110,000. Facebook increased 25%, Instagram were just shy of 4 million, which was on par with 2018.
increased 80%, and Twitter increased 11%. The hashtag #visitcapebreton was used 21,579 times in
2019.
In addition to follower growth, the total number of
engagements (likes, comments, shares) increased by 102020-21 Strategy Overview
11Guiding Principles
The 2020-21 strategy for DCBA is based on the following guiding
principles:
1. It is developed in alignment with the ACOA Tourism Innovation
Action Plan and Tourism Nova Scotia’s Driving Export Revenue
Strategic Plan.
2. It adheres to the Research/Product Innovation/Marketing
Continuum.
3. It continues to build on the established core assets/motivators,
including:
Coastal/Seacoast Experiences
Sightseeing and Touring
Culture, Entertainment and Heritage
Outdoor Activities
Major and International Events
Experiential Accommodations
4. It continues to utilize Destination Canada’s award winning and
proven Explorer Quotient (EQ) psychographic profiles, focusing on
Authentic Experiencers and Cultural Explorers.
5. It bases all decisions on the best evidence, wherever possible.
12Goals and Objectives
To generate incremental growth in Cape Breton Island’s tourism
economy, the strategy will focus on two main areas:
• Maximizing capacity within all periods of the year through
increasing visitation and season extension; and
• Increasing the yield (i.e. revenues generated within the destination)
from each visitor.
Using these two methods of growth, the measurable goals must reflect
the maximization of plant capacity and increasing the revenue yield per
visitor. This will include measuring room and unit nights sold at
registered accommodations, as reported by Tourism Nova Scotia, and
tracking marketing levies per room night sold. Using 2019 as a
benchmark, the goal targets will be:
A 2% increase in registered room and unit nights sold on Cape Breton
Island with the majority of the increase coming in the shoulder and
winter seasons; and
A 2% increase in levy revenue yield per registered room or unit night
sold.
13Research
14Research
The continuum begins with research to define the target audience,
identify shifts, and what they are seeking in the destination.
Research conducted over the past number of years has shown that the
target audience can be defined as follows:
Demographic
• Empty nest couples aged 45-70 (boomers and Gen X)
• Pre-nest young adults (millennials)
• Females do majority of travel planning (58% of web visits)
Geographic
• Ontario
• Quebec
• Maritimes
• New York
• Massachusetts
Psychographic (EQ Types)
• Authentic Experiencers (33% of visitors)
• Cultural Explorers (24% of visitors)
Destination Canada categorizes Authentic Experiencers and Cultural
Explorers as ‘Learners’. They are drawn by culture and natural beauty.
They seek engagement in a destination – to meet locals and to be
participants in the culture.
15Travel Motivators
100%
90% 86%
83%
80%
Source: Cape Breton Travel Intention Survey
70%
60% 57% 59% 55%
50% 52%
50%
43% 41% 42%
40% 36%
32%
30%
23%
20%
20%
10%
0%
Coastal Outdoor Experience Gaelic Historic Culinary Experience Experience
sightseeing adventure culture experiences experiences Acadian culture Indigenous
culture
2017 2019
When comparing the top motivators to visit Cape Breton Outdoor adventure was the second motivator and it
Island as determined through the Travel Intention increased slightly. Although there were decreases in
Surveys of 2017 and 2019, coastal sightseeing (including some categories, these categories remained the top
the Cabot Trail which is also the top motivator to Nova motivators. As such, marketing content should focus
Scotia as a whole) continues to be the top motivator, mainly on these motivators.
although it dropped slightly. 16Other Trends and Observations
Through research conducted in 2019, a number of other trends are
emerging:
• Ad recall rates rose for online and social media, but declined for TV
and consumer shows.
• The travel planning cycle is trending toward longer planning cycles,
with 67% planning three or more months out from their vacation.
• There has been a consistent growth in visitors citing that they
travelled to Cape Breton by air at 23% in 2019 compared to just 15%
in 2015.
• Of those who travelled to Cape Breton Island by air, 35% flew into
Sydney with the vast majority of those visitors stating they had taken
a direct flight from either Toronto or Montreal.
• The average length of stay increased from 5.3 nights in 2017 to 5.6
nights in 2019.
• 45% of visitors stated that they wanted to experience Cape Breton
music during their visit, but only 38% did, indicating that more can be
done to promote live music on the Island.
• There was a significant decrease in intent to visit the Fortress of
Louisbourg as part of the trip, which mirrored the decline of
visitation. 17Research Objectives
In pursuit of the goals, the following strategic objectives have been
defined for Research:
1. To continue to measure and report on key performance indicators
- Room nights sold
- Shared economy unit nights sold
- Google Analytics
- Social media insights
2. To explore other options to collect market intelligence on Cape
Breton Island’s target audiences and tourism performance
- Work with partners (Tourism Nova Scotia, ACAT, Destination
Canada) to monitor what they are using
- Explore new options for measuring tourism performance with Cape
Breton University’s World Tourism Institute (WTI)
- Continue to support CheckIn Analytics in developing a platform for
real-time data on room nights
3. To monitor global travel research for trends that may aid or impact
Cape Breton’s tourism industry
- Attend key destination focused events
- Monitor global tourism research sources such as Skift, World
Tourism Organization, Phocuswright, etc.
18Product Innovation
19Product Innovation
The investment in product innovation on Cape Breton Island over the
past number of years has been significant. Numerous initiatives have
been implemented, following the ACOA/Tourism Atlantic Toolkit and
Tourism Nova Scotia’s Experience Excellerator program, to raise the
product offering on the Island to a new level. The result is that Cape
Breton Island has gone beyond market readiness for many experience
categories and is pursuing the development of world-class offerings.
In 2019, an experience development workshop was conducted in
partnership with Tourism Nova Scotia and Parks Canada, with another
planned for early 2020. A number of operators went through the
Experience Excellerator program and more have applied for 2020.
In culinary, Destination Cape Breton supported a local food
ambassador, Alicia Lake, to attend a best practice mission in Portland,
Oregon. Subsequently, the organization partnered with the Cape
Breton Food Hub, NSCC, and ACOA to initiate an advanced market
readiness program for the culinary sector. NSCC will address
professional development and training opportunities identified through
the AMR program.
A new event, the Cabot Trail Food Truck Rally, was created to facilitate
the extension of the fall season beyond Celtic Colours. Destination
Cape Breton also supported the Cape Breton Jazz Festival in hiring a
consultant to review their operation and make recommendations to
elevate the event.
20Product Innovation Activities
Cultural Tourism Development
Destination Cape Breton has worked closely with tourism stakeholders
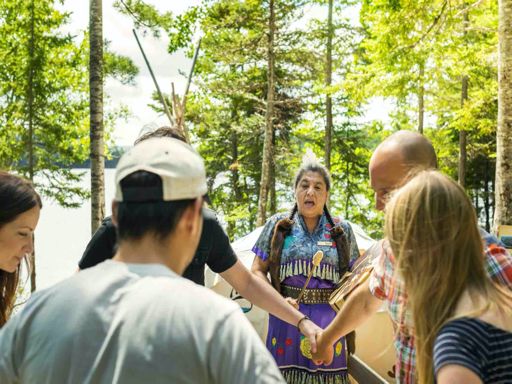
within the three main cultures of Cape Breton Island: Mi’kmaq,
Acadian, and Gaelic. These discussions are important to foster deeper
understanding of each culture, respectful ways to support and promote
each culture, and to learn about new experiences and developments.
Experience Development
Building on the initiatives of the past year, Destination Cape Breton will
host a number of experience development events, including:
• Experience innovation workshops;
• An experience-focused start-up event;
• Exploring best practice missions; and
• Webinars or other educational events for industry.
Event Development
A new Cape Breton Island Events Strategy is nearing completion and
the strategy will recommend that Destination Cape Breton, in
collaboration with partners, implement a process of creating new
events, innovating existing events, and attracting events. Within this
strategy, Destination Cape Breton will act as a catalyst to bring partners
together and provide support. The focus will be on building the
shoulder and winter seasons. The Signature Events and Community
Festivals and Events programs will also continue.
21Industry Education, Training and Development
Collaboration with both Cape Breton University, primarily through the
World Tourism Institute, and NSCC will continue to be a focus. The
development of a comprehensive customer service program will be a
priority. The culinary AMR program will continue and other possibilities
for new AMR initiatives will be explored. Industry conferences, such as
the Tourism Innovators Summit hosted in partnership with the WTI, will
be developed.
Tourism Innovation
Destination Cape Breton will continue to collaborate with the local
innovation community to encourage innovation both within the
tourism industry and ancillary to the industry (e.g. technology tools and
platforms). The Tourism Startup Weekend was a success and a similar
event will be explored for 2020. Other opportunities will be explored
for competitions such as the Intersect Challenge that resulted in the
creation of a new startup called CheckIn Analytics.
22Product Innovation Objectives
In pursuit of the goals, the following strategic objectives have been
defined for Product Innovation:
1. To work with Mi’kmaq, Acadian, and Gaelic cultural tourism
partners to support their growth and development
- Coordinate regular meetings of each cultural tourism group to
deepen understanding of each culture, obtain guidance on the
respectful presentation of each culture in promotional efforts, and
learn about new experiences and developments
- Continue to support sharing sessions that bring together elders,
culture bearers, historians and folklorists from each main culture to
discuss shared histories and experiences
2. To work with industry and partners to identify, innovate, and
increase the inventory of value-added experiences that can be
classified as ‘world class’
- Continue implementing experience innovation events
- Continue the experience start-up event with CBU and partners
- Identify candidates for the Experience Excellerator program
- Explore opportunities to participate in or develop best practice
missions
- Explore other experience-focused webinars and training options for
industry
233. To collaborate with partners to create or innovate festivals and
events that can serve as travel motivators in the winter and
shoulder seasons
- Identify opportunities and bring partners together to create a
robust calendar of events
- Continue the Signature Events program
- Continue the Community Festivals & Events program with the five
municipalities and ACOA
4. To build and enhance the winter product
- Work with partners to create new experiences and events for
winter
- Mobilize advocacy to support winter season development
5. To collaborate with Cape Breton University and NSCC to enhance
industry education, training, and development
- Work with the WTI to explore and pursue opportunities,
particularly for customer service training
- Explore the hosting of another Tourism Innovators Summit in
partnership with the WTI
- Work with the Cape Breton Food Hub and NSCC to implement the
Culinary AMR program, professional development activities, and a
culinary-focused conference
6. To collaborate with the Cape Breton Island innovation community
to foster and support tourism innovation
- Coordinate another tourism startup event
- Establish an innovation committee to explore other opportunities
for challenges or innovation initiatives
24Marketing
25Marketing The proliferation of mobile technology has created a fundamental shift in consumer behaviour. People don’t “go online” anymore; they live online. And in this new reality, we act on our needs and make decisions in what Think with Google calls micro-moments. For travel, Think with Google has defined four key micro-moments, as outlined below: I-want-to-get-away moments: a.k.a. "dreaming moments" that happen when people are exploring destination options and ideas with no firm plans. At this stage, people are looking for inspiration. Time-to-make-a-plan moments: a.k.a. "planning moments" that happen when people have chosen a destination. They're looking for the right dates, the right flight, the right place to stay, and all the things they'll do while they're there. Let's-book-it-moments: a.k.a. "booking moments" that happen when the research is done, and people are ready to book their tickets and reserve their rooms. Can't-wait-to-explore moments: a.k.a. "experiencing moments" that happen when the trip is underway. Travelers are ready to live the trip they've been dreaming about—and share it with others. These micro-moments provide a Path to Purchase that Destination Cape Breton has been using for the past three years. The following page outlines the tactics that will be employed to reach the target audience at each stage of the Path to Purchase. 26
The Path to Purchase
DREAMING >            PLANNING >            BOOKING >             EXPERIENCING >
Digital Marketing     Digital Marketing     Digital Marketing
 Display               Category search       Branded search
 Video                 Re-marketing          Re-marketing
 Social                Social                Social
                       Email

Content (Hero)        Content (Hub)         Content (Help)        Content
 Hero video            Locals blogs          Locals blogs          User-generated (UGC)
 Influencers           Experience videos     Itineraries           Reviews
 Travel media          List-style content    Packages
                       Operator listings     FAQ

Collateral Material   Collateral Material   Collateral Material   Collateral Material
 Experience Guide      Experience Guide      Experience Guide      Map
                       Seasonal Guides       Seasonal Guides

TV                    Print
 Regional              Saltscapes
                       Motorcycle Guide

Artist Ambassadors    Saltscapes Expo

Activations           Travel Trade          Travel Trade
                                                                                          27
Marketing Activities
Digital Marketing
Digital marketing is the largest component of the Destination Cape
Breton marketing campaign, by far, and delivers the strongest ROI.
Over the past few years, DCBA has partnered with Tourism Nova Scotia
through their Digital Marketing Program, which provides matching
dollars to target the key markets. This investment is complemented by
additional digital marketing to target the Maritimes and an ‘always on’
approach that is designed to reach the target audience at key micro-
moments.
For 2020, there will be a stronger focus of the digital marketing
campaign on engagement and conversion. A greater share of the
budget will be allocated to search engine marketing. The campaign will
also start earlier, as per the research showing longer travel planning
cycles, with a stronger allocation in the first quarter of 2020.
Content Marketing
A content strategy was developed for 2019, which will be honed and
adjusted. This strategy follows the ‘Hero, Hub, Help’ approach of
Destination Canada’s Content Playbook to identify content and
distribution channels that will reach the target audience at each stage
of their path to purchase.
The communities of interest (COI) model will be integrated within the
content marketing strategy to utilize local advocates and targeted
influencers to create and disseminate content.
28Website
A key piece of the digital marketing and content strategies is the
website, which has been designed to be a content hub. The website will
continue to be optimized for performance in terms of:
• Greater landing page optimization and alignment with ad creative;
• Stronger calls to action to motivate goal conversions, particularly
clicks to operator websites;
• Continued imagery alignment to ensure that visitors viewing
seasonal campaign content only see imagery reflective of those
seasons;
• Continued mobile optimization to ensure the best possible
experience for the majority of the site visitors; and
• Adding a Music section that will highlight where visitors may
experience live music.
Collateral Material
The Cape Breton Island Experience Guide continues to be the main
lure/fulfillment piece for visitors and receives strong praise from
visitors and front-line staff in visitor information centres. Upon a review
of visitor recall of the guide, the distribution of the guide will be
adjusted and reduced in 2020.
Seasonal campaign collateral has been developed over the past few
years, including a Taste of Autumn brochure and a Winter Guide. These
guides will be continued and will be complemented with a new Spring
Guide.
The Cape Breton Island Map will continue to be produced for visitors
on Island and provided through visitor information centres.
29Television
Television advertising continues to be effective with the Maritimes,
particularly with news programs. For 2020, there will be regional
spring, fall and winter (2021) campaigns on TV.
Print
Saltscapes Magazine continues to have strong recall within the
Maritimes and a 2020 buy will focus on spring, fall and winter (2021).
As well, an ad will continue to be placed in the Atlantic Canada
Motorcycle Touring Guide, which is widely utilized by that market.
Artist Ambassadors
The Island’s touring artists are the finest salespeople of our destination.
Destination Cape Breton partnered with Natalie MacMaster and
Donnell Leahy and family, the Barra MacNeils, and the Men of the
Deeps in 2019 to promote the Island during their tours. These
partnerships will continue and additional partnerships are being
explored with Ashley MacIsaac, Còig, and Pretty Archie for 2020.
Travel Trade
Destination Cape Breton will continue to work closely with Tourism
Nova Scotia’s sales team to support their efforts to draw more visitors
to the province, and Cape Breton Island specifically. This will include:
• Collaborating on in-market sales missions;
• Collaborating on travel trade fam tours; and
• Attending Rendezvous Canada.
In addition, efforts will be made to work with receptive tour operators
within the region to encourage them to increase the Cape Breton Island
30share of their itineraries. They will be invited to tour the Island to see
the experiences that can build their itineraries.
Activations
To support the growth in direct air travel to the Island, activations will
be planned and executed in both Toronto and Montreal. Both
activations, to be planned with key partners, will include a contest
promotion and an industry event with media, in-market influencers,
event planners, and members of the travel trade.
Influencers and Travel Media
Destination Cape Breton will continue to work closely with Tourism
Nova Scotia to identify and bring key influencers and travel media to
the Island. As well, key influencers in Toronto and Montreal will be
invited to the in-market activations and to visit Cape Breton.
Saltscapes Expo
The recall rate for this consumer show declined in 2019 and, as a result,
Destination Cape Breton is reducing its investment in the show for
2020. A Cape Breton presence will continue be coordinated.
User-generated Content (UGC)
Recommendations of friends and family is one of the most effective
ways that potential visitors learn about a destination. A campaign will
be developed in working with operators that encourages visitors to
share their photos and videos on social media and utilizing the
#visitcapebreton hashtag.
31Marketing Objectives
In pursuit of the goals, the following strategic objectives have been
defined for Marketing – Leisure:
1. To increase website traffic on cbisland.com by 5% to reach 855,000
sessions, while increasing the partner events on the site to 25%
- Strengthen the digital marketing campaign
- Optimize the website for conversion
- Implement an email marketing campaign
2. To increase the social media footprint by 25% to reach 135,000,
while also increasing the total number of engagements by 25%
- Enhance the content marketing strategy
- Integrate the COI approach across all aspects of the content
strategy
- Identify and build relationships with local advocates in other travel
motivator categories
- Bring in targeted influencers
- Continue Summer Intern program
3. To increase demand in high-value markets
- Plan and execute activations in Toronto and Montreal
- Continue distribution of the Experience Guide in Ontario
- Enhance and expand the Artist Ambassador program
- Collaborate with Tourism Nova Scotia to target the travel trade
- Continue to work with Tourism Nova Scotia to target travel media
and influencers
324. To drive shoulder and winter visitation from the Maritimes region
- Plan and execute spring, fall and winter campaigns using digital,
social, TV, specialty print
- Continue distribution of the Experience Guide within the region
- Continue working with Live Life in Tents and other partners on
seasonal Creatives Weekends
- Continue attending the Saltscapes Expo with a reduced investment
5. To encourage increased length of stay and yield per visitor
- Add messaging on the website to encourage longer stays
- Develop and promote 7-day itineraries
- Work with receptive operators to increase Cape Breton Island’s
share of their Maritimes itineraries
6. To mobilize visitors into advocates for Cape Breton Island
- Develop and implement a UGC campaign in conjunction with
operators
33Niche Markets
34Meetings and Events
The Island played host to a number of major events in 2019, including:
• Scotties Tournament of Hearts;
• National Legion Youth Track and Field Championships;
• STIHL Timbersports Championship; and the
• National Major Little League Baseball Championships.
Major events on the schedule for 2020 include:
• National Darts Championship;
• National Senior Men’s Baseball Championship;
• National Legion Youth Track and Field Championships;
• USPORT National Women’s Soccer Championship; and
• Nova Scotia Music Week.
The Island also hosted a number of meetings and conferences,
including the Canada-New England Cruise Symposium, Tourism Industry
Association of Nova Scotia Annual General Meeting, among others.
As mentioned in the Product Innovation section, a Cape Breton Island
Events Strategy is nearing completion and the strategy will recommend
that Destination Cape Breton, in collaboration with partners,
implement a process of creating new events, innovating existing
events, and attracting events. This will include the implementation of
recommended tactics within the strategy and a robust focus on
attraction of sporting events and right-sized meetings. In 2020, this
process will be more integrated within the Destination Cape Breton
structure and will align with the Events Nova Scotia strategy.
35Niche Ports and Marine Tourism
Destination Cape Breton continued its role in representing the Island’s
three niche ports (Baddeck, Louisbourg, and Chéticamp) within the
Atlantic Canada Cruise Association (ACCA). DCBA provided ACCA with
content and information required to promote the Island’s niche ports
through their activities. Currently, there are 10 scheduled visits to the
niche ports in 2020.
Discussions have taken place with the Port of Sydney to take a lead role
with the niche ports, with DCBA continuing to play a supporting role.
Given that the Port has relationships with most of the cruise lines and
knows the industry, their expertise will help develop opportunities for
the niche ports.
With the majestic Bras d’Or Lake and scenic coastal ports, Cape Breton
Island is well positioned for growth in marine tourism. Destination Cape
Breton continued its partnership with Develop Nova Scotia to attract
superyachts and larger vessels to Cape Breton Island. Implementing in
infrastructure upgrades for these vessels, such as those planned for the
Baddeck Wharf, will also enhance the marine experience for other
boaters.
Develop Nova Scotia plans to release its marine tourism strategy early
in 2020, which will include priorities for Cape Breton Island, and
collaborative promotional efforts are being planned.
36Niche Markets Objectives
In pursuit of the goals, the following strategic objectives have been
defined for Niche Markets:
1. To increase the number of major events hosted on-Island in 2021
and 2022
- Work with key stakeholders to prioritize and implement the
recommended actions within the Cape Breton Island Event Strategy
- Identify events to target, in alignment with the Events Nova Scotia
categories, and develop strategies to attract those events
- Integrate the Events Cape Breton project more closely within the
Destination Cape Breton structure
- Attend key events like the CSTA Sports Events Congress
2. To increase the number of meetings and conferences hosted on-
Island in 2021 and 2022
- Work with stakeholders to identify meetings and conferences to
target and develop strategies to attract those events
- Develop new marketing materials for meetings and events
- Develop and implement a new partnership program for meetings
and events
3. Build the niche ports visitation schedule for 2021 and beyond
- Formalize a new partnership with the Port of Sydney to lead the
marketing of the niche ports along with ACCA
- Implement a niche port development workshop
- Form and formalize a niche ports committee
374. Develop the marine tourism market in partnership with Develop
Nova Scotia
- Work with Develop Nova Scotia and stakeholders to prioritize and
implement the recommended actions within their new marine
tourism strategy
- Work with Develop Nova Scotia and stakeholders to implement a
COI approach to marketing the marine tourism experience
- Collaborate with Develop Nova Scotia to target superyachts and
large vessels
38Industry Mobilization
39Industry Mobilization Objectives
The implementation of the strategy requires the participation of
industry operators and partners. As such, a number of objectives to
mobilize the industry have been identified:
1. To enhance communication channels with industry
- Conduct pre-season industry sessions around the Island
- Continue the monthly industry newsletter and expand the
subscription list
- Enhance and update the industry page on visitcapebreton.com
- Continue regular meetings with the Product Innovation and
Marketing Committees
2. To build confidence in the tourism industry by promoting tourism
as an economic driver for the Island and increasing awareness of
the tourism product
- Develop and distribute a year-end report
- Conduct ’State of the Industry’ presentations in conjunction with
the Island’s chambers of commerce
- Continue to nominate and promote tourism award winners
40For more information, visit: cbisland.com/dcba-industry-page
You can also read