DEVELOPING NEW INDICATORS TO DESCRIBE DIGITAL TECHNOLOGY INFRASTRUCTURE IN PRIMARY AND SECONDARY EDUCATION
←
→
Page content transcription
If your browser does not render page correctly, please read the page content below
BACKGROUND PAPER FOR ICT IN EDUCATION STATISTICS                             FEBRUARY 2015

    DEVELOPING NEW INDICATORS TO DESCRIBE
    DIGITAL TECHNOLOGY INFRASTRUCTURE IN
      PRIMARY AND SECONDARY EDUCATION

  By Peter Twining (Open University, United Kingdom), Niki Davis (University of
  Canterbury, New Zealand) and Amina Charania (Sir Dorabji Tata Trusts, India)

  with Aleta Chowfin (University of Canterbury, New Zealand), Fiona Henry (Open University,
       United Kingdom), Hasniza Nordin (Universiti Utara Malaysia, Malaysia) and Clare
                        Woodward (Open University, United Kingdom)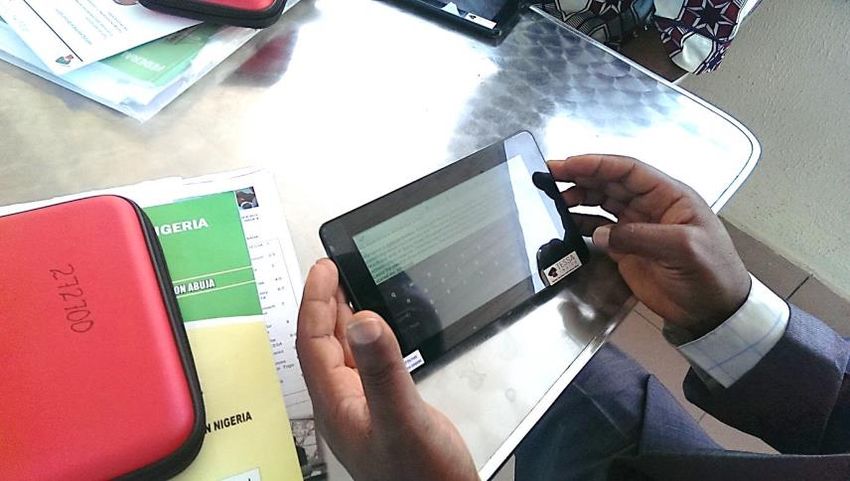
Table of contents
1.    Introduction ......................................................................................................................4
      1.1 Context .....................................................................................................................4
      1.2 Defining ICT ..............................................................................................................5
      1.3 Some emerging trends ..............................................................................................6

2.    Methodology and approach ..........................................................................................11
      2.1 Vignettes.................................................................................................................11
      2.2 Existing indicators ...................................................................................................12
      2.3 Analysis to develop new indicators .........................................................................13

3.    Data analysis – new indicators .....................................................................................15
      3.1 Visions, strategies, curricula and teacher education................................................15
      3.2 Environment ...........................................................................................................18
      3.3 Electricity supply .....................................................................................................20
      3.4 Media type ..............................................................................................................21
      3.5 Access ....................................................................................................................22
      3.6 Technology model ..................................................................................................26
      3.7 Connectivity ............................................................................................................31
      3.8 Funding...................................................................................................................36
      3.9 Digital content .........................................................................................................37
      3.10 Assessment ...........................................................................................................39
      3.11 Management Information Systems (MIS) ................................................................40

4.    Recommendations and conclusions ............................................................................42
      4.1 Indicators related to visions and strategies (high priority) ........................................44
      4.2 Indicators related to assessment (high priority) .......................................................44
      4.3 Indicators related to electricity supply (high priority) ................................................45
      4.4 Indicators related to connectivity (high priority) .......................................................46
      4.5 Indicators related to access to devices (high priority) ..............................................47
      4.6 Other indicators ......................................................................................................49
      4.7 Cautions .................................................................................................................52
      4.8 Concluding remarks ................................................................................................53

5.    References .....................................................................................................................54

6.    Appendices ....................................................................................................................58
      6.1 Biographies of the authors ......................................................................................58
      6.2 Vignettes.................................................................................................................59

List of tables and figures
Tables
Table 2.1.A Vignettes produced for UNESCO Institute for Statistics with an indication of the relevance of
            the project for the themes of all three papers commissioned
Table 3.1.A The categories on the Vision dimension (based on Twining 2014b)
Table 3.1.B Categories on the new Policy dimension
Table 3.2.A Typologies of education systems (adapted from Rix & Twining 2007, p. 337)
Table 3.2.B Summary of the eSIR Reference Statement (First published under CC licence in Twining et
              al. 2006, p. 14)

                                                                 - ii -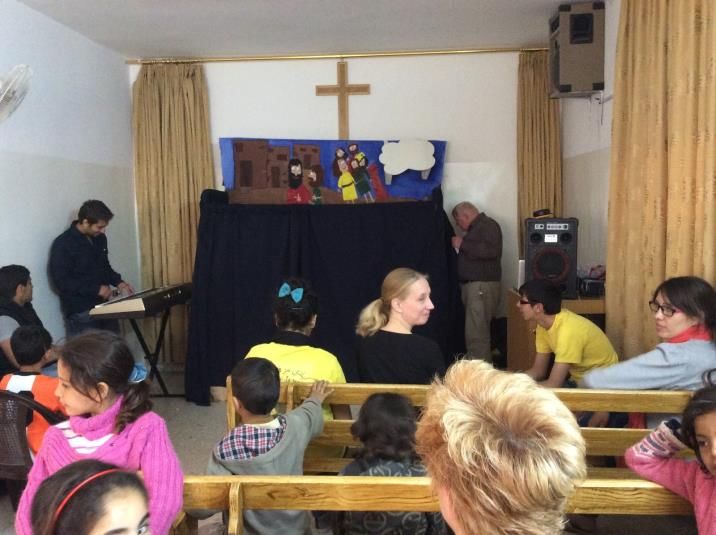
Table 3.2.C The spatial and temporal environments (based on Twining et al. 2006, p. 14 and Rix &
Twining 2007, p. 337)
Table 3.2.D Categories on the new Provider dimension
Table 3.3.A The new Electricity dimension
Table 3.4.A Media type
Table 3.5.5.A The revised Provision dimension (based on Twining 2014a p. 430)
Table 3.6.1.A The new Device Type dimension (based on Twining 2014b)
Table 3.6.2.A The revised Control dimension (based on Twining 2014a p. 432)
Table 3.6.3.A The Technical Support dimension (based on Twining 2014a p. 432)
Table 3.7.2.A The new Internet access dimension
Table 3.7.3.A The Network type dimension (based on Twining 2014a p. 430)
Table 3.7.4.A The new Network Access dimension
Table 3.7.4.B The Access dimension (based on Twining 2014a p. 431)
Table 3.7.5.A The Hosting dimension (based on Twining 2014a p. 431)
Table 3.7.6.A The new Filtering dimension
Table 3.8.A The revised Funding dimension (based on Twining 2014a p. 432)
Table 3.9.A The new Tool dimension
Table 3.10.A An embryonic (summative) Assessment dimension
Table 3.11.B The new MIS dimension (based on OECD 2010)
Figures
Figure 1.3.A Davis’ global arena of change with ICT in schooling showing a distant teacher working with
students in at least two schools, as well as the ecosystems within which a teacher enabled by ICT is
nested at the centre (Creative Commons, first published in Davis, Eickelmann & Zaka 2013).
Figure 2.3.A Dimensions of practice from the Vital and Snapshot Studies (Creative Commons license first
published in EdFutures.net 2014)
Figure 3.11.A Comparison of Learning and Social learning analytics (based on Twining 2014d)
Figure 4.A Drivers and enablers in education (based on Laurillard 2012 p. 75 with permission)
Figure 4.B Recommended dimensions for ICT infrastructure and metrics at a national level
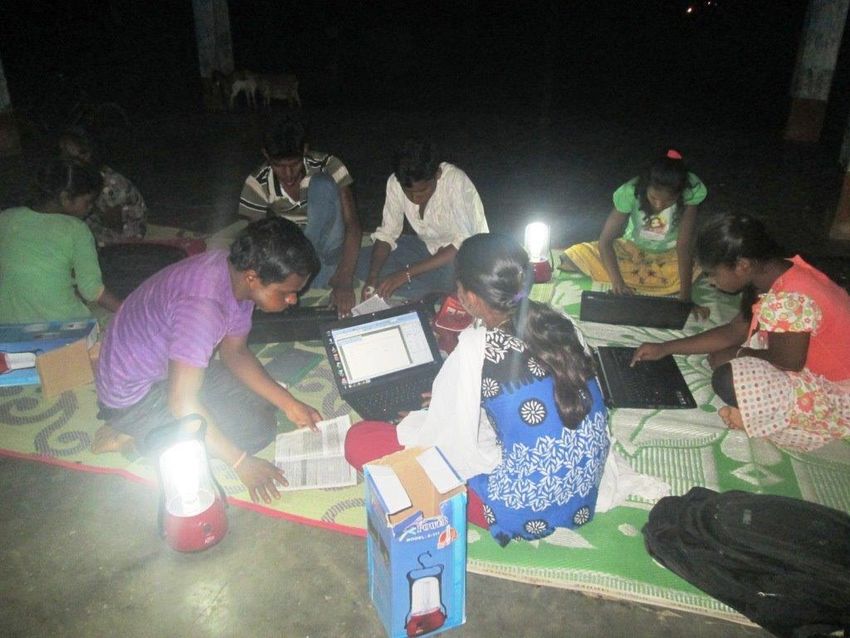
Figure 6.2.2.A Children in a remote tribal village at work on their ITE projects lit by solar lanterns (with
permission from photographer Rhul Bose).
Figure 6.2.2.B The first tribal woman to drive in this remote region; she is driving the ITE van (with
permission from photographer Rhul Bose).
Figure 6.2.4.A A screen shot of a folder created in the VLE by a Malaysian teacher of computing for her
students studying computing (KOMPUTER).
Figure 6.2.4.B A screen shot of a resource that a Malaysian teacher of computing placed in a folder in the
VLE for her students to access (a labelled diagram of a computer system).
Figure 6.2.5.A A volunteer using her personal smart phone with refugees at the Saturday programme
(with permission).
Figure 6.2.5.B Screenshot from the author’s iPad showing the Saturday programme’s Google Group. Mrs
Rogers tells Ms. Cowfin in an online message that she has attached the images of the 4 signs used to
prompt children to remember to return supplies etc. (with permission)
Figure 6.2.5.C Screenshot from the author’s iPad showing the sign used to prompt children to remember
to return pencils. (with permission)
Figure 6.2.5.D Refugee children and volunteers enjoy a puppet show at the Saturday programme. (with
permission)
Figure 6.2.5.E A diagram showing the sequence of four activities for one particular Saturday morning,
including the necessary resources. This was used for planning and also briefing volunteers.
Figure 6.2.7.A A Sumvision Cyclone Voyager tablet and cover in use in the TESSA workshop (with
permission - photograph supplied by Fiona Henry)
- iii -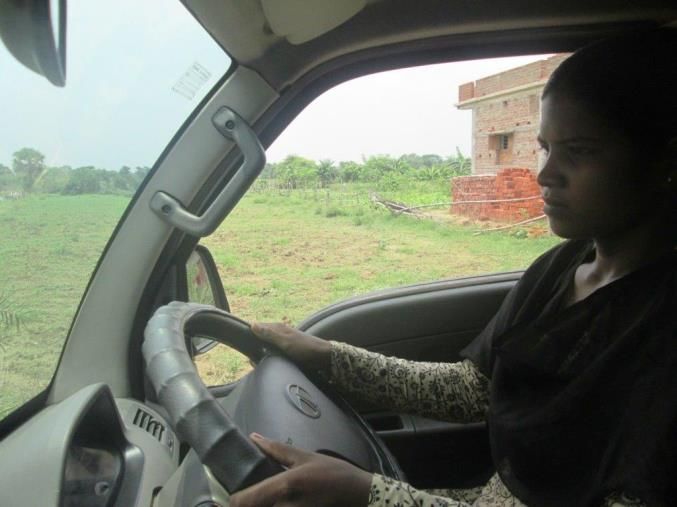
1 Introduction

1.1 Context

The paper presents a set of metrics for describing the digital technology infrastructure in the
school sector. A range of metrics already exists, however these need updating to reflect the
rapid changes in digital technology that have taken place. For example, mobile devices and
cloud-based services have emerged and achieved significant penetration in the education
sector over recent years. Education is also evolving within and beyond schools.

This paper examines the evolving nature of digital technology and the associated infrastructure
to support learning of children and young people attending schools (i.e. primary and secondary)
from both developed and developing countries in all regions. It also includes consideration of
others who may be educated without attending a school campus. It recommends new (and/or
modified) metrics to inform understanding of the digital technology provision in the school
sector, which are also recommended for consideration by partnership agencies and
organisations. While some definitions are provided in section 1.2 they are not definitive, serving
only to clarify the term ICT as used in this paper. Other terms that are not defined include
information literacy (see for example Fraillon, Schulz, Wolfram, & Ainley, 2013).

The paper has been commissioned by the UNESCO Institute for Statistics (UIS) as one of three
background papers to advance the global data collection about digital technology use in
education statistics in the post-2015 context. The 2014 review of the outcomes of the World
Summit on the Information Society (WSIS+10 2014) is useful for this context.

Both digital technology and education are evolving at an increasingly rapid pace, both
separately and together. For example, there have been significant developments in new digital
technology platforms such as mobile technologies, cloud computing, social media, open
educational resources (OERs), free and open-source software (FOSS), as well as the
associated hardware (e.g. mobile phones, tablets, e-readers, interactive whiteboards).
Opportunities and demands of globalisation and technology are fuelling transformations of
educational practices and school infrastructure so quickly that international agencies and
government Ministries are increasingly challenged to remain up to date in measuring the use
and integration of digital technologies in education. The evolution of educational systems and
digital technology also provide additional challenges to framing our perspectives, including the
emergence of virtual and networked schools that share courses and programmes within
countries and across regions (Davis, Eickelmann & Zaka, 2013). Finally, the very different
contexts of school-age children and young people can be strongly influenced by their gender
(Subrahmanian, 2007), including access to education and digital technology within and beyond
school and home, which is highly influenced by considerations of what is acceptable within the
multiple cultures within which children grow up today.

The paper also aims to examine amongst developing countries, the innovative use of digital
technology to enhance learning across the curriculum including mobile computer labs (e.g.
BRAC, a non-governmental organisation that is sometimes known as Bangladesh Rural
Advancement Committee), the use of community tele-centres in an official capacity by
educational authorities, as well as older, more traditional forms of technology-assisted
instruction that use radio and television broadcasts as part of the regular school day or on an ad
hoc basis. Digital technology resources and support provided to young people who attend
school and the educational staff who work with them may also be relevant even when provided

                                               -4-
by public and community libraries and community centres. This includes clubs that provide
access to digital technology and technical support, as well as coaching to build digital literacy
skills and skills for maintenance of digital technology devices and networks. Other forms of
innovative use of digital technology to be explored and examined include interactive radio
instruction (IRI).
The authors recognise that many of these topics cannot be addressed well without
consideration of the topics that will be covered by the two complementary papers that focus on
the ways in which digital technology is used (Gibson, Downie and Broadley In Preparation) and
the preparation, professional development and ongoing support of educators and those who
support them including leaders within schooling systems (Du Toit In Preparation). For example,
a consortium of leading organisations in international development, health, nutrition and
education recently stated in their review of educational technology

       Several studies showed that increasing students’ access to computers of itself has little
       discernible impact on teaching or learning practices. …

       The effective use of any learning technology is bound up in pedagogy, curriculum,
       purpose, roles and activities. If new technologies are introduced without changing any of
       the other aspects, nothing different is happening.
       (Power 2014 p. 7 & p. 12).

Kennisnet’s (2014) annual ‘four in balance reports’ communicates this as an ongoing balancing
process that is best driven by educational vision, supported by expertise, content and
applications, with technology infrastructure as the fourth and last basic condition.

This paper considers digital technology infrastructure outside the school premises,
acknowledging the additional challenges and issues that arise from learning through digital
technology, sometimes at a distance. This leads us to recognise that a key factor will be to
identify the fit of the digital technology for the purposes, often multiple purposes, of primary and
secondary schooling.

To illustrate the complexity of schooling infrastructures and emerging trends, a range of
vignettes (see Appendix 6.2) are used before making recommendations about new indicators.

1.2 Defining ICT

The term ICT is used differently across different contexts, often leading to confusion and
miscommunication. For example, it has been used to refer to a specialist subject (learning about
digital technology); to the use of digital technology across the curriculum (learning supported by
digital technology); and to refer to hardware, software and associated digital technology
infrastructure. Care should also be taken to distinguish it from learning in different locations
communicated via digital technologies including telecommunications.

In order to avoid confusion, this paper will use the following terms, which we acknowledge are
not the same as those previously adopted by UIS:

       Digital technology - the technology infrastructure, including hardware and software.

       ICT - the cross curricula use of digital technology to enhance learning.

                                                -5-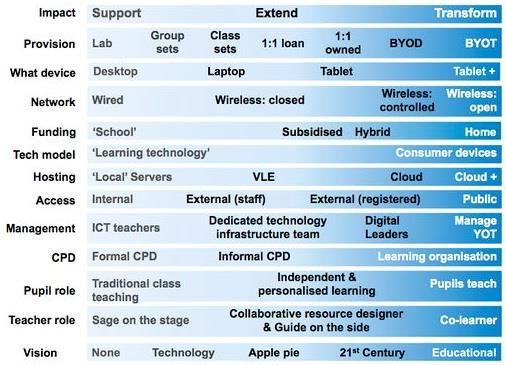
Computing - an umbrella term to refer to subjects that are focused on teaching about
digital technology and its use, including: Computer Science, Information Technology,
and Digital Literacy.
Computer Science - is a scientific discipline, covering principles such as
algorithms, data structures, computational thinking, programming, systems
architecture, design, problem solving etc.
Digital literacy – is the ability to operate effectively as a citizen in the 21st
century. It covers the following areas:
Understanding the impact of new technologies on society, including the ways
in which new technologies change disciplines (e.g. history, chemistry,
English, etc.)
Understanding the nature of digital identities and being able to manage your
digital identities appropriately
Being able to interact safely in a digital world (encompassing e-safety, cyber-
bullying, data security, etc.)
Being able to locate, organize, understand, evaluate, analyze and (re)present
information and communicate using digital technology (including using
dynamic and procedural representations – this can be viewed as 'the creative'
making and doing aspects of using digital technology although many other
aspects of the subject can also be creative).
Information Technology (IT) - the assembly, deployment, and configuration of
digital systems to meet user needs for particular purposes. (Note that this is
narrower than the use in industry, which generally encompasses Computer
Science as well).
1.3 Some emerging trends
Both digital technology and educational systems are evolving rapidly and those changes
stimulate further evolution and co-evolution with worldwide impacts (Davis, Eickelmann & Zaka
2013). Essentially it is collective actions globally that result in the societies of today. UNESCO’s
recent review of digital technology in schools across the Asian region describes a wide diversity
of rapidly evolving educational ecosystems, many increasing the adoption of digital technology
and some dropping back as they prioritise other aspects, including the employment of teachers
(UIS, 2014a). In the interests of equity, which is an important part of post WSIS contexts, these
diversities are best perceived in relation to the larger systemic contexts locally and globally. As
Paul Gorski recommends, this paper presents indicators to assist in measurement of
digital inequities, not as individual phenomena, but as symptoms of larger systemic
inequities. And we must challenge strategies for “closing” or “bridging” the digital divide
that fail to consider digital inequities in this broader context.
(Gorski, 2009; p. 360)
Therefore the paper adopts Davis’ (2008) arena of change with digital technologies in education
to clarify the interaction between global and local educational ecologies on four main axes:
political, bureaucratic, professional, and commercial (including FOSS and OER). Figure 1.3.A
presents a recent version of the arena at the centre of which is a distant teacher viewed through
digital technology by students located in different schools and/or homes. This virtual classroom
is nested within larger ecologies of the school, the region, the nation as well as a global
-6-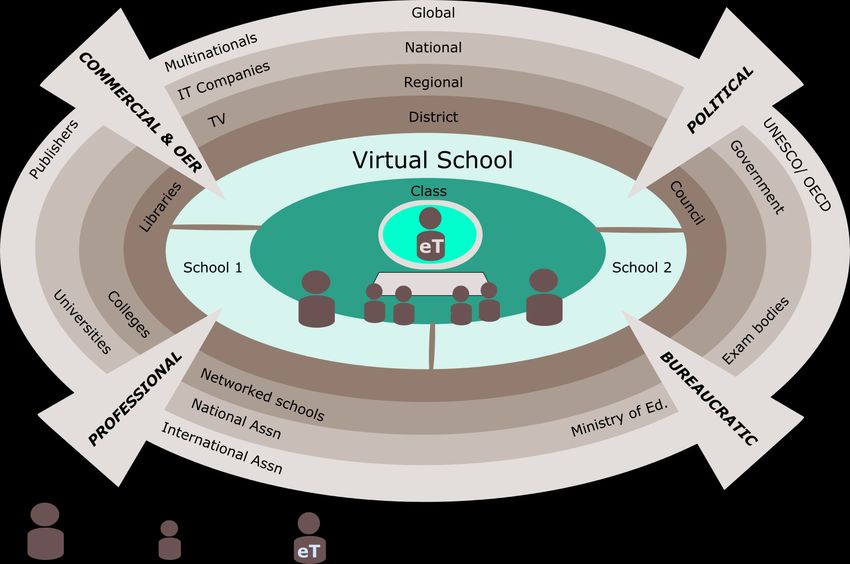
perspective. Figure 1.3.A clarifies the need for indicators to move beyond the school level and
to recognise the interfacing of digital technology and practices across participating
organisations, including access to secure Virtual Learning Environments for educators who are
not employed by a school (Davis 2014).

Figure 1.3.A Davis’ global arena of change with ICT in schooling showing a distant
teacher working with students in at least two schools, as well as the ecosystems within
which a teacher enabled by ICT is nested at the centre (developed from Davis,
Eickelmann & Zaka 2013 p. 442)

The first major trend recognises the increasing importance of digital technology infrastructure
that is not on the school premises, including the growth of state and nationwide provision of
virtual learning environments. Korea’s award-winning ‘Cyber home school’ (UNESCO education
award 2009) has been followed by others, such as Malaysia’s VLE 1BestariNet (e.g. Vignette 4)
that has a multi-lingual portal that aims to provide “an integrated platform for administrative,
collaboration, teaching and learning activities which can be accessed by teachers, students and
parents”. Teachers can access a Google dashboard to administer homework and other activities
through the portal. Policies are set up to ensure compatible practices, such as adjustment to
school firewalls to enable access to shared services that are not on the premises. Similarly
cyber-safety and the healthy growth of digital citizens in schools and society have become a
pressing issue (e.g. UNESCO Bangkok 2014) that is increasingly addressed with online
services at national and global levels.

                                              -7-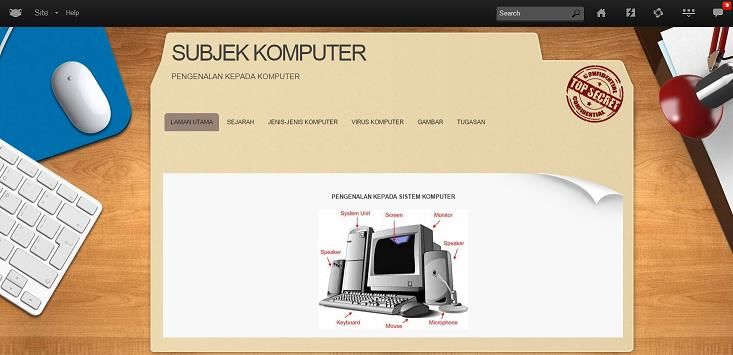
Regional services that make use of a limited digital technology infrastructure across a number of
countries have also emerged to fit particular needs, for example, the Exam Preparation
Outreach Project (EPOP) that provides an online portal for promising students, often in remote
regions, who would like to attend university following their identification through Southeast Asian
community organizations. Improving English language tuition may also take advantage of off-
line digital technology such as the use of mobile phones as audio-visual tools in schools in
Bangladesh (Vignette 1) and radio (Vignette 9).

Virtual school campuses have rarely been included in national metrics, with the exception of
North America, and a number of Ministries and other agencies were unaware of the growth of
digital technology-enabled distance education (Bacsich, Pepler, Phillips, Öström & Reynolds
2011; Davis 2012). The annual reviews of the growth of virtual schooling in North America have
led to questions on funding and policy, including a U.S. federal report that attempted to classify
virtual schools to inform national policy (National Forum on Education Statistics 2006). In
contrast, Australasia has not seen the same rapid expansion with the evolution of nationwide
correspondence schools slowly incorporating digital technology to fit their ecologies (e.g.
Vignette 3). In the Pacific, as in other regions, a virtual school campus only becomes an option
when the digital technology infrastructure improves; that occurred in 2014 in the Cook Islands
with emergence of the Cooks Online School - Te Kura Uira to serve students in rural and
remote schools on those Pacific islands.

Recent advances in solar power generation and deployment in schools and communities are
improving access to more reliable power sources; it is hoped that the trend of increasingly
affordable and reliable power sources for education will continue worldwide. However, caution is
necessary, as digital technology infrastructure will compete for power with more essential
infrastructure, such as toilets and basic lighting.

Digital technology resources are increasingly provided by public and community libraries and
community centres to improve access in ways that support both children and adults, and their
learning together. The digital technology infrastructure for displaced people such as refugees is
also likely to be outside schools and linked to those who volunteer their aid (see Vignette 5). A
move towards ‘bring your own’ (BYO), particularly iPads, Android tablets and mobile phones
was identified as an emerging trend in the World Bank’s 10 trends blog in 2012 (Trucano,
Iglesias & Hawkins 2012). Such facilities may also travel to communities and schools in vans
(e.g. Vignette 2) and on motorbikes.

       For example, Bangladesh – with support from the non- governmental development
       organization, BRAC – introduced 17 mobile ICT laboratories containing laptop
       computers, cameras, multimedia projectors, etc. to cover 1,000 schools in remote areas
       (World Bank 2010). In contrast, Sri Lanka – through its Nensala Project – established
       over 700 rural tele-centres or “Nensalas”, which are managed and supervised by the
       Nensala Community Development Task Force to build ICT skills and impart ICT
       education in school curricula (Nensala 2013; World Bank 2010).
                                                                           (UIS 2014a, p. 25)

Innovations to increase access to digital technology at home for educational purposes for those
who cannot afford it are also common in fully developed countries (e.g. Vignette 3), including
essential skills and safety training for parents and care givers. It is also important to note the
increasing importance of digital technology infrastructure in teachers’ homes as well as those
who volunteer as educators, who often bring their own devices to support learning in schools
and other contexts (e.g. Vignette 5). In developed countries the ratio of devices to students is

                                               -8-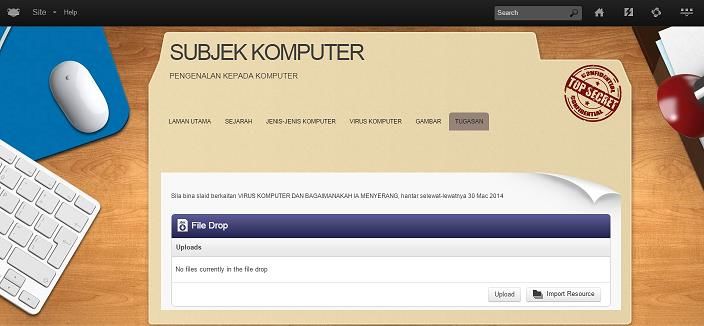
likely to increase above 1 to 1, with access to some school computers boosted by mobile
phones and tablets such as the iPad. The digital technology expectations of schools also
stimulate home ownership of devices and Internet access for both children and parents.

Hardware trends include an increasing range of digital devices with decreases in size, including
tablets and wearable computers (e.g. in glasses). Tiny cheap computers such as the innovative
Raspberry Pi have found a niche to improve the teaching of Computing, and can enable
enthusiasts to recycle other parts including screens and keyboards. There are indications that
the One laptop per Child (OLPC) movement will not continue, which would confirm that
specialised educational hardware and related ICT infrastructure cannot be sustained by the
education market alone. Improvement in the management of computer related waste is an
increasing need and trend.

The 2014 K-12 Horizon reports for schools in Europe, the USA/world and international schools
in Asia provide useful information on trends (Johnson, Adams Becker, Estrada, & Freeman
2014; Johnson, Adams Becker, Estrada, Freeman, Kampylis, Vuorikari, & Punie 2014; Johnson,
Adams Becker, Estrada, & Freeman 2014; Johnson, Adams Becker, Cummins & Estrada 2014).
Most noticeable are the trends increasing (a) adoption of Cloud computing and tablets, (b)
mobile learning, and (c) personalized learning and access to remote facilities such as
laboratories, with adoption for European schools predicted for 1, 2 and 5 years respectively.

Another trend relates to the increasing availability of digital content useful in education. Such
content comes in many sizes and increasingly includes whole ‘courses’ that can be ported
across learning management systems. The open courseware trend continues, sustained by
educational outreach complemented with marketing (e.g. Massachusetts Institute of Technology
(MIT) open courseware initiative in the USA). Access to such courses includes universities and
consortia offering massive open online courses (MOOCs), which can complement secondary
education and teacher training. A related trend is increasing use of OERs, which support
customisation of courseware and other content. However, increasing access within diverse
ecologies is likely to remain challenging for a number of reasons as noted in 2012 by the World
Bank,

       Sometimes part of open educational resources (OER) activities and/or taking advantage
       of various Creative Commons licenses, it is true that many such translation efforts are to
       transform educational content created in industrialized countries for use in developing
       countries, and that comparatively little efforts have been made to translate education
       materials created in the global 'South' for use in other developing countries (or indeed by
       countries anywhere). It is also true that translating and contextualizing content to meet
       local circumstances and needs are not the same thing. That said, what was once largely
       the domain of enthusiasts utilizing new digital tools to make available their own
       translations of (for example) Japanese comics and animation for wider audiences is
       becoming an activity that, while perhaps not mainstream, is of increasing relevance to
       learners in many countries.
       (Trucano, Iglesias & Hawkins, 2012)

There are strategies that can enable better uptake, such as the successful Teacher Education in
Sub Saharan Africa (TESSA) project that continues to involve many educators in Sub Saharan
Africa to develop OERs and place them in a repository. Vignette 7 describes the embedding of
TESSA OERs within initial teacher education in Nigeria to enable improvements in mentoring of
beginning teachers. The increasing understanding of the complexity of OERs is likely to
increase quality uptake over time. For example, Atenas and Havemann (2014) describe the key

                                              -9-
principles of repositories of OERs that underlie open access for higher education and the 2012
Paris OER Declaration (UNESCO, 2012). They describe 10 indicators of quality repositories,
while also recognising that the application of all ten is likely to be unrealistic and so choice will
depend on the context, which is to say the choice will depend on the ecologies within with any
repository is sited. The ten indicators are:

       featured resources; user evaluation tools; peer review; authorship of the resources;
       keywords of the resources; use of standardised metadata; multilingualism of the
       repositories; inclusion of social media tools; specification of the creative commons
       license; availability of the source code or original files.
        (Atenas & Havemann 2014 p. 9 Table 1 describes the metrics)

There are complex interactions between trends in digital technology infrastructure and the
contexts where school-age children learn that are influenced by gender (Subrahamanian 2007)
and culture, which complicate metrics and are likely to reduce the validity of the evidence
gathered. For example, the very different behaviours in Western and Arabic classrooms
described by Gamiel and Hazan (2014) suggest that it will be more challenging to interpret that
data and to increase capability for self-managed and community support within classes and
schools. Unlike the Jewish children who appeared to be empowered by their culture and the
training provided in their school that enabled them to give patient respectful support to their
elders (teachers) who had very few ICT skills, the Arab children supporting their elders within
the different culture of their Madrassa schools culture were observed to have few constructive
experiences “relative to the dominant experiences of disorientation and boredom” (Gamiel &
Hazan 2014 p. 902). They concluded:
    As research illuminates different patterns of interaction of children with the digital world
    and the influence of cultural codes on the widening of the gap between high-achieving and
    low-achieving pupils in the Arab sector (Abu-Asba, 2007), one cannot rule out the
    formation and expansion of a digital divide occasioned, for example, by the tendency
    among disempowered children to adopt a passive pattern as opposed to an active one
    (Selwyn, 2009).
(Gamiel & Hazan 2014 p. 903)

From another perspective, digital technology infrastructure to provide access to education may
be more critical to women and children whose travel is restricted by cultural norms that must
also include aspects of security that would not be expected or designed in by other cultures.
This increasing complexity of the interactions between the digital technology infrastructure,
curriculum, professional development and cultural dimensions is important to consider for
reasons of equity advocated by Gorski (2009) as well as for post WSIS goals.

                                               - 10 -
2. Methodology
Digital technology has been in use in schools for over thirty years, and significant sums of
money have been invested in digital technology and its implementation during that time.
Understandably therefore, governments, commercial organisations, and others interested in
education have developed a range of metrics to describe the digital technology provision in
schools in order to try to capture the range of digital technology strategies and their impacts.
This research builds upon those existing metrics and on examples of diverse practice across a
wide range of contexts. Specifically this research involved four stages, plus an on-going review
of relevant literature:
● The compilation of a series of vignettes and other sources of information that illustrate a
wide range of contrasting digital technology strategies and practices and emerging
trends in educational contexts for school age learners.
● A review of existing metrics related to digital technology and related infrastructure in
schools, leading to a set of dimensions of practice, which aim to encapsulate their key
features as abstractions, which should remain relevant irrespective of changes to
specific technologies.
● Testing and refinement of the dimensions of practice against the vignettes and other
sources of information to ensure they adequately describe and differentiate between the
wide ranging digital technology and related infrastructure provisions and emerging trends
across contexts.
● Review of the dimensions of practice by international experts on the UNESCO ICT in
education technical advisory panel (TAP).
2.1 Vignettes
The vignettes (see Section 6.4) were selected to provide and illustrate a wide range of digital
technology strategies and issues that relate to ICT infrastructure. They were drawn from a wide
range of contexts and developed by authors who had experience of those contexts in most
cases. Table 2.1.A provides an overview of the vignettes. The vignettes were not selected to
illustrate the lead authors’ views. Rather, our intention was to challenge current metrics while
also promoting equity by including voices with experience of developing countries to assist the
validity of our interpretation. All of the vignettes illustrate aspects relating to infrastructure, some
also illustrate aspects of curriculum and professional development covered by the
complementary papers (Gibson et al. In Preparation; Du Toit In Preparation).
This has resulted in diversity with a number of useful aspects:
● different regions including Asia, Africa, India, the Middle East and the Pacific;
● provision for learners and their teachers across the primary and secondary age ranges;
● urban and rural; community, work and home settings;
● state funded, public-private partnerships including aid contexts, and private education;
● school based and out of school provision;
● physical, virtual and blended settings and services;
● local, regional, national and global levels of provision.
- 11 -Table 2.1.A Vignettes produced for UNESCO Institute for Statistics (UIS) with an indication of the
relevance of the project for the themes of all three papers commissioned. (Note: Capitalised
‘YES’ indicates that the vignette describes the aspect directly)
Teacher
Title Lead Author Infrastructure Curriculum
Education
1 Bangladesh: English in Action Clare Woodward YES Yes Yes
authentic video on mobile phones
2 India: Integrated ICT school Amina Charania YES YES YES
supplements in community
centres
3 New Zealand’s development of Niki Davis YES No Yes
Ultrafast broadband in schools
including the largest nationwide
correspondence school
4 Malaysia’s nation-wide VLE for Hasniza Nordin & YES No Yes
schools Niki Davis
5 Jordan with Syrian refugees: Aleta Chowfin & YES Yes Yes
Saturday programme for out of Niki Davis
school refugee children 30
minutes from the border and war
zone
6 Bangladesh: Multimedia Clare Woodward YES YES YES
classrooms creating OER
7 Nigeria: Extending OER amongst Fiona Henry YES No YES
trainee teachers using tablet
technology
8 Africa: Solar-powered mobile Fiona Henry YES No No
school classrooms in Africa
9 India and Africa: Community and Amina Charania YES No Yes
interactive radio in schools and
other places
2.2 Existing indicators
The review of existing metrics drew on the following sources complemented by our ongoing literature
review:
● Barbour, M. K., Brown, R., Waters, L. H., Hoey, R., Hunt, J. L., Kennedy, K., Ounsworth, C.,
Powell, A. & Trimm, T. (2011). Online and blended learning: a survey of policy and practice of K-
12 schools around the world. Vienna (VA), USA: International Association for K-12 Online
Learning. Retrieved from http://files.eric.ed.gov/fulltext/ED537334.pdf
● Becta (2006). The Becta Review 2006: Evidence on the progress of ICT in education. Coventry:
Becta.
● BESA. (2012). ICT in UK state schools: Provision and spending. Full Report Volume 2. London:
BESA.
● European Schoolnet. (2013). Survey of schools: ICT in Education: benchmarking access, use
and attitudes to technology in Europe’s schools (p. 163). Belgium: European Commission.
Retrieved from https://ec.europa.eu/digital-agenda/node/51275
● Haddad, W. D. (2007a). ICTs for Education: A reference handbook Part 1 Decision makers
essentials. Virginia, USA: Knowledge Enterprise, LLC. Retrieved from
http://www.ictinedtoolkit.org/usere/p_page.php?section_number=0 (accessed 15-Nov-2014)
- 12 -● Kozma, R. (2011). A framework for ICT policies to transform education. In UNESCO
Transforming education: the power of ICT policies. (19-36) Paris: UNESCO. Retrieved from
http://unesdoc.unesco.org/images/0021/002118/211842e.pdf
● MMS Education. (2014). 2014 Results from the SIIA Vision K-20 Survey. Washington, DC:
Software & Information Industry Association. Retrieved from
http://www.siia.net/visionk20/2014_VK20.pdf
● Mullis, I., Martin, M., Foy, P., & Arora, A. (2012). TIMSS 2011 International results in
mathematics. Massachusetts: International Association for the Evaluation of Educational
Achievement. Retrieved from http://timssandpirls.bc.edu/timss2011/international-results-
mathematics.html
● Mullis, I., Martin, M., Foy, P., & Drucker, K. (2012). PIRLS 2011 International Results in Reading.
Massachusetts: International Association for the Evaluation of Educational Achievement.
Retrieved from http://timssandpirls.bc.edu/pirls2011/international-results-pirls.html
● OECD. (2011). PISA 2009 Results: Students On Line. Paris: Organisation for Economic Co-
operation and Development. Retrieved from http://www.oecd-
ilibrary.org/content/book/9789264112995-en (accessed 15-Nov-2014)
● Roberts, S. (2010). Partnership on measuring ICT for development: Core ICT indicators 2010.
Geneva: International Telecommunication Union
● Sankey, M., Carter, H., Marshall, S., Obexer, R., Russell, C., & Lawson, R. (2014). Benchmarks
for Technology Enhanced Learning. Cambera. Australia: The Australian Council on Open,
Distance and e-learning
● Twining, P. (2014a) Redefining Education: 1:1 computing strategies in English schools. In
Sweeney, T. & Urban, S. (Eds) Now IT's Personal: Proceedings of the Australian Computers in
Education Conference 2014. pp. 377-386 ACEC: Adelaide, Australia. Retrieved from
http://acec2014.acce.edu.au/program-glance
● Twining, P. (2014b). Digital technology trends. Retrieved from
http://edfutures.net/Digital_technology_trends
● UNESCO Institute for Statistics (UIS) (2009). Guide to measuring information and
communication technologies (ICT) in education. Montréal, Québec, Canada: UNESCO. Retrieved
from http://www.uis.unesco.org/Library/Documents/ICT_Guide_EN_v19_reprintwc.pdf
● UNESCO Institute for Statistics (UIS) (2014a). ICT in education in Asia. Retrieved from
http://www.uis.unesco.org/Communication/Documents/ICT-asia-en.pdf
● UNESCO Institute for Statistics (UIS) (2014b, September). Questionnaire on statistics of ICT in
Education. Montréal, Québec, Canada: UNESCO. Retrieved from
http://www.uis.unesco.org/UISQuestionnaires/Documents/UIS_E_ICT_2014.pdf
● US Department of Education, National Centre for Education Statistics (2012a). Schools and
staffing survey 2011-2012 School Year. Jeffersonville, Indiana: US Census Bureau. Retrieved
from http://nces.ed.gov/surveys/sass/question1112.asp
2.3 Analysis to develop new indicators
The analysis was based on a model originally used on research into Tablet PCs in English schools
(Twining et al. 2005) and subsequently on the 22 English Vital Studies (Twining 2014a) and 13
Australian Snapshot Studies (e.g. Clark, Twining & Chambers 2014; Fluck & Twining 2014; Jamieson-
Proctor, Redmond, Zagami, Albion & Twining 2014; Newhouse, Lane, Cooper & Twining 2014). The
approach involved meta-analysis across the case studies of digital technology strategies in schools,
informed by the literature.
An adapted version of Wong and Blanford’s (2002) Emergent Themes Analysis was used in order to
identify consistent patterns across the data from the studies and practices reported in the literature.
Themes emerged as dimensions, which encapsulated key features of the digital technology
implementations in the form of abstractions that described and enabled comparison across contexts.
- 13 -The starting point was an analysis of the existing metrics within the literature, including the dimensions of
practice that had been developed by the Vital Studies and extended by the Snapshot Studies (see
Figure 2.3.A).
Figure 2.3.A Dimensions of practice from the Vital and Snapshot Studies (EdFutures.net 2014)
The analysis was then extended by testing the power of the emerging dimensions against the vignettes
of practice that had been selected (see Appendix 6.2).
- 14 -3 Data analysis - new indicators
Analysis of the existing indicators quickly highlighted a number of overarching aspects that they focused
on. These have been used as major headings within this section. Sub-dimensions are then identified
within each of these overarching themes.
3.1 Visions, strategies, curricula and teacher education
Educational vision
Whilst a government’s (or school’s) educational vision would normally be viewed as part of the
pedagogical approach rather than an infrastructure issue, it is critical in that the vision frames the context
for the development of the digital technology infrastructure. Specifically, there needs to be a clear
educational vision, with associated digital technology strategies and policies. As Haddad (2007a p. 11)
points out:
Technology is only a tool: no technology can fix a bad educational philosophy or compensate for
bad practice. Therefore, educational choices have to be made first in terms of objectives,
methodologies, and roles of teachers and students before decisions can be made about the
appropriate ICT interventions.
Barbour et al. (2011) indicate that one of the five main challenges inhibiting the effective use of digital
technology (specifically in their case online and blended learning) was a lack of governmental vision and
leadership. Innovative and transformative approaches to education most often involve public and private
funding to provide the initial infrastructure that is informed by a particular vision and related mission,
including government funded initiatives (see for example Barbour 2014).
Kozma (2011 p. 27) identifies that “Educational policy-makers are in a unique position to bring about
change”. This reflects that policy makers set the overall vision and strategy for education. They are
therefore critical to the effective implementation of ICT, which is perhaps why Sankey et al. (2014)
provide eight benchmarks in higher education, all of which are targeted at those responsible for
providing strategic leadership in technology enhanced learning.
Twining (2014b) developed a Vision dimension, the categories of which are summarised in Table 3.1.A.
This dimension highlights the need for there to be a link between the educational vision and the digital
technology strategy.
Table 3.1.A The categories on the Vision dimension (Twining 2014b)
Category Explanation
None There was no educational vision (or the head/principal couldn't articulate an
educational vision) or there was a mismatch between the educational vision
and the digital technology strategy.
Technology The vision was clearly technology driven, e.g. To have a set of computers in
every classroom; For every student to have their own mobile device.
Apple pie The vision was aspirational but so vague as to be unhelpful in knowing what
the school strategies should be. e.g. Every child will reach their full potential.
21st The vision was about preparing students to be 21st Century citizens and/or
Century developing 21st Century skills.
Educational A clearly educational vision, that was sufficiently specific to provide some
guidance about appropriate educational strategies.
- 15 -Strategies
The key sources of indicators of ICT tend to focus at the level of digital technology strategy rather than
vision. Such strategies are (or should be) encapsulated in policies (or other regulatory mechanisms). For
example, the UIS questionnaire on ICT asks “Does your country have a national policy, plan, law or
regulatory mechanism to promote and/or implement the integration of ICT in education?” (UIS, 2014b,
p. B1).
The UIS (2014a, p. 9), building on Kozma’s earlier work, identified that
Policymakers are in a unique position to bring about change. This is illustrated in a study of 174
ICT-supported innovative classrooms in 28 countries (Kozma 2003). In 127 cases, there was an
explicit connection between the innovation and national policies that promoted the use of ICT
(Jones 2003). But while the introduction of ICT policy is necessary for change, it is not sufficient
to result in its implementation or impact (Tyack and Cuban, 1995).
The European Schoolnet (2013) seems to endorse this view. They found that the existence of policies
for ICT led to higher levels of use of digital technology across the curriculum so long as there were
measures in place to support those policies. They implied that policies varied in terms of their degree of:
scope (holistic); formalisation (written statements); precision; and focus (digital technology use in
general, in teaching and learning, and/or in subjects). However, existence of a written policy may be less
important than whether or not a policy (written or otherwise) is being enacted in practice. Thus, for
example, while the Philippines has no written ICT policy, it does have three de facto policies operating in
practice (Trucano 2014). Table 3.1.B suggests definitions of different categories on a new Policy
dimension.
Table 3.1.B Categories on the new policy dimension
Category Explanation
None There is no digital technology policy or there is a policy that is not being
implemented in practice.
General A digital technology policy is being implemented, but it is not clearly linked to
and supportive of the educational vision or teaching and learning, or the
curriculum (including Computing)
Computing A digital technology policy focused on Computing is being implemented,
focus which is not clearly linked to and supportive of the school’s educational vision
or teaching and learning in other subjects (across the curriculum)
ICT focus A digital technology policy is being implemented, which is focused on
supporting the school’s educational vision and explicitly links with teaching
and learning, and the curriculum (going beyond Computing)
A good indicator of whether or not a policy is being implemented might be the extent to which the policy
is explicitly tied in to the accountability frameworks and processes in operation, such as a school
inspection framework, or teacher certification and/or promotion criteria.
The literature and expert input from the UNESCO ICT in education TAP suggests that a range of
different policies might be necessary, including policies related to:
Funding, sustainability, maintenance of systems and technical support (e.g. Becta 2006; Haddad
2007a)
Acceptable use, often focused on use of the Internet and social networking (e.g. European
Schoolnet 2013; US DoE NCES 2012c)
Equality and/or equity (e.g. UIS 2014b)
Disaster recovery (e.g. war, tsunami)
- 16 -There are two other aspects of policy that seem particularly important, namely: Curricula, and Teacher
Education.
Curricula
It seems reasonable to assume that the existence of a National Curriculum (or similar for a region, such
as a state within a nation) that makes explicit reference to digital technology will impact on its uptake in
schools. As noted in Section 1.2 of this report, one needs to differentiate between Computing (the
specialist subject) and explicit reference to the use of digital technology as part of or to support learning
in other subjects (defined as ICT in this paper). This is reflected, for example, in the proposed Australian
national curriculum (ACARA 2014), which had both an explicit subject (called Digital Technologies) and
a cross curricula strand (called ICT capability). Similarly, the UIS (2014a, p. 12) differentiates between:
instruction in basic computer skills (or computing) and the use of digital technology “to teach other
subjects to enhance or expand student learning opportunities.” National curriculum requirements in
relation to Computing and/or ICT may vary in terms of the level or grade of education at which they apply
and number of hours per week specified. This is reflected in specific questions in the latest UIS ICT
questionnaire (UIS 2014b):
B.3 Does the education curriculum include a course on basic computer skills or computing?
B.4 Please indicate for which subjects and grades (all or some), recommendations exist to use
ICTs to support teaching and/ or learning: Mathematics/Natural Sciences/Social
Sciences/Reading, writing and literature/Foreign Languages
This aspect is more central to UNESCO paper 2, so will be left to that paper (Gibson et al., in
preparation)
Teacher education and educational leadership development
There is strong evidence to suggest that the quality of teaching is a key factor in the learning outcomes
that children achieve. The value of early and ongoing placement of student teachers in schools is well
known in teacher education research. Whilst the issue of teacher education is the focus on another
paper (Du Toit, In Preparation), teacher standards and requirements for Initial Teacher Education and
the certification of qualified teachers is also an infrastructure issue. In addition, where services are
developed for schools, such as an online portal where access is managed by individual schools to
protect their children, then access for others involved in the educational system such as students in
teacher education becomes an ICT infrastructure issue (Davis 2014).
Barbour (2014) notes that there is a need to focus on teacher training. The UIS (2014a, p. 7), building on
UIS (2009), asks about the proportions of teachers with Computing qualifications (which the UIS refers
to as ‘ICT-qualified teachers’) in schools and the proportions of teachers who have been trained in ICT
(which UIS refers to as being able to teach using ICT). Similarly, UIS (2014b) also asks about the
numbers of staff teaching digital technology related subjects as well as the numbers of teachers using
various digital technologies to support teaching of other classroom subjects.
Finally, the development of school leadership to enable best use of the ICT infrastructure and its ongoing
upkeep is a common issue in both developed (Schrum & Levin 2012) and developing countries
(Trucano, Iglesias & Hawkins 2012).
This aspect is more central to UNESCO paper 3, so will be left to that paper (Du Toit In Preparation).
- 17 -3.2 Environment
It is evident from the vignettes and the literature that the environments in which school age children are
being educated are changing. The nine vignettes illustrate a range including multimedia centres or
media labs in schools, community centres (some of which are mobile) and virtual learning environments
that are accessed through the Cloud by the child’s own mobile device.
Haddad (2007a) suggests that education in the future will need to change dramatically and quickly, and
that there is a need to equip students to continue to learn “anytime, anywhere, on demand” (p. 4).
Reflecting this view, Rix and Twining (2007) developed a typology of education systems, which aimed to
recognise these changes and to “map the different forms of provision into a typology that will provide
theorists, practitioners, users and policy-makers with a clear set of descriptors to explore current
structures and to consider future developments” (Rix & Twining 2007 p. 329). This typology, which is
summarized in Table 3.2.A, provides a set of high-level descriptors to enable one to differentiate
between different forms of education provision. Twining et al. (2006), who were explicitly focused on the
impact of digital technology on schools, extended this analysis, in the form of the eSIR Reference
Statement (see Table 3.2.B).
Table 3.2.A Typologies of education systems (adapted from Rix & Twining 2007, p. 337)
Dominant Degree Opportuniti
education of es to
Programme Program al learner access Age Regulatio Locatio
title me length approach control setting range n n
Long or Up to Fixed
Type 1 Alternative
short term
Creative High Limited
18
Systemic
sites
Up to Fixed
Type 2 Last chance Short term Discipline Low Limited
18
Systemic
sites
Fixed
Type 3 Remedial Short term Therapy Low Limited Lifelong Systemic
sites
Up to Fixed
Type 4 Special Long term Therapy Low Limited
18
Systemic
sites
Long or Up to Diverse
Type 5 Home
short term
Creative High Limited
18
Informal
sites
Long or Up to Fixed
Type 6 Selective Traditional Low Limited Systemic
short term 18 sites
Comprehensi Up to Fixed
Type 7 ve
Long term Traditional Low Open
18
Systemic
sites
Schome (not
Long or Diverse
Type 8 school or
short term
Creative High Open Lifelong Systemic
sites
home)
Long or Fixed
Type 9 Adult
short term
Traditional High Limited Post 18 Systemic
sites
- 18 -Table 3.2.B Summary of the eSIR Reference Statement (First published under CC lisence in
Twining et al. 2006, p. 14)
Aims ‘Smarter learners better able to cope with changing contexts’ – focus on
enhancing learning, motivation and lifelong learning as important elements of
this.
Environment The learning environment is the whole environment of the learner that is
recognised as being relevant to the education system. It has two components:
1. The spatial environment – where learning takes place.
2. The temporal environment – when learning takes place.
Both the spatial and temporal environments that are considered relevant to the
education system will expand. In particular there will be greater emphasis placed
on the home, working across physical settings and virtual settings, and
extending ‘the school day’. This is all summed up in the phrase
‘anywhere/anytime learning’.
Actors The ‘actors’ are people and/or organisations involved in supporting learning,
including teachers, support staff, learners, learners’ peers, parents and
employers. There will be an increase in the involvement and availability of actors
owing to the facilities that ICT offers, especially in relation to interaction ‘at a
distance’. In particular, greater emphasis will be placed on the role of parents.
Collaboration will be a key element to this diversification of actors and
environments.
Learner choice, responsibility and control will become increasingly important as
part of the ‘personalisation’ agenda.
Curriculum The curriculum includes everything that learners learn. There will be a
broadening of the curriculum both in the ‘subjects’ available and in learner
choice. In particular, the curriculum is likely to offer more vocationally orientated
options and will place a greater emphasis on ‘core skills’.
Support The range and nature of support, which includes teaching, will increase and
diversify as the environments, actors and curriculum expand. In particular, there
will be an increase in learner choice about when, where and how learners are
supported.
Two aspects of the environment, that are particularly evident in the vignettes, relate to the degree of
flexibility in when and where students learn, as illustrated in Table 3.2.C.
Table 3.2.C The spatial and temporal environments (based on Twining et al. 2006, p. 14 and Rix &
Twining 2007, p. 337)
Spatial environment Temporal environment
Fixed Learners attend a fixed location for their Schooling happens at pre-determined
schooling, which may be a physical or times (e.g. from 7am to 2pm on
virtual location Monday to Friday)
Diverse Learners attend a range of different Schooling happens at a variable times
locations, which may be physical and/or (Anytime)
virtual (Anywhere)
- 19 -Another aspect is the nature of the organisations providing the education, which is shifting from being
schools (which provide a physical location and all of the services) through to online providers who are
seen more as a service rather than an organisation or institution, and combinations of these. Indeed
there is a blurring of boundaries, as physical schools buy in specific online services from other providers,
and in turn offer their services to others. This is reflected in UIS’s (2009) guidelines, which ask about the
proportion of educational institutions offering ICT-enabled distance education programmes (ED33). The
new Provider dimension was developed to address these trends.
Table 3.2.D Categories on the new provider dimension
Category Explanation
None There is no education provision
Community Provides limited face to face teaching services
e.g. after school computer club or community centre
Traditional Provides a physical location that students attend and all teaching services
e.g. a traditional school
Extended Provides a physical location that students attend and some teaching
services. Buys in some distance teaching (may also sell online teaching
services to other providers)
e.g. a school that buys in online teaching for specific subjects (because they
lack the in-house expertise)
Virtual Does not provide a physical location for students to attend. Provides online
teaching services.
e.g. a virtual school, which students may attend part-time or full-time
The Nensala Project in Sri Lanka is an example of a Community provider: the project has established
over 700 rural tele-centres or “Nensalas”, which are managed and supervised by the Nensala
Community Development Task Force to build ICT skills and impart ICT education in school curricula
(UIS, 2014a).
3.3 Electricity supply
Whilst most sets of metrics related to digital technology in schools assume that electricity is available,
UNESCO Institute for Statistics (2009, 2014a) and Roberts (2010) highlight that this may not be the case
and use an associated metric:
● The proportion of schools with electricity (EDR1)
The reliability of electricity supply also has an impact on the usability of ICT for educational purposes.
For example, in some locations schools or other centres have an electricity supply for part of the day or
an ongoing supply that is frequently interrupted and experience surges of power as well as lack of
power. Recent trends to increase solar power generation in the Pacific region indicate some success for
the schools and their communities. Thus a metric describing the limitations of access and quality of the
power source becomes relevant.
The UIS (2014a, p. 14) states that:
The integration of ICT into schools requires electricity (e.g. grid/mains connection, wind, water,
solar or fuel-powered generator, etc.) that is regularly and readily available.
- 20 -You can also read