Documenting Elimination of Co-Circulating Covid-19 Clusters Using Genomics in New South Wales, Australia
←
→
Page content transcription
If your browser does not render page correctly, please read the page content below
Documenting Elimination of Co-Circulating Covid-19
Clusters Using Genomics in New South Wales,
Australia
Alicia Arnott ( alicia.arnott@health.nsw.gov.au )
NSW Health Pathology https://orcid.org/0000-0003-2637-8936
Jenny Draper
NSW Health Pathology: New South Wales Health Pathology
Rebecca J Rockett
Centre for Infectious Diseases and Microbiology - Public Health, Westmead Hospital
Connie Lam
Centre for Infectious Diseases and Microbiology - Public Health, Westmead Hospital
Rosemarie Sadsad
University of Sydney, Sydney Informatics Hub
Mailie Gall
NSW Health Pathology: New South Wales Health Pathology
Elena Martinez
NSW Health Pathology: New South Wales Health Pathology
Roy Byun
NSW Health: New South Wales Ministry of Health
Jennie Musto
NSW Health: New South Wales Ministry of Health
Ben Marais
Marie Bashir Institute for Infectious Diseases and Biosecurity
Sharon C-A Chen
NSW Health Pathology: New South Wales Health Pathology
Jen Kok
NSW Health Pathology: New South Wales Health Pathology
Dominic E Dwyer
NSW Health Pathology: New South Wales Health Pathology
Vitali Sintchenko
NSW Health Pathology: New South Wales Health Pathology
Research note
Page 1/9Keywords: SARS-CoV-2, genomic epidemiology, bioinformatics, whole genome sequencing, Australia
DOI: https://doi.org/10.21203/rs.3.rs-645999/v1
License: This work is licensed under a Creative Commons Attribution 4.0 International License.
Read Full License
Page 2/9Abstract
Objective: To adapt ‘fishplots’ to describe SARS-CoV-2 genomic cluster evolution.
Results: This novel analysis adapted the fishplot to depict the size and duration of circulating genomic
clusters over time in New South Wales, Australia. It illuminated the effectiveness of interventions on the
emergence, spread and eventual elimination of clusters and distilled genomic data into clear information
to inform public health action.
Introduction
Since the arrival of the first COVID-19 case in Australia, the Pathogen Genomics Team at New South
Wales (NSW) Health Pathology’s Institute of Clinical Pathology and Medical Research (ICPMR) and the
University of Sydney have implemented prospective and responsive whole genome sequencing (WGS) of
confirmed SARS-CoV-2 infections. A strong positive correlation between genomics-informed clusters and
epidemiologically linked cases was rapidly established, and prospective SARS-CoV-2 WGS transitioned
from a novel tool with unproven real-time relevance to an essential element of NSW’s COVID-19 public
health response [1]. Key to this transformation and the uptake of genomics by public health professionals
has been the development of novel methods to enable better visualisation and clear communication of
genomic results.
In this correspondence we describe the adaptation and application of ‘fishplots’ to display COVID-19
genomic cluster architecture and evolution over time. The fishplot is a variant of a streamgraph, originally
developed to enable visualisation of clonal tumour evolution [2]. We have adapted fishplot analysis to
describe SARS-CoV-2 virus population dynamics over time, generating an “epi-fishplot” analogous to a
stacked epidemiological curve (Fig. 1) [3]. This analysis simultaneously depicts the relative size and
duration of circulating SARS-CoV-2 genomic clusters, defined by comparison of SARS-CoV-2 consensus
sequences, over the course of the epidemic. While a conventional phylogenetic tree represents genomic
relatedness between individual cases, epi-fishplot analysis enables the timing and impact of key public
health interventions to be easily identified and monitored, such as the successful elimination of
circulating genomic clusters within the NSW population as a result of effective public health policies
(Fig. 1).
Main Text
The state of NSW is Australia’s most populous with 8 million residents accounting for 31% of the
Australian population, 65% of whom live in Greater Sydney. Since the Australian border was closed to all
non-Australian travellers on March 15th and Australians returning from overseas have been required to
complete a mandatory 14-day quarantine in designated hotels since March 28th, NSW has
accommodated over half of the travellers returning to Australia by air. Despite this and at the time of
writing (March 28th, 2021), NSW accounted for just 17% (n = 5094) of Australia’s confirmed COVID-19
Page 3/9cases with no extensive local transmission of any strains linked to foreign travellers returning after March
15th. In total, overseas acquired cases restricted to hotel quarantine outweighed locally acquired cases,
accounting for 59% and 41%, respectively. The multidisciplinary public health response to COVID-19
implemented in NSW is co-ordinated by the Public Health Emergency Operations Centre within the NSW
Ministry of Health (NSW Health) [4]. Key to terminating local SARS-CoV-2 transmission chains has been
the active case finding and contract tracing conducted by NSW Health for each laboratory-confirmed
case, which includes generating a SARS-CoV-2 genomic sequence to monitor its spread.
The integration of genomics into routine public health response has addressed key limitations of
conventional epidemiological methods including poor or incorrect case recall, and confirmation of
contentious or tenuous links. Furthermore, genomics has been instrumental in the timely identification of
links between cases for which epidemiological links were not immediately apparent, supplementing
conventional contact tracing methods and informing targeted public health resource allocation. In NSW,
the integration of genomics into routine public health practice includes prioritisation of clinical samples
for rapid sequencing, weekly verbal and written reports to NSW Health and customised on-demand
reports for urgent, high-priority cases. To date, the Pathogen Genomics Team has generated and shared
1144 complete SARS-CoV-2 genomes representing 28% of all confirmed COVID-19 cases in NSW. On the
basis of epidemiological information provided by NSW Health and specific single nucleotide
polymorphism (SNP) profiles [1], these genomes have been classified into 53 genomic clusters. The
median duration, i.e. circulation in the community, of identified genomic clusters was two weeks,
although this was highly variable (range: 1–16 weeks) with clusters consisting of a median of three
cases (range: 2-204 cases; Fig. 1). Epidemiological data also enabled the Pathogen Genomics Team to
report which cases belong to specific transmission chains, the detail of which is described in regular
reports that overlay conventional phylogenetic trees with infographics representing the supplied
epidemiological data. An epi-fishplot is generated as part of the report to provide a population-level
overview of SARS-CoV-2 clusters co-circulating in the community, illuminating the effectiveness of public
health measures on the emergence, spread and eventual elimination of transmission chains within the
local population (Fig. 1) [4].
Our data illustrates the two epidemiologically distinct waves of SARS CoV-2 infections experienced in
NSW to date, the peaks of which occurred in late March and July, respectively. The first wave resulted
from multiple independent introductions of genomically distinct viruses by overseas travellers prior to the
closure of international borders on March 15th. Sustained local transmission of introduced strains was
the exception and the median duration in weeks for the 17 first wave clusters identified (≥ 5 cases) was 4
(range: 1–10: Fig. 1). By mid-May, local transmission of all clusters identified in the first wave had been
eliminated, despite continued importation of overseas acquired cases into the NSW hotel quarantine
system. This state of elimination, without significant or sustained local transmission (no clusters
consisting of ≥ 5 cases) was maintained for the following two months (Fig. 1).
Genome sequencing confirmed that the second wave was seeded by a domestic importation from
neighbouring state, Victoria, in early July. The interstate resident travelled to NSW immediately prior to the
Page 4/9border between the two states closing for the first time in 100 years in order to prevent spill-over from
Victoria into NSW. Confirming that importation was the source of the initial second wave cluster
(NSW33.0: Fig. 1), and not undetected community transmission, provided important reassurance that the
public health measures in place were effective. The initial infection event occurred at a large licensed
venue situated in close proximity to a highway traversing the east coast of Australia, which facilitated
infection of multiple individuals and enabled this strain to initiate multiple transmission chains amongst
the local population (Fig. 1). Genome sequencing confirmed that public health measures had eliminated
the NSW33.0 cluster by mid-September, and the NSW33.1 subcluster by early November.
Globally, the COVID-19 pandemic has necessitated extraordinary and often innovative public health
responses to prevent widespread virus transmission. The high frequency of asymptomatic infections or
subclinical disease and comparatively limited genomic diversity of circulating strains has exposed
limitations of conventional epidemiological and genomic approaches when deployed in isolation to
contain the spread of SARS-CoV-2. Our experience of rapidly integrating epidemiological and genomic
data into actionable information demonstrates that local elimination is achievable if stringent public
health measures are maintained.
Genomic sequencing is a powerful public health tool that provides a unique level of oversight and
addresses critical limitations of conventional epidemiological methods [5]. The epi-fish approach
described above can be equally applied to other pathogens of public health importance subjected to
integrated genomic surveillance. The successful integration of genomics into routine public health
response relies on a strong working partnership between public health practitioners and laboratory
professionals, with evidence synthesis and visualisation in order to distil complex genomic data into the
information which can guide and benchmark public health actions.
Limitations
A sequence could not be obtained from every confirmed case of COVID-19 detected in NSW during the
study period. Sequences were reliably obtained from samples with a diagnostic PCR Ct value ≤ 30 only.
However, the proportion of sequenced cases (28%) was high compared to that reported by most countries
around the world and more than sufficient to achieve the primary goal of this study which was to
demonstrate the application and utility of the Epifish package.
Abbreviations
NSW: New South Wales
WGS: whole genome sequencing
ICPMR: Institute of Clinical Pathology and Medical Research
SNP: single nucleotide polymorphism
Page 5/9PCR: polymerase chain reaction
Ct: cycle threshold
Declarations
Ethics approval and consent to participate
Clinical specimens were routinely processed at the ICPMR and deemed not research. A non-research
determination for this project was granted by Health Protection NSW since it was a designated
communicable disease control activity.
Availability of data and material
The consensus genome sequences included in this study are all available from GISAID (www.gisaid.org).
A full list of genomes and their corresponding IDs can be found in Additional File 1. The Epifish package
for R is available from Github (https://github.com/learithe/epifish).
Funding
This study was supported by the Prevention Research Support Program funded by the NSW Ministry of
Health and the National Health and Medical Research Council Centre for Research Excellence in Emerging
Infectious Diseases [no. GNT1102962]. V.S. is supported by an Australian National Medical Research
Council fellowship [APP1123879]. The funders of this study had no role in study design, data collection,
data analysis and interpretation, or writing of the article
Acknowledgements
We acknowledge the Sydney Informatics Hub and use of the University of Sydney’s high-performance
computing cluster, Artemis. We thank the NSW Health Pathology partner laboratories, ACT Pathology,
Douglass Hanly Moir, Australian Clinical Laboratories and Laverty Pathology for referring samples for
genomic surveillance. Expert advice and epidemiological information provided by the NSW public health
surveillance units at NSW Health are also gratefully acknowledged. The authors are indebted to all
researchers and their organizations who have shared SARS-CoV-2 genome data on GISAID.
Consent for publication
Not applicable
Page 6/9Competing interests
The authors declare that they have no competing interests
Author contributions
Data generation/collection/analysis was performed by AA, JD, RR, CL, RB and JM. Bioinformatic
analyses and support was performed by RR, RS, MG and EM. JD performed R coding. Drafting the
manuscript was performed by AA, JD, BM, JK, DD, SC and VS. The final manuscript was approved by all
authors.
References
1. Rockett RJ, Arnott A, Lam C, Sadsad R, Timms V, Gray KA, et al. Revealing COVID-19 transmission in
Australia by SARS-CoV-2 genome sequencing and agent-based modelling. Nat Med.
2020;26(9):1398–404. doi:10.1038/s41591-020-1000-7.
2. Miller CA, McMichael J, Dang HX, Maher CA, Ding L, Ley TJ, et al. Visualizing tumor evolution with
the fishplot package for R. BMC Genom. 2016;17(1):880. doi:10.1186/s12864-016-3195-z.
3. Draper J. Epifish package for R, https://github.com/learithe/epifish.
4. McAnulty JM, Ward K. Suppressing the Epidemic in New South Wales. N Engl J Med. 2020;382:e74.
doi:10.1056/NEJMc2011592.
5. Deng X, Gu W, Federman S, du Pleiss L, Pybus OG, Faria NR, et al. Genomic surveillance reveals
multiple introductions of SARS-coV-2 into Northern California. Science. 2020;369(6503):682–7.
doi:10.1126/science.abb9263.
Figures
Page 7/9Figure 1
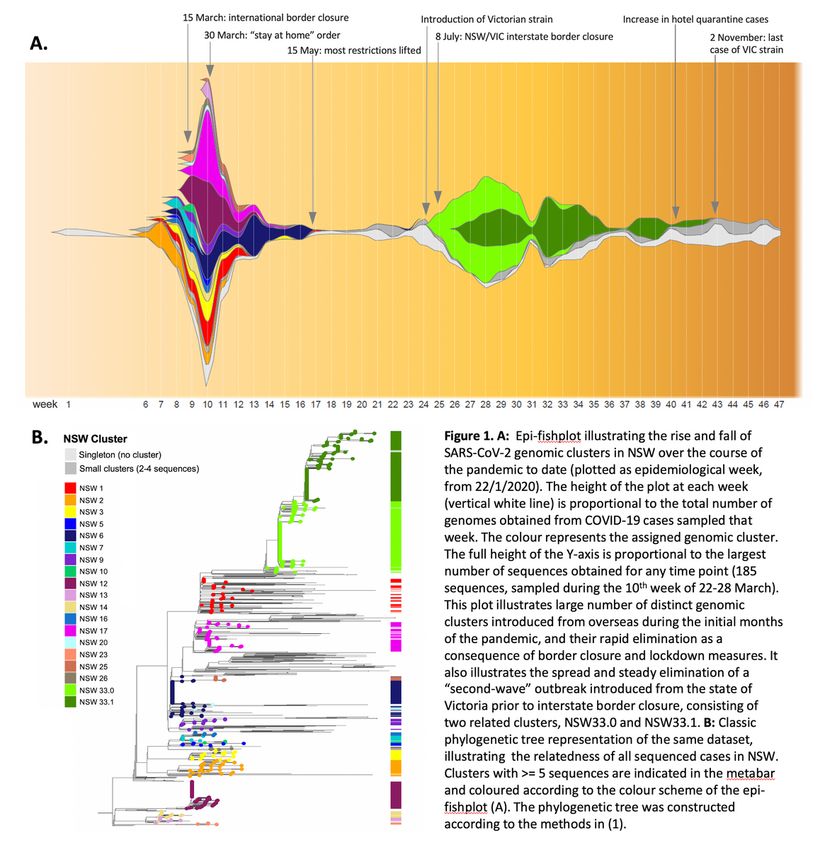
Epi-fishplot illustrating the rise and fall of SARS-CoV-2 genomic clusters in NSW over the course of the
pandemic to date (plotted as epidemiological week, from 22/1/2020). (a) The height of the plot at each
week (vertical white line) is proportional to the total number of genomes obtained from COVID-19 cases
sampled that week. The colour represents the assigned genomic cluster. The full height of the Y-axis is
proportional to the largest number of sequences obtained for any time point (185 sequences, sampled
Page 8/9during the 10th week of 22-28 March). This plot illustrates large number of distinct genomic clusters
introduced from overseas during the initial months of the pandemic, and their rapid elimination as a
consequence of border closure and lockdown measures. It also illustrates the spread and steady
elimination of a “second-wave” outbreak introduced from the state of Victoria prior to interstate border
closure, consisting of two related clusters, NSW33.0 and NSW33.1. (b) Classic phylogenetic tree
representation of the same dataset, illustrating the relatedness of all sequenced cases in NSW. Clusters
with ≥ 5 sequences are indicated in the metabar and coloured according to the colour scheme of the epi-
fishplot (a). The phylogenetic tree was constructed according to the methods1.
Supplementary Files
This is a list of supplementary files associated with this preprint. Click to download.
Additionalfile1.xlsx
Page 9/9You can also read