DTI vs. HARDI methods in diffusion MRI: advantages and limitations in a clinical setting - NICHD Carlo Pierpaoli Program in Pediatric Imaging & ...
←
→
Page content transcription
If your browser does not render page correctly, please read the page content below
DTI vs. HARDI methods in
diffusion MRI: advantages and
 limitations in a clinical setting
               Carlo Pierpaoli
Program in Pediatric Imaging & Tissue Sciences
                    NICHD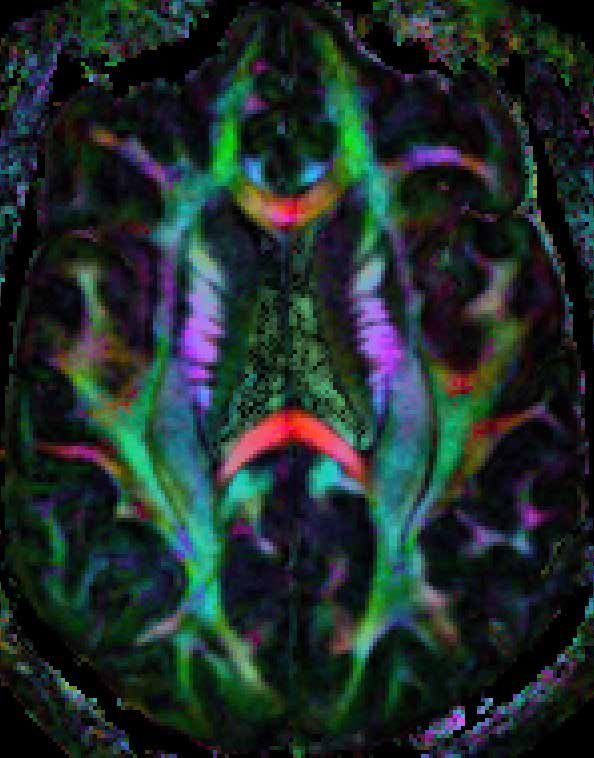
Gray matter
             (Cortex)

               isotropic
               diffusion

~ microns                       mm
            White matter
            (Corpus callosum)

              anisotropic
              diffusion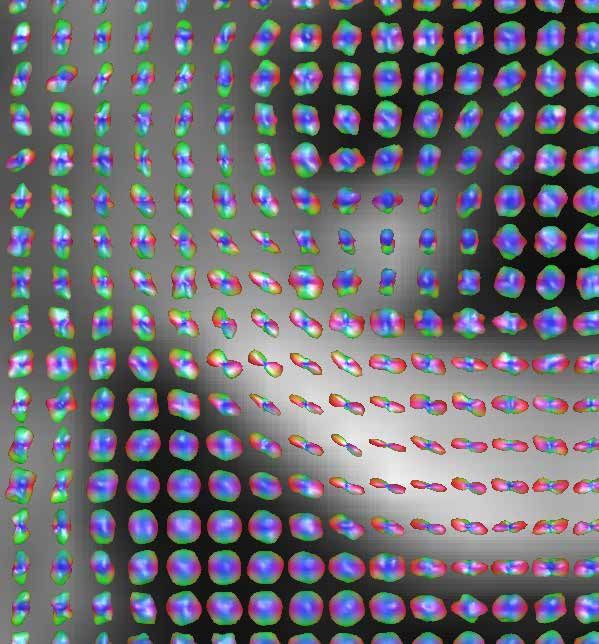
Poll question
Anisotropy is related to which feature of the water
displacement profile:

1) SIZE

2) SHAPE

3) ORIENTATION
Diffusion Tensor MRI Flowchart
Diffusion Tensor MRI of the Human
Brain.

                   Diffusion ellipsoids
                   computed in each
                   voxel

                 Pierpaoli, et al, Radiology, 1996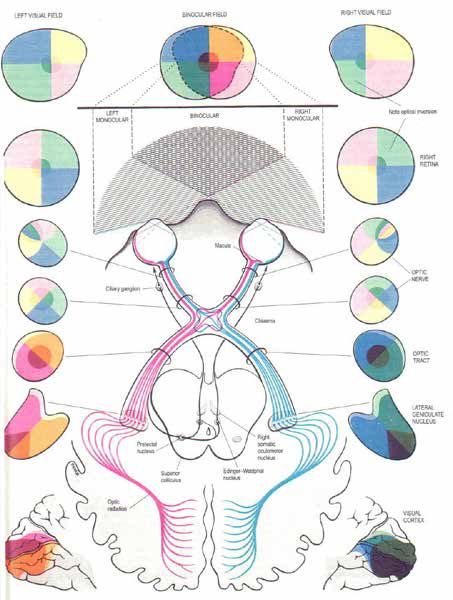
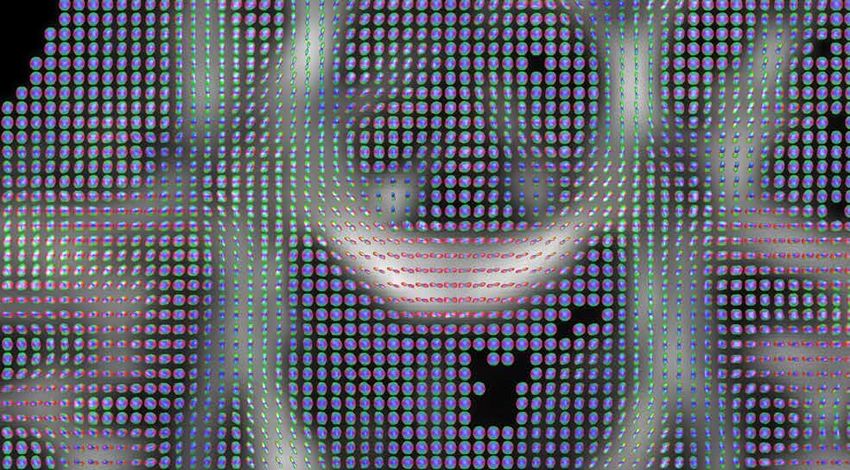
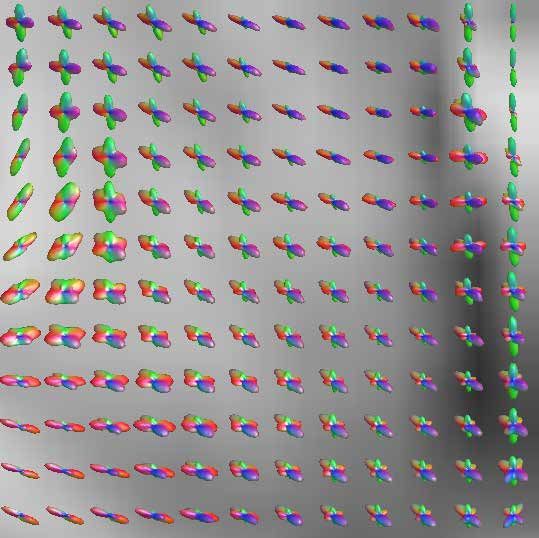
HARDI (High Angular Resolution
     Diffusion Imaging)

        Slide courtesy of Everen Ozarslan (DT-MAP )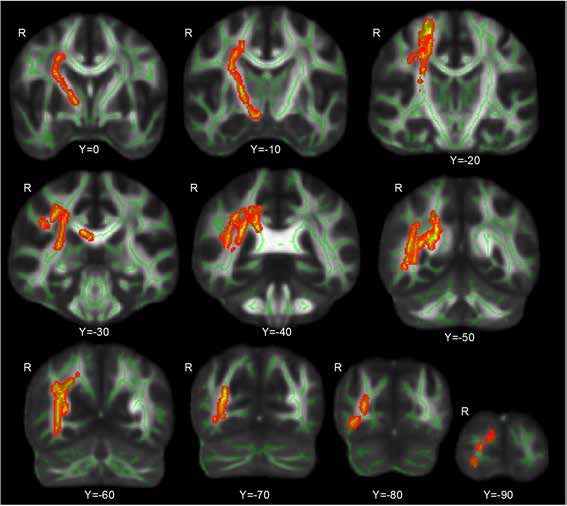
Diffusion MRI

Diffusion tensor Imaging: minimum
6 directions, b-value = 800-1200.
Spatial resolution: 2x2x2 mm

HARDI (High Angular Resolution
Difusion Imaging): minimum 40-60
directions, b-value: 3,000 and higher.
Spatial resolution: 3x3x3 mm
HARDI reconstruction,
    longitudinal data, some subject

A                                     B
Poll question
What determined the difference between scan A and B:

1) In scan A the subject was younger and the immature brain
   had less connections

2) Scan A was in the acute phase of trauma, scan B at a
   later time shows brain reorganization

3) Pattern compatible with all of the above

4) Some strange experimental artifact
DTI vs. HARDI
1) Proper HARDI requires a larger amount of high quality
   data than DTI. In a clinical setting, artifacts can be easily
   mistaken for biologically meaningful findings
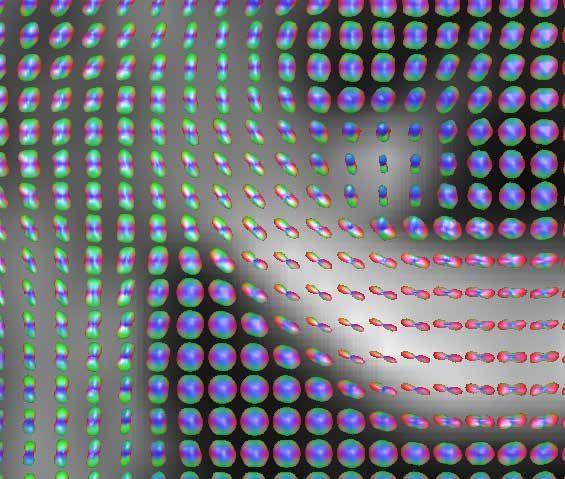
HARDI reconstruction from
    previous data
Registration of high b-value images. A standing challenge.
B = 30 s/mm2
B = 900 s/mm2
B = 9000 s/mm2DTI vs. HARDI 1) Proper HARDI requires a larger amount of high quality data than DTI. In a clinical setting, artifacts can be easily mistaken for biologically meaningful findings 2) HARDI is almost exclusively used for “tractography” and “connettivity”. Diffusion MRI is ill-suited to investigate brain structural connectivity.
Interdigitation occurs at a microscopic level
DTI vs. HARDI 1) Proper HARDI requires a larger amount of high quality data than DTI. In a clinical setting, artifacts can be easily mistaken for biologically meaningful findings 2) HARDI is almost exclusively used for “tractography” and “connettivity”. Diffusion MRI is ill-suited to investigate brain structural connectivity. 3) There is no free lunch. … with HARDI one has to trade- off resolution to characterize a more complex displacement profile.
Radial Diffusion MRI for sub-millimeter resolution DTI (Sarlls et al. Neuroimage 2009)
Standring, S. (Ed.), 2005. Gray’s Anatomy: The Anatomical Basis of Clinical Practise. 39 ed. Elsevier Churchill Livingstone, Edinburgh, London.
DTI vs. HARDI 1) Proper HARDI requires a larger amount of high quality data than DTI. In a clinical setting, artifacts can be easily mistaken for biologically meaningful findings 2) HARDI is almost exclusively used for “tractography” and “connettivity”. Diffusion MRI is ill-suited to investigate brain structural connectivity. 3) There is no free lunch. … with HARDI one has to trade- off resolution to characterize a more complex displacement profile. 4) Clinical usefulness: DTI ++, HARDI ??
Trace(D) (averaged mean-squared displacement)

                                   • Trace(D) is
                                   homogeneous in
                                   normal brain
                                   parenchyma

                                   • Low inter-subject
                                   variability

T2 weighted image   Trace(D) map (also called ADC or MD)
T2WI Trace(D)
7.5-month old boy who reportedly fell off the bed onto a
carpeted floor. Scan performed 1 day after presentation.
Suh DY et al Neurosurgery, Vol. 49, No. 2, August 2001, 309-20Hypothesis by Matt Budde, et
al., PNAS, 2010
Neurite beading is sufficient to decrease ADCintra by restricting
water mobility along each neurite.
Approach
Derive a biophysical model of beading in neurites
Simulate diffusion MR experiment in 3D geometrical surfaces
Validate model in mammalian tissuesWhat can we learn from other imaging modalities?
In vivo two-photon microscopy (Murphy T, et al. J Neurosci 2008)
Normal Rodent
CortexNeurite beading occurs abruptly after ischemia…
4 min after MCAO…and resolves upon reperfusion.
17 min after reperfusionDiffusion anisotropy (shape of displacement profile)
• Diffusion anisotropy
is highly variable in
normal white matter
• Differences in
anisotropy reflect
differences in white
matter architecture
T2 weighted image Anisotropy mapSecondary degeneration in the Cerebral Peduncle
Healthy Affected
Side Side
T2WI Trace(D) Anisotropy
NeuroImage 13, 1174–1185 (2001)Fiber orientation
T2 weighted image DEC fiber orientation map
Pajevic, Pierpaoli, MRM 1999Degeneration of pontocerebellar pathways
in Multiple System Atrophy
Transverse Pontine Fibers
Pyramidal Tract
Healthy subject
Transverse Pontine Fibers
MSA patientTemporal evolution of a Pontine Glioma
DEC MAp
Delta R1 map
Time Time 1 Time 2 Time 3 Time 4
0
T0 + 34 T0 + 140 T0 + 363 T0 + 426
days days days daysCONCLUSIONS 1) Proper HARDI requires a larger amount of of high quality data than DTI. In a clinical setting, artifacts can be easily mistaken for biologically meaningful findings 2) HARDI is almost exclusively used for “tractography” and “connettivity”. Diffusion MRI is ill-suited to investigate brain structural connectivity. 3) There is no free lunch. … with HARDI one has to trade- off resolution to characterize a more complex displacement profile. 4) Clinical usefulness: DTI ++, HARDI ??
Outlier Rejection Probability Map
Lindsay Walker et al Neuroimage 2011
Biological Psychiatry, 2013
Mid-Atlantic

                                    MIRECC
                                    Mental Illness Research, Education & Clinical Center

White Matter Damage in Blast-exposed Veterans
without Mild TBI

Rajendra Morey, M.D.
Associate Professor
Background • Exposure to explosive forces from bombs is common in Veterans of recent military conflicts • Majority of traumatic brain injury (TBI) at forward deployed medical facilities involves exposure an improvised explosive device (IED), grenade, rocket-propelled grenade (RPG), or mortar fire. • Damage to brain tissue (white matter) using Diffusion Tensor Imaging (DTI) is well established in cases that clinical symptoms of mild TBI. • Recent studies of sports participants show compromised white matter integrity even in the absence of clear concussive symptoms.
Poll question #1
• How many of you are familiar with the
  Junior Seau case?
  – Yes
  – No
  – Not sure
Poll Question #2

Is there prominent injury to brain tissue in
Veterans with blast exposure without clinical
symptoms of TBI ?
  – Yes
  – No
  – Not sure
Subconcussive blast exposure

•   6 Veterans with pure primary blast mTBI
•   16 blast exposed without mTBI
•   23 blast unexposed
•   All had DTI scans in the chronic stage
Figure1. Whole brain voxelwise comparison of FA between the blast-exposed
and the blast-unexposed control group was covaried for age and severity of
PTSD (CAPS score). These results show significantly lower FA in the blast-
exposed group compared to the blast-unexposed group in diffuse cortical and
subcortical tracts based in the right hemisphere including the forceps major,
superior and inferior longitudinal fasciculus, anterior thalamic radiations,
inferior fronto-occipital fasciculus, and the corticospinal tract (p < .05;
corrected).
0.8           + 2 SD
reference subjects’ FA

                                                          0.6

                              test-subject FA
                                                                        - 2 SD

                                                     FA
                                                          0.4

                                                    FA
                                                          0.2

                                                           0
                                                                test-subject     reference
                                                                                                         whole brain Z-map
                                reference group                        sample voxel
                                    mean FA

Figure 1. Following preprocessing of DTI data, the analytic approach was based on registration of FA maps as implemented in
the FSL tract based spatial statistics (TBSS). The primary statistical approach used the standard deviation of fractional
anisotropy for each voxel in the reference group. Using the mean and standard deviation of FA for the reference group, the test-
subject’s voxels were compared to the skeleton voxels (green highlight) that were generated for the reference group. For the
test-subject, we computed a statistical map that reflects the number of standard deviations below the mean of the reference
group, which is effectively a z- map. The whole brain z-map shows voxels (in red) where FA of the test-subject was found to be
greater than two standard deviations below the mean FA of the reference group.
Figure 2. There was a significant main effect of group [F(2,42)=4.4, p=.02] on the number of small (25-50 voxel), medium (50-75 voxel), and large (75-100 voxel) potholes, which were defined by low FA values (z < -2). The blast- unexposed control group had significantly fewer potholes than the blast-mTBI group (p = .009) and the blast-exposed group (p = .036). Based on the number of potholes, the blast-exposed group resembled the blast-mTBI group when considered in relation to the blast-unexposed control group
Radial and Axial Diffusivity
Figure 4. There was a significant main effect of group [F(2,42)=3.7, p=.034]
on the number of small (25-50 voxel), medium (50-75 voxel), and large (75-
100 voxel) potholes, which were defined by low radial diffusivity (z < -2). The
blast-unexposed control group had significantly fewer radial diffusivity potholes
than the blast-mTBI group (p = .032) and the blast-exposed group (p = .025).
Based on the number of potholes, the blast-exposed group resembled the
blast-mTBI group when considered in relation to the blast-unexposed control
group.
Figure 4. There was a non-significant main effect of group [F(2,42)=2.0,
p=.15] on the number of small (25-50 voxel), medium (50-75 voxel), and large
(75-100 voxel) potholes, which were defined by voxels with low axial diffusivity
values (z < -2).
Y=0
Y=0
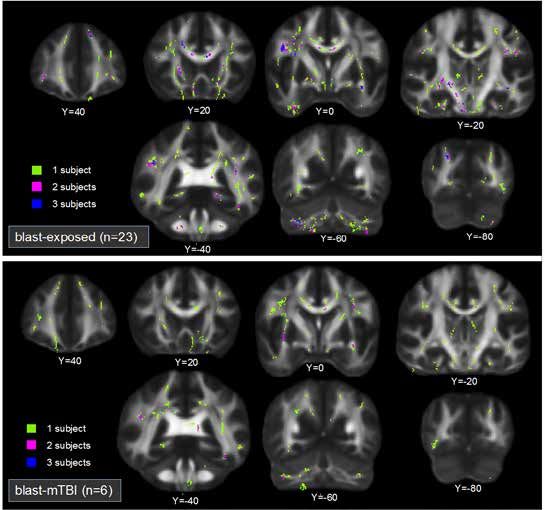
Figure 5. A whole brain voxelwise histogram of potholes over 25 voxels in size demonstrates that potholes in blast-exposed (top
panel) and blast-mTBI (lower panel) veterans were distributed in a scattershot spatial distribution. In the voxelwise histogram overlay,
lime-green indicates voxel locations where only 1 veteran had a pothole, violet indicates voxel locations were 2 veterans had a
pothole, and dark blue indicates voxel locations where 3 veterans had a pothole. Rare instances of voxels had 4-7 subjects (data not
shown).Figure 6. Grey matter potholes with VBM
Conclusions
• Blast-exposed Veterans experience white matter
  damage that is comparable to mild TBI even in the
  absence of clinical symptoms.
• The lack of clinically observable TBI symptoms following
  blast exposure may lead to the erroneous conclusion
  that little or no damage has occurred to brain tissue and
  consequently may go unnoticed.
• If confirmed, our findings would argue for an overhaul of
  the established approach for making diagnoses based
  on clinically observable symptoms of mild TBI in favor of
  novel imaging based diagnostic criteria that “look below
  the surface” for pathology.
References
•   Davenport ND, Lim KO, Armstrong MT et al: Diffuse and spatially variable white
    matter disruptions are associated with blast-related mild traumatic brain injury.
    Neuroimage 2012; 59:2017-2024
•   Jorge RE, Acion L, White T et al: White matter abnormalities in veterans with mild
    traumatic brain injury. Am J Psychiat 2012; 169:1284-1291
•   Koerte IK, Ertl-Wagner B, Reiser M et al: White matter integrity in the brains of
    professional soccer players without a symptomatic concussion. JAMA 2012;
    308:1859-1861
•   Koerte IK, Kaufmann D, Hartl E et al: A prospective study of physician-observed
    concussion during a varsity university hockey season: white matter integrity in ice
    hockey players. Part 3 of 4. Neurosurg Focus 2012; 33:E3-
•   Bazarian JJ, Donnelly K, Peterson DR et al: The relation between posttraumatic
    stress disorder and mild traumatic brain injury acquired during Operations Enduring
    Freedom and Iraqi Freedom. J Head Trauma Rehabil 2013; 28:1-12
•   Morey RA, Haswell C, Selgrade E, Massoglia D, Liu C, Weiner J, Marx C, Workgroup
    M-AM, Cernak I, McCarthy G. Effects of chronic mild traumatic brain injury on white
    matter integrity in Iraq and Afghanistan Veterans. Human Brain Mapping. June 2012
Q&A
Carlo Pierpaoli, M.D., Ph.D.
Rajendra Morey, M.D., M.S.
Associate Professor
Psychiatry and Behavioral Sciences, Program on Pediatric Imaging and Tissue Sciences,
and Duke-UNC Brain Imaging and Analysis Center National Institute of Child Health and Human
Duke University School of Medicine Development (NICHD), National Institutes of Health
Director, Neuroimaging Lab (NIH)
Mental Illness Research Education and Clinical Center 13 South Drive, MSC 5772
Durham VA Medical Center Bldg. 13, Rm. 3W16
Phone: 919-286-0411 x 6425 Bethesda, MD 20892-5772
Fax: 919-416-5892 (301) 402-2289
email: rajendra.morey@duke.edu Email: cp1a@nih.gov
web: www.duke.edu/web/moreylabYou can also read