Food & Beverage Food and Beverage industry
←
→
Page content transcription
If your browser does not render page correctly, please read the page content below
N E W S LE TTE R

Food &
Beverage

The Coronavirus Im pact:
Insights &Takeaw ays
May 2020
       THE CORONAVIRUS IMPACT: INSIGHTS & TAKEAWAYS   www.globalma.com
                                                         www.globalma.com
CONTENTS

                                                      1   Introduction                                 03

                                                      2   COVID-19: Current Overview                   04

                                                          The Global Economic Impact of                04
                                                          Coronavirus

                                                          Regional Update: Is the Worst Over?          05

                                                      3   Food & Beverage
                                                                                                       07
                                                          Industry Insights

                                                          Analyzing the Food & Beverage Supply         07
The Coronavirus crisis is forcing Food & Beverage         Chain: “A Tale of Two Cities”
companies to adapt to newer, disruptive trends in
the short-term. Channels have shifted, and                Major Food & Beverage Players:
changing consumer purchasing habits are dictating
                                                                                                       10
                                                          Impact and Mitigation
product mix and alternative delivery methods, with
lasting implications across the supply chain:             Mitigation Measures that will Define         13
                                                          Future Trends
• As on-premise consumption declines and more
  food is prepared at home, the Food Retail sector        Critical Takeaways for Food & Beverage       14
  will continue to see growing demand, while
  Foodservice and Hospitality will be forced to
  adapt or struggle to operate.                       4   Near-Term Effects on
                                                                                                       15
                                                          the M&A Market
• Virus-induced fears have elevated safety and
  reliability in consumer food choices, with home
                                                          Mergers & Acquisitions (M&A)                 15
  seclusion accelerating demand for at-home
                                                          in a Time of COVID-19
  meal preparation and innovative delivery
  options.
                                                          Critical Takeaways for Food & Beverage       16
                                                          M&A
• Online shopping, home cooking, and increased
  consumption of locally-sourced and healthy
  foods are among the more permanent shifts           5   Peer Valuation & Trading Analysis            17
  expected, with growing importance placed on
  eCommerce, safe and sustainable local
                                                          Public Company Valuation &                   17
  production, and functional foods. Additionally,
                                                          Operating Metrics
  the recessionary economy will propel private
  label’s growth trajectory as consumers prioritize
  value in buying decisions.
                                                          Share Price Performance                      22

Our Global Food & Beverage Team provides
                                                          Select M&A Transactions                      23
extensive sector-specific expertise and close
relationships with global buyers and sellers, both    6   Global M&A Partners                          26
within your local market and throughout the world.        Food & Beverage Team
Many of our advisory transactions are cross-border.

                                                      7   Global M&A Partners Selection                27
                                                          of Transactions

    2         THE CORONAVIRUS IMPACT: INSIGHTS & TAKEAWAYS                                 www.globalma.com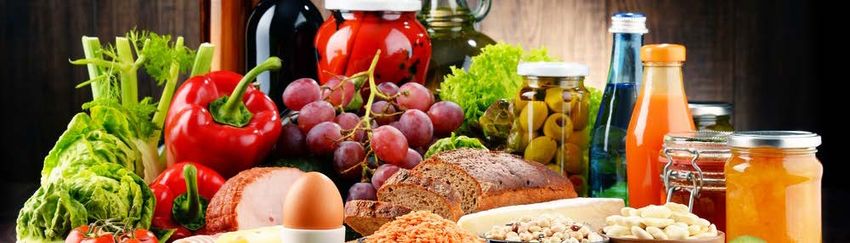
Introduction
The coronavirus (COVID-19) pandemic has dramatically impacted most industries, leading to a severe contraction in the
global economy. According to Fortune.com, ~94% of Fortune 1,000 manufacturers are being affected due to dislocation
caused by the crisis. Supply chain disruptions have been devastating, and restrictions on the movement of people and
goods has limited commercial activities resulting in reduced economic activity. Government stimulus efforts and stringent
containment measures are speeding up the recovery, with evidence suggesting that infection rates may be nearing a peak.
COVID-19 has compelled Food & Beverage players to rethink their operations as a result of rapidly-changing short-term
market challenges, which has had implications on the entire supply chain. Channel sales have undergone a dramatic shift
due to a virtual shutdown of on-premise outlets (foodservice/restaurants), which, in turn, has fueled growing demand in
off-premise consumption. Major brands are seeing disruption in customer loyalty as limited choices on shelves prompts
adaptation to the “available option”. As consumers stockpile amid quarantines and elevate safety and reliability in
purchasing decisions, companies are responding by redirecting sales to off-premise retailers, altering product mixes, and
turning to local sourcing options. This changing landscape has further accelerated the need for brands to pursue omni-
channel and direct sales strategies, with demand for eCommerce and other home delivery models expected to remain
after the recovery.
Volatility is weighing on the M&A market, with some investors adopting a “wait-and-see” approach to deal-making.
However, the market continues to present acquisition opportunities, and buyers are proceeding with caution and
sharpened pencils. Food & Beverage assets will likely be viewed as a “flight to safety,” particularly for those serving the off-
premise, omni-channel, and direct-to-consumer channels. An emergence of struggling companies will necessitate financial
restructurings, and private equity sponsors will be ideal partners to facilitate these transactions. In addition, minority
equity investments could see an uptick as sponsors and sellers look for ways to share risk. The long-term outlook for Food
& Beverage M&A continues to be optimistic and is expected to return to pre-COVID-19 levels.

     World Baseline Scenario Forecast: Industry Retail Sales % ‘19-’20
    The Food & Beverage industry is likely to see the largest gains in fresh foods and packaged food as more consumers
    prepare meals at home.
                                    -20%   -15%          -10%           -5%            0%             5%            10%
                      Luxury Goods
              Personal Accessories
            Apparel and Footwear
                           Eyewear
         Beauty and Personal Care
                           Tobacco
                  Consumer Health
             Consumer Electronics
             Consumer Appliances
                 Home and Garden
                   Alcoholic Drinks
                         Soft Drinks
         Retail Tissue and Hygiene
                         Hot Drinks
                   Toys and Games
                           Pet Care
                         Home Care
                        Fresh Foods
                    Packaged Food

Source: Euromonitor International

3             THE CORONAVIRUS IMPACT: INSIGHTS & TAKEAWAYS                                                  www.globalma.com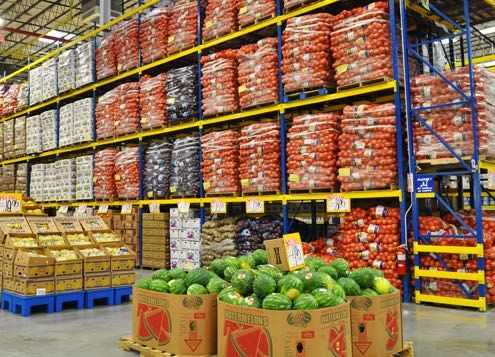
COVID-19: Current Overview
  The Global Economic Impact of Coronavirus

   Originated in Wuhan, China, COVID-19 has spread globally, with the United States, Italy, Spain, Germany, France, and
   China among the most affected countries at the outset. Currently, the number of confirmed cases worldwide has risen to
   nearly 3,000,000.
   Governments have enforced stringent health and safety measures in an attempt to contain the spread, including the use
   of national- and state-level lockdowns, travel restrictions , and nationwide healthcare awareness, which have had a
   dramatic effect on the movement of people and goods. Supply chain disruptions have been devastating for many
   industries, which are facing challenges in procuring the required inputs to manufacture products. Consumers are
   spending less time in commercial activities including work, education, fitness, and entertainment which has resulted in
   reduced discretionary spending.
   The coronavirus pandemic has dramatically impacted several industries leading to a severe contraction in the global
   economy. In March, the International Monetary Fund (“IMF”) declared a global economic recession−pointing to the long
   duration of the outbreak and inadequate containment over two quarters−and subsequently lowered its GDP growth
   forecast. It is estimated that the COVID-19 crisis will result in a $2.0+ trillion loss to the global economy in 2020,
   according to forecasts from the United Nations.

                                     Real GDP Growth Forecast (%) for G20 Economies 2020-21

            Canada
            2019: +1.6
            2020P: -6.2                                                         Germany
            2021P: +4.2                                 United Kingdom          2019: +0.6
                                                              2019: +1.4        2020P: -7.0
                                                             2020P: -6.5        2021P: +5.2                   China
                                                              2021P: +4
                                                                                                              2019: +6.1
                                                                                            Italy             2020P: +1.2
                                                                   France
                                                                                            2019: 0.3         2021P: +9.2
         United States                                          2019: +1.3                                                   Japan
                                                              2020P: -7.2                   2020P: -9.1                      2019: +0.7
         2019: +2.3                                                                         2021P: 4.8
         2020P: -5.9                                          2021P: +4.5     Spain                                          2020P: -5.2
         2021P: +4.7                                                          2019: +2                                       2021P: +3
COVID-19 Impact:                                                              2020P: -8
                           Mexico                                                                              India
                                                                              2021P: +4.3
                           2019: -0.1                                                                          2019: +4.2
                           2020P: -6.6                                                                         2020P: +1.9
  High
                           2021P: +3                                                                           2021P: +7.4
  Medium
                                                                Brazil                         South Africa
  Low
                                                                2019: +1.1                     2019: +0.2                       World Output:
                                                                2020P: -5.3                    2020P: -5.8                      2019: +2.9
                                                                2021P: +2.9                    2021P: +4.0
                                                                                                                                2020P: -3.0
                                                                                                                                2021P: +5.8

   Source: IMF.org as of April 14, 2020, Our World in Data, GMAP Estimates

  4                THE CORONAVIRUS IMPACT: INSIGHTS & TAKEAWAYS                                                              www.globalma.com
COVID-19: Current Overview

Regional Update: Is the Worst Over?

 Estimated Peak Weeks and Decline to Zero New Cases for Top Infected Countries

Source: GlobalData

Note: Peak weeks of outbreak shown in pink. Recovery weeks with decline in daily new cases close to zero shown in green. Lighter colored squares
represent uncertain estimates

Americas
COVID-19 is spreading across the Americas region with the largest impact initially on the United States, which now reports
the highest number of cases worldwide. The impact on the U.S. economy will materialize in 2H 2020 with GDP forecasted to
contract 5.9% for the full year. Changes in consumption habits, social distancing, and reduced demand have driven
unemployment to record highs in recent months across North and South America. However, the impact is expected to be
short-term; unemployment is projected to decline and economic growth is forecasted to rebound.

    Path to Recovery:

           Brazil: Brazil's coronavirus plan is to inject $34 billion into the economy in an attempt to stimulate the private
           sector, protect the supply chain, and maintain jobs. Meanwhile, delivery and eCommerce platforms are playing a key
           role in the Food & Beverage industry to boost sales and enable commerce. GDP growth is forecasted to rebound to
           +2.9% in 2021.

           Mexico: Mexico’s health authorities recently announced the beginning of Phase 3 (the highest infection phase) on
           April 21. All non-essential sectors have halted production, with an expectation of resuming regular activities at the
           beginning of June. However, there are internal and external pressures to activate specific sectors (e.g. automotive)
           sooner in order to keep the majority of jobs intact and avoid disruption of supply chains, as per the USMCA trade
           agreement. The final outcome is yet to be decided by the Mexican authorities. GDP growth is forecasted to rebound
           to +3.0% in 2021.

           The United States: Most U.S. states appear to have peaked under strict virus containment measures, with
           anticipated reopening in a staged format during May and June. President Trump has recently unveiled a phased
           approach to opening up states that have been less severely impacted, beginning May 1. However, the decision will
           ultimately be left to the discretion of state governors with guidelines from the federal government. GDP growth is
           forecasted to rebound to +4.7% in 2021.

Source: International Monetary Fund

5            THE CORONAVIRUS IMPACT: INSIGHTS & TAKEAWAYS                                                                       www.globalma.com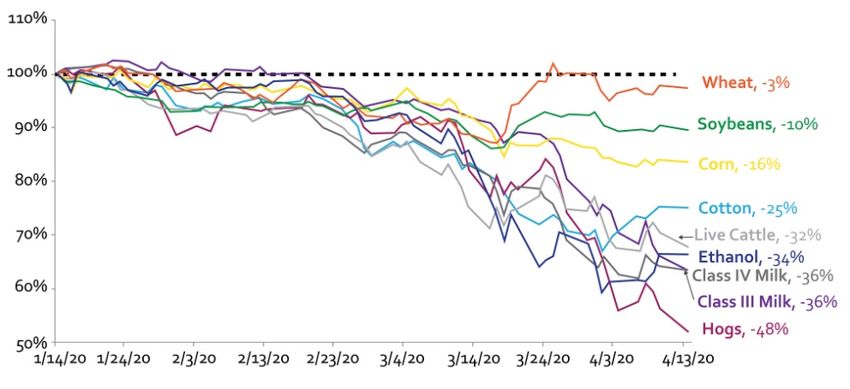
COVID-19: Current Overview

Europe
Euro area GDP is projected to contract 7.5% in 2020 due to reduced consumption and the sharp downward revision to U.S.
growth (the EU's biggest export market). The economy is expected to rebound in 2021 to +4.7% growth. New cases have
recently declined, boosting investor confidence and consumer optimism in the market.

    Path to Recovery:
           France: In April, approximately 2,500 French food markets were granted an exemption from the COVID-19
           lockdown and permitted to reopen, under strict compliance with health regulations. Most are small-scale and
           located in rural areas where such markets are the only way to access food products. GDP growth is forecasted to
           rebound to +4.5% in 2021.
           Germany: Germany aims to ease restrictions in a staged format once targeted reductions in infection rates are
           achieved (less than one person per patient). Bookshops, florists, fashion stores, bike and car outlets, and other
           smaller shops (less than 800 sq m) were permitted to reopen on April 20. GDP growth is forecasted to rebound to
           +5.2% in 2021.
           Italy: For the first time since the pandemic, Italy has seen a decline in the number of infections and deaths caused
           by COVID-19. The Italian government plans to enter Phase 2 of the lockdown, which includes allowing citizens to
           leave their homes to visit family members, as well as opening some parts of the economy including the automobile,
           construction, and fashion industries. GDP growth is forecasted to rebound to +4.8% in 2021.
           Netherlands: All food shops and markets remained open during the partial lockdown. Restaurants are closed for
           dining-in but are allowed to prepare food for take away or home delivery. Easing of the lockdown will take place in
           several stages and start with opening primary schools and daycare. Currently, restaurants are not expected to open
           before May 20.

           UK: Health Secretary Matt Hancock recently announced that the region has “reached its peak” and that testing
           capacity has expanded “ahead of plan.” Although social distancing will persist for a period of time, the UK
           government will introduce large scale contact tracing as a way of easing lockdown restrictions. GDP growth is
           forecasted to rebound to +4.0% in 2021.

Rest of the World
Other countries such as China, India, Australia, and South Africa have had dramatic declines to their 2020 GDP growth
estimates. These countries are facing simultaneous virus-induced shocks, including supply chain disruptions, restricted
movement of people and goods, reduced demand for commodities, and capital outflow pressures. However, these countries
are beginning or planning to resume business activities, and these economies are showing signs of recovery.

    Path to Recovery:
           Australia and New Zealand: As water-locked countries, both Australia and New Zealand benefited from
           solitude. New Zealand has shutdown all international flights into the country as of April 20. Infection rates in
           Australia have decreased more than 25% since mid-March, and Australia is one of the few nations to detail plans to
           re-open schools. Prime Minister Scott Morrison announced on April 21 that hospitals will resume many elective
           surgeries, and schools will be reopened shortly.
           China: As the central hub for the global outbreak of COVID-19, China was the first country to experience economic
           declines. A majority of sectors have resumed activity: resumption rates across various industries has increased, led by
           Food & Beverage with 97.3%; 73% of restaurants (including on and off-premises) have reopened as of March 18. GDP
           is expected to grow 1.0% in 2020, down from 5.5% in 2019. However, GDP growth is forecasted to rebound to +9.2%
           in 2021
           India: Some 7,500 of the largest wholesale farm markets and 25,000 small weekly markets have recently begun
           reopening and are operating and transporting produce while maintaining social distancing. Major foodservice
           companies such as Domino’s have partnered with food retailers across the country to deliver basic grocery items to
           customers. Similarly, leading online grocer, Big Basket, has partnered with Uber to deliver its products to consumers.
           GDP growth is forecasted to rebound to +7.4% in 2021.
Source: International Monetary Fund

6            THE CORONAVIRUS IMPACT: INSIGHTS & TAKEAWAYS                                                   www.globalma.com
Food & Beverage Industry
 Insights
 Analyzing the Food & Beverage Supply Chain:
 “A Tale of Two Cities”
 COVID-19 has affected the Food & Beverage supply chain worldwide creating a disparity that can be defined as a “Tale of
 Two Cities.” The differences in recent operating performance of businesses focused on the off-premise versus on-premise
 channels is virtually “night and day.” While the duration of this impact is expected to be short-term, the ability of
 companies to quickly adapt to these disruptions may determine whether they prevail over the long-term. Conversely, off-
 premise retailers and food manufacturers continue to see swelling demand. Regardless, almost all businesses are facing
 labor issues due to social distancing, which may reduce or halt production and fall short of meeting consumer demand.
 While the Food & Beverage industry is not immune to virus-induced challenges, the severity of the impact is moderately
 low relative to other industries. We believe the Food & Beverage industry has the potential to recover at a faster pace as
 its products are broadly-defined as “essential.”

                                                          ON-PREMISE SUPPLY CHAIN

                                                                Food Manufacturers
                   Raw Materials          Trade and Logistics     and Processors      Distribution        Foodservice/
                                                                                                           Restaurants

                                                                                                          Food Retail

                                                         OFF-PREMISE SUPPLY CHAIN

                                          COVID-19 IMPACT         NEGATIVE     MODERATE     POSITIVE

                   Raw Materials: Agriculture and Livestock
                   Industries   NEGATIVE / MODERATE

Suppliers of raw materials such as agricultural produce, ingredients, and intermediate food
products are challenged. Those suppliers focused on the off-premise channel are seeing
plentiful demand, while on-premise producers are facing oversupply and tough times. Although
a majority of producers aren’t solely focused on one side of the supply chain, many are
struggling to find customers for excess production, with much going to waste. For example, the
United States Cattlemen’s Association (USCA) estimates the coronavirus crisis could cost the
U.S. domestic cattle industry more than $14.6 billion.
The governments of some countries are considering aid/bailout plans to assist farmers and
producers during these unprecedented times. The United States Department of Agriculture
(USDA) recently announced a COVID-19 food assistance program that will take several actions
to assist U.S. farmers, ranchers, and consumers in response to the pandemic. The CARES Act
funded over $19 billion to the USDA in an effort to support the agribusiness and livestock
industries.
Source: USDA.gov, Customer Ag Solutions, Beefbasis.com

 7            THE CORONAVIRUS IMPACT: INSIGHTS & TAKEAWAYS                                                 www.globalma.com
Food & Beverage Industry Insights

 Impact of COVID-19 on US Commodity Futures Prices
Cumulative percent change in price since outbreak confirmed by China

          Trade and Logistics                      MODERATE

Trade and logistics (T&L) operators are navigating challenges of national
lockdowns, volatile supply, reduced traffic at foodservice outlets, and labor
shortages. T&L brokers focused on servicing off-premise channels continue to see
robust demand from their retail customers. However, labor shortages are
persisting due to social distancing which is creating workforce bottlenecks.
Furthermore, the United States, China, Italy, Germany, Spain, and the UK are
among the many countries to impose trade restrictions to counter the spread of
the virus.
To alleviate these issues, the U.S. Federal Motor Carrier Safety Administration
waived the hours of service restriction for truck drivers in order to meet food
transport needs. In addition, governing bodies including the Food and Agriculture
Organization ( FAO), World Health Organization (WHO), and World Trade
Organization (WTO) have come forward to promote free trade flow to circumvent
macro disruptions.

                                                           Food & Beverage Manufacturers
                                                           and Processors    MODERATE

                                               Food & Beverage manufacturers and processors are exposed to labor shortages and
                                               volatility in raw materials supply. To counter virus-induced challenges, companies
                                               have implemented stringent sanitation and social distancing procedures within
                                               production facilities to ensure employee safety. However, manufacturing operations
                                               are at-risk given high employee headcounts, and signs of illness in the workforce will
                                               drive the short-term closure of facilities. Smithfield Foods, Campbell Soup Company,
                                               and Tyson Foods are among the processors to recently experience these issues.
                                               However, the large scale of their operations and ability to adapt have mitigated any
                                               macro disruptions.
                                               Companies such as Tyson Foods, General Mills, Nestle, and Kraft Heinz are
                                               supporting employees by offering additional compensation, waived healthcare fees,
                                               cash bonuses, financial support, and childcare services.

8          THE CORONAVIRUS IMPACT: INSIGHTS & TAKEAWAYS                                                     www.globalma.com
Food & Beverage Industry Insights

                  Food Distribution                             POSITIVE /         NEGATIVE

  The Food Distribution sector has been effected both positively and
  negatively as it relates to the COVID-19 outbreak. Distributors servicing
  the off-premise channel are thriving, while those supplying on-premise
  are challenged in the current environment.
  Quarantine orders have forced the short-term closure of all “non-
  essential” businesses, and reduced foot traffic has had a staggering
  impact on small businesses, hospitality, and national restaurant chains.
  Further, stay-at-home orders are rapidly shifting purchasing methods
  from brick-and-mortar retail to home delivery. Demand for grocery
  pickup and delivery services has soared as consumers look to limit
  personal contact touch points and in-store visits. Also, meal-kit
  companies are thriving as consumers transition to preparing and
  consuming meals at home. Large retailers, including Kroger, Aldi, and
  Tesco are quickly pivoting to eCommerce models for home delivery and
  curbside “to go.” For example, Kroger is launching a payment capability across its 2,800 store footprint to allow more
  customers access to fresh, affordable food and essential products through its online pickup service.
  Distributors will have to focus on rebalancing their customer mix and seek ways to offset their declining on-premise
  business in the near-term. This may involve rationalized SKU mix with their suppliers and retail partners, or redefining their
  customer base. Although, traditionally a business-to-business sale, distributors may find ways to sell online with home
  delivery or in-person out of company warehouses.

                Food Retailers and Foodservice
                      POSITIVE /          NEGATIVE

                                                                              The Food Retail and Foodservice industry is comprised of millions
                                                                              of small businesses, and their survival is critical to long-term
                                                                              economic prosperity. The CARES Act was enacted to aid this
                                                                              industry and its workforce. Food retailers and foodservice outlets
                                                                              are impacted in the supply chain very differently. Food retailers
                                                                              are seeing robust demand for shelf-stable, non-perishable
                                                                              products as consumers worry about the future, while a large
                                                                              portion of foodservice outlets are temporarily shut down and at-
                                                                              risk for permanent closure.
                                                                              Restaurants are being forced to rethink their menus to focus
                                                                              exclusively on takeout and delivery in the near-term. Drive-thru
                                                                              and to-go orders have become vital for survival and success. In
                                                                              some instances, restaurants have pivoted to selling food items,
similar to grocery stores and meal kit companies, in a takeout format whereby the customer can cook the products and make
the meals at home. These dynamics have led restaurant operators to reconsider their menu offerings in a reduced foot traffic
environment, while optimizing labor and overhead costs to preserve margins. According to the National Restaurant
Association, U.S.-based restaurants lost more than $30 billion in March and are projected to lose over $240 billion by the end
of the year.
Food retailers are prioritizing center-of-the-store merchandising and product sets as consumers gravitate toward familiar,
shelf-stable brands in the near-term. In addition, many are enhancing or implementing eCommerce platforms to include
third-party home delivery services. According to Emarsys and GoodData, the number of orders for web-only online retailers
increased by 52% year-over-year in the United States and Canada from March 22 to April 4.

  Source: Emarsys, GoodData, National Restaurant Association, Food Business News

  9           THE CORONAVIRUS IMPACT: INSIGHTS & TAKEAWAYS                                                                   www.globalma.com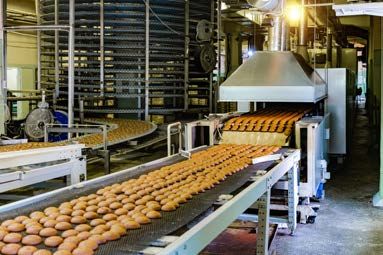
Food & Beverage Industry Insights

                  Major Food & Beverage Players: Impact and Mitigation
                       Short-Term Capital Markets Impact Disparity
                   COVID-19 has negatively impacted the trading performance of public Food & Beverage companies. Share price volatility
                   for selected companies is illustrated below, highlighting the significant disparity between on- and off-premise business
                   focus.

                  175.00%

                  150.00%         Off-Premise Focus
                  125.00%

                  100.00%
                                                                                                                                                                                     81.1%

                   75.00%                                                                                                                                                            27.9%
Relative Change

                   50.00%                                                                                                                                                            14.6%
                   25.00%                                                                                                                                                            -1.6%
                       0.00%
                                                                                                                                                                                     -8.5%
                   -25.00%
                                                                                                                                                                                     -10.8%
                   -50.00%
                                                                                                                                                                                     -40.5%
                   -75.00%        On-Premise Focus
                                                                                                                                                                                     -45.7%
                  -100.00%

                                              Blue Apron Holdings, Inc. (NYSE:APRN) - Share Pricing         Amazon.com, Inc. (NasdaqGS:AMZN) - Share Pricing
                                              The Kroger Co. (NYSE:KR) - Share Pricing                      Darden Restaurants, Inc. (NYSE:DRI) - Share Pricing
                                              The Kraft Heinz Company (NasdaqGS:KHC) - Share Pricing        Nestlé S.A. (SWX:NESN) - Share Pricing
                                              Marriott International, Inc. (NasdaqGS:MAR) - Share Pricing   Grubhub Inc. (NYSE:GRUB) - Share Pricing

                       Recent Company-Specific Updates
                   Manufacturers of non-perishable and shelf-stable food products are performing well as consumers in virus-affected
                   regions have stockpiled on long-lasting food items. In addition, food consumption has shifted away from restaurants to
                   at-home, which is forcing companies to emphasize online grocery and food delivery models.

                                         Campbell Soup Company’s Meals & Beverages segment rose +366% year-over-year for week
                                         ending March 21. Soup consumption was up nearly +60% as consumers stockpiled for
                                         lockdowns. Consumption of Prego sauce brand was up +52.9% over the same period. The
                                         company is keeping a close watch on factory labor, which has not been a major disruption within
                                         the its supply chain.

                                         Conagra Brands reported “extraordinary levels” of retail demand in its FQ3 2020 earnings call,
                                         indicating material gains are enough to offset significant declines in the Foodservice segment.
                                         Supply chain disruption has been minimal, and the company is able to meet the increased
                                         demand. COVID-19 is driving rapid, broad-based increases in at-home consumption, with Retail
                                         sales for the four-weeks ended March 22 up +47% over a year ago. The company expects to
                                         exceed prior full-year guidance for total-company sales and profit metrics, assuming no supply
                                         issues, according to an investor presentation.

     Source: S&P CapIQ as of 22 April 2020

                  10           THE CORONAVIRUS IMPACT: INSIGHTS & TAKEAWAYS                                                                                       www.globalma.com
Food & Beverage Industry Insights
Keurig Dr. Pepper (KDP) mobilized an executive task force that meets daily to review and
respond to daily changes resulting from COVID-19. Sales and operations meetings were
escalated to daily (from weekly) in order to stay ahead of demand changes. With more than 80
percent of the company’s 26,000 employees on the front-line in plants, warehouses, and
restocking, KDP stated its highest priority is employee health and safety.
KDP is seeing spikes in demand with accelerated growth in nearly every segment. Dollar
consumption for the overall beverage category is up +19%, according to IRI data for the four-
week period ending March 22, and KDP’s sales are in-line with those metrics. By channel, food is
up +53%, and the eCommerce business is “booming”. KDP anticipates the majority of demand
impact from COVID-19 in Q2 2020, citing structural change with expanded consumption overall,
and particularly in the coffee category with the shift to in-home consumption.
All of Kraft Heinz’s U.S. factories are currently operating 24/7 to meet demand spikes.
According to Mitch Arends, senior vice president of operations and manufacturing, “the
company has experienced no issues with its ingredients or supply chain and is prepared to meet
exponential demand while also being configured for maintaining social distancing measures”.
Sales are seeing a boost from increased retail product demand. To adapt to changing purchasing
methods, the company introduced an online delivery service in the UK to encourage customers
to buy its canned items. The company’s Heinz-to-Home service caters to people in self-isolation
by delivering ordered food within three days.
KraftHeinz is projecting growth in net sales and organic net sales of +3% and +6%, respectively,
in Q1 2020. Factors such as additional expenses to meet the accelerated growth and declining
foodservice sales are expected to negatively impact quarterly earnings. In support of the fight
against COVID-19, Kraft Heinz announced in March that it would donate $12 million to fight
food deficiencies globally.
The Kroger Co. saw identical-store sales surge +30% in March, citing broad-based increased
demand across grocery and some fresh departments. Consumer demand spiked for items such
as sanitizer, cleaning products, water, paper goods, boxed meals, and health-related products in
response to mandated quarantines. The company characterized consumer shopping behavior in
three phases: (1) stockpiling; (2) heightened demand as consumers adapt to travel and dining
restrictions and at-home office and schooling; and (3) to-be-determined “new normal” which will
have some lasting impacts.
To aid its employees during the COVID-19 pandemic, the company recently announced a “hero
bonus” for all hourly frontline grocery, supply chain, manufacturing, pharmacy, and call center
associates, plus extended benefits and support amid the health crisis. Further, Kroger has on-
boarded more than 32,000 new associates under an expanded hiring program, including workers
from the hard-hit restaurant, hotel, and foodservice distribution sectors
In April, Kroger and the United Food and Commercial Workers International Union (UFCW),
jointly issued a statement urging national and state leaders to grant temporary designation of
first responder or emergency personnel status for all frontline grocery workers, ensuring priority
access to protection equipment. The request is in an effort to protect employees, customers, and
the nation's food supply.
11 THE CORONAVIRUS IMPACT: INSIGHTS & TAKEAWAYS www.globalma.comFood & Beverage Industry Insights
McDonald’s Corporation has initiated its plans to adapt and continue to serve customers with
increased focus where it is safe to do so. Approximately 75% of restaurants are operational
worldwide, albeit through drive-thru, delivery, and/or takeout. Systemwide, 99% of U.S. stores
and 45% of international stores are running. Nearly all (about 98%) of China stores have
resumed operations. To offset reduced on-premise traffic, McDonald’s introduced promotions
including zero delivery fees through Uber Eats and Door Dash. McDonald’s reported a -22.2%
drop in same-store sales year-over-year in Q2 2020, citing store closures and shutdowns in
global markets as drivers, with U.S. and international sales down -13.4% and -34.7%,
respectively.
The company is coming to the aid of local communities in need, announcing it has donated $3.1
million dollars equating to nearly 3 million total pounds of food, including dairy, beef, produce,
fruit, and bakery items. In addition, senior corporate executives including the CEO and CFO
elected to take salary reductions. The company announced it is cutting capital expenditures by
$1 billion in 2020 with reduced investment in store remodels and openings.
Nestle speaks to a “robust” U.S. supply chain since the COVID-19 outbreak, and the company
“…has been well equipped to meet increased demand across all its categories,” according to
Nestle USA CEO Steve Presley, reported Food Business News. Frozen foods such as Stouffer’s
entrees and frozen pizza are seeing a lift in sales, while Toll House and Carnation brands are
gaining traction as more families take to baking amid lockdowns.
The company has extended benefits to employees impacted by the virus, including full salaries
to those affected by work stoppages, cash advances or loans, and paid sick leave.
Nestle has contributed to several charitable organizations including the International Federation
of the Red Cross and Red Crescent Societies by providing CHF 10 million in emergency relief;
Meals on Wheels; Feeding America, for which it has supplied more than two million meals; and
local groups such as food banks, schools, crisis relief agencies, and animal shelters.
Starbucks anticipates a $400 - $430 million drop in revenue in Q2 2020 due to COVID-19. As a
brick-and-mortar retailer, the company’s business model is affected by store closures and social
distancing measures. In January, Starbucks temporarily closed more than half of its 4,100 stores
located in China. As of April, more than 95% of those stores have been reopened, albeit with
modified hours and reduced seating. In March, Starbucks USA suspended its café seating and
moved towards a “to-go” format. Approximately 60% of U.S. stores are now offering a drive-
thru service. The company has also partnered with Uber Eats to offer delivery in 49 states.
Due to the temporary closing of thousands of domestic stores, Starbucks has offered COVID-19
benefits for its U.S. employees, which includes hourly wage increases and catastrophe pay for
employees unable to work through the end of May.
Starbucks has committed over $10 million in COVID-19 relief for partners around the world. The
company has set up a Global Partner Emergency Relief Program to support an existing Caring
United Partners Fund, and to partners in Europe through the Starbucks EMEA Partner Relief
Fund.
12 THE CORONAVIRUS IMPACT: INSIGHTS & TAKEAWAYS www.globalma.comFood & Beverage Industry Insights
Mitigation Measures that will Define Future Trends
COVID-19 has compelled Food & Beverage players to rethink their operations and adapt to rapidly-changing short-term
market challenges. Restrictions on the movement of people and goods has significantly changed purchasing behavior for
an uncertain period of time. Labor shortages have been a major cause of concern, from farms and production floors to
retail outlets and deliveries, and a limited number of truck drivers has also put a strain on the supply chain.
Altering Product Mix
Consumers are trying new national brands at rates of 10% to 20% and new private label brands at rates of
15% to 20%, which have caught the attention of major food manufacturers as they report demand spikes
in certain food products, requiring them to revisit order fulfilment with limited resources. Convenience
foods manufacturer Greencore, which supplies Heinz and produces its own line of products for major food
retailers, reduced its product range to focus on restocking stores. The company has concentrated on core
product types that are easier for customers to distribute and merchandise in stores while being fully-
stocked.
Cross-Segment Collaborations
Companies have been forging partnerships to leverage resources and widen consumer reach. Select
players with broad distribution capabilities are expanding their product range to include basic pantry
staples, groceries, and cleaning products. For example, McDonald’s began selling milk and bread in
Australia, while Domino’s partnered with ITC Foods to delivery pantry essentials in India.
Global to Local Sourcing
Disruption in the supply chain, particularly border closures, have prompted many companies to consider
alternate sourcing options to ensure continuous flow and accessibility of supplies, often turning to local
suppliers for support. For example, French supermarket chain Carrefour has shifted the sourcing of 95% of
its fruits and vegetables from within France. Ultimately, this trend aligns with consumer demand for
supply chain transparency and reliability as it pertains to food safety and is expected to remain in place.
Shifting Focus from Foodservice to Food Retail
Uncertainty is shifting attention away from Foodservice to Food Retail, which has implications for the
entire supply chain. Negative consumer sentiment towards on-premise consumption is likely to persist
post-crisis. Food retailers will continue to adopt and expand delivery and curbside pick-up options.
Foodservice outlets will focus on reducing labor and overhead, while continually reformulating “to-go”
designed menu offerings. Companies involved in agribusiness/livestock, logistics, manufacturing, and
distribution will jockey to acquire the customer base.
Adapting to Shifting Purchasing Habits
The COVID-19 crisis has forced companies to adapt to a new environment of social distancing which has
altered the way consumers purchase packaged goods. Whether this shift becomes the “new normal” over
the long-term is yet to be determined. In any case, the situation has escalated the need for companies to
pursue omni-channel and direct-to-consumer strategies sooner than many anticipated. Effective
utilization of third-party delivery partners and development of eCommerce platforms may be defining
factors as to which brands thrive or falter in the short-term.
13 THE CORONAVIRUS IMPACT: INSIGHTS & TAKEAWAYS www.globalma.comFood & Beverage Industry Insights
Critical Takeaways for Food & Beverage
Labor shortages and social distancing will impact every sector of the
supply chain and companies will find ways to adapt to a new normal
Supply chain disruptions will prompt a shift from global to local
sourcing
Plant closures and slowdowns will challenge agribusiness and raw
material procurement
Shelf-stable and packaged food products will gain favor amid
quarantines
Private label brands will accelerate
Food innovation will be stymied in the short-term as emerging
brands will struggle to gain traction with large food retailers
Distributors will be forced to quickly adapt as demand shifts from
foodservice to food retail, even prompting direct sales
Restaurant and hospitality operators will expand and invest in new
and improved delivery and curbside services
Consumer purchasing will rapidly shift from brick-and-mortar to
delivery and eCommerce, forcing brands to elevate omni-channel
and direct sales channel strategies
Consumers will prioritize “clean packaging”, reliability, and supply
chain transparency in future purchasing behavior
Change in Consumer Spending Habits:
EXPECTED INCREASE EXPECTED DECREASE
• Shelf-stable food • Hospitality
• Packaged food • Emerging brands
• Frozen food • Restaurant / Foodservice
• Snack food • Sustainability-based food choices
• Alcoholic beverages • Seasonal / exotic fruit and vegetables
• Private label products
14 THE CORONAVIRUS IMPACT: INSIGHTS & TAKEAWAYS www.globalma.comRoad to Recovery
Near-Term Effects on the
M&A Market
Mergers & Acquisitions (M&A) in a Time of COVID-19
COVID-19 is affecting the financial health and operating performance of sellers, while simultaneously impacting how
buyers strategize, target, and ultimately value transactions. As short-term deal tactics emerge, fundamental shifts in deal
strategies and valuation will soon follow. Market volatility has prompted buyers and sellers to further scrutinize strategic
priorities in the near-term. Buyers are seeking deal protection mechanisms in transaction negotiations to hedge short-
term operational risk. Parties currently negotiating Definitive Purchase Agreements are revisiting contract terms,
including representations and warranties and any “material adverse change” clauses, to assess the potential impacts of
the coronavirus-crisis on their transactions.
While some strategic and financial investors are adopting a wait-and-see approach to deal-making, the market continues
to present acquisition opportunities, and buyers are proceeding with caution.
Strategic Buyers
Stock prices of most publicly-traded companies have seen significant declines in recent weeks, leading to
significant lost in deal currency. As a result, large-cap buyers are expected to slow the pace of M&A over
the near-term and may revisit the consideration mix of cash versus stock. However, as the market
recovers and companies begin strategizing to strengthen competitive positioning, new initiatives are
expected to gain focus with opportunities arising on various fronts, including:
• Optimizing supply chains Supply and distribution channels
• Expanding online presence eCommerce solutions
• Consumer adoption and retention Healthy, better-for-you products
Financial Buyers
Most private equity firms are primarily focusing internally on existing portfolio companies rather than
sourcing new deals. However, opportunistic private equity investors will likely see today’s environment as
a buying opportunity, disrupting what had been a long and frothy seller’s market. They will seek
undervalued assets as bolt-on acquisitions for current investments and new growth platforms at more
reasonable valuations.
In addition, an emergence of struggling companies and restructuring opportunities are expected, with
private equity sponsors ideal partners to facilitate these transactions. The safety of the Food & Beverage
industry has been a draw during challenging periods, while growth potential provides upside for cash-rich
financial investors sitting on dry powder.
The credit markets remain open; however, lenders are approaching transactions with a greater degree of
conservatism due to market uncertainty. Asset selectivity is higher, and pricing and leverage reflect more
downside protection. Pricing spreads have increased by an additional 100-200 basis points or more
depending on asset quality, and lenders are instituting Libor floors of 1 to 2 percent to compensate for
increased market risk. Total leverage has held constant or contracted by as much as a ½ turn of EBITDA.
Equity contribution has increased from 40 to 50 percent, on average, to 50 or 60 percent. We expect these
trends to ease as we come out of the crisis. Bank balance sheets are healthy, and private debt funds are
plentiful and eager to invest capital.
15 THE CORONAVIRUS IMPACT: INSIGHTS & TAKEAWAYS www.globalma.comNear-Term Effects on the M&A Market
Mergers & Acquisitions (M&A) in a Time of COVID-19
Critical Takeaways for Food & Beverage M&A
Food & Beverage assets will likely be viewed as a “flight to
safety” for companies serving the off-premise and direct-to-
consumer channels
Financial performance during the crisis will be highly
scrutinized, and bid versus ask spreads on valuations will be
highly negotiated to arrive at “normalized” earnings
Near-Term:
• Overall disruptive Strategic buyers may prioritize crisis mitigation and operational
effect on Food & performance over M&A in the short-term as they look to
Beverage M&A, with strengthen balance sheets and adapt to new realities
varying degrees of
investor confidence
and appetite, Private equity and venture capital investors will likely “raise the
depending on bar” on investment criteria in the short-term as they evaluate
exposure to on- leveraged buyouts and equity investments
premise
Capital raising for small, niche brands will likely be hindered in
Long-Term: the short-term as route-to-market and merchandising is being
• The outlook for Food dominated by larger brands
& Beverage M&A
continues to be The financing markets are selectively open for high-quality
optimistic and is
expected to return to
assets, with Food & Beverage likely to be more “in-favor” in
normal pre- terms of lender risk appetite
pandemic levels
Borrowing cost has increased to compensate lenders in the
uncertain economic climate. Pricing and leverage reflect a
premium for increased market risk, which we expect will loosen
as the economy begins to show sustained recovery
16 THE CORONAVIRUS IMPACT: INSIGHTS & TAKEAWAYS www.globalma.comPeer Valuation & Trading
Analysis
Public Company Valuation & Operating Metrics
Margin (%) EV/
EBITDA EBIT Sales (x) EBITDA (x) EBIT (x)
Mkt Cap EV
Company Name LTM LTM LTM LTM LTM
($mn) ($mn)
Agricultural Products
Wilmar International Limited 14,978 30,990 6.3% 4.4% 0.73x 11.5x 16.4x
Archer-Daniels-Midland Company 19,725 28,865 4.0% 2.5% 0.45x 11.2x 18.2x
Bunge Limited 5,373 11,613 3.6% 2.3% 0.28x 7.8x 12.4x
Sime Darby Plantation Berhad 7,502 9,307 13.4% 3.3% 3.16x 23.6x NM
Kuala Lumpur Kepong Berhad 5,047 6,375 10.5% 6.8% 1.68x 16.0x 24.6x
Yuan Long Ping High-Tech Agriculture 3,200 4,006 1.3% NM 9.06x NM NM
Heilongjiang Agriculture Company Limited 4,199 3,826 36.9% 30.2% 8.56x 23.2x 28.3x
KWS SAAT SE & Co. KGaA 1,795 2,479 13.3% 8.0% 1.91x 14.4x 23.9x
Vilmorin & Cie SA 910 2,451 8.6% 6.1% 1.54x 17.8x 25.1x
Fresh Del Monte Produce Inc. 1,508 2,307 4.5% 2.3% 0.51x 11.4x 22.1x
Sakata Seed Corporation 1,452 1,331 15.3% 12.0% 2.30x 15.0x 19.1x
SLC Agrícola S.A. 860 1,197 26.2% 22.0% 1.90x 7.2x 8.6x
Hortifrut S.A. 637 1,094 16.8% 7.7% 1.90x 11.3x 24.6x
B.F. S.p.A. 681 644 2.6% NM 6.84x NM NM
Mean 11.7% 9.0% 2.92x 14.2x 20.3x
Median 9.6% 6.5% 1.90x 13.0x 22.1x
Beverages
The Coca-Cola Company 196,150 230,553 32.6% 28.6% 6.20x 19.1x 21.7x
PepsiCo, Inc. 184,241 212,213 18.7% 16.0% 3.16x 16.9x 19.8x
Anheuser-Busch InBev SA/NV 81,841 182,738 38.1% 30.9% 3.49x 9.2x 11.3x
Diageo plc 76,462 94,597 34.1% 31.7% 5.43x 15.9x 17.1x
Heineken N.V. 46,732 64,489 21.8% 15.3% 2.40x 11.0x 15.7x
Keurig Dr Pepper Inc. 37,341 52,491 30.4% 24.1% 4.72x 15.5x 19.6x
Pernod Ricard SA 38,854 48,014 31.8% 28.8% 4.52x 14.2x 15.7x
Constellation Brands, Inc. 29,656 42,663 36.4% 32.6% 5.11x 14.0x 15.7x
Ambev S.A. 33,901 32,496 38.4% 31.1% 2.48x 6.5x 8.0x
Monster Beverage Corporation 31,656 30,355 35.2% 33.7% 7.23x 20.5x 21.5x
Asahi Group Holdings, Ltd. 14,875 23,190 15.2% 9.8% 1.21x 7.9x 12.3x
Source: S&P CapIQ as of 22 April 2020
17 THE CORONAVIRUS IMPACT: INSIGHTS & TAKEAWAYS www.globalma.comPeer Valuation & Trading Analysis
Margin (%) EV/
EBITDA EBIT Sales (x) EBITDA (x) EBIT (x)
Mkt Cap EV
Company Name LTM LTM LTM LTM LTM
($mn) ($mn)
Beverages
Carlsberg A/S 17,689 20,935 21.5% 15.3% 2.12x 9.8x 13.9x
Thai Beverage Public Company Limited 12,139 19,113 15.3% 12.8% 2.10x 13.8x 16.4x
Molson Coors Beverage Company 9,173 18,219 22.0% 14.2% 1.72x 7.8x 12.1x
China Resources Beer (Holdings) Company 15,027 14,802 14.3% 9.4% 3.11x 21.8x 32.9x
Suntory Beverage & Food Limited 11,747 13,090 14.8% 9.3% 1.09x 7.4x 11.7x
Davide Campari-Milano S.p.A. 8,278 9,131 24.4% 21.9% 4.42x 18.1x 20.2x
Arca Continental, S.A.B. de C.V. 6,583 9,059 17.7% 12.7% 1.04x 5.8x 8.1x
Tsingtao Brewery Company Limited 8,300 6,024 9.4% 5.6% 1.50x 15.9x 26.7x
The Boston Beer Company, Inc. 5,130 5,155 17.0% 12.5% 4.12x 24.3x 33.1x
Royal Unibrew A/S 3,356 3,751 23.5% 19.1% 3.25x 13.8x 17.0x
United Breweries Limited 3,198 3,243 13.5% 9.6% 3.44x 25.5x 35.7x
Emperador Inc. 2,500 3,136 21.4% 18.9% 3.23x 15.1x 17.1x
Britvic plc 2,355 3,107 14.5% 10.4% 1.63x 11.3x 15.6x
Fraser & Neave Holdings Bhd 2,573 2,479 15.0% 12.6% 2.43x 16.2x 19.3x
National Beverage Corp. 2,248 2,029 17.4% 15.7% 2.07x 11.9x 13.2x
Lotte Chilsung Beverage Co.,Ltd. 654 1,729 11.2% 4.4% 0.82x 7.4x 18.5x
C&C Group plc 728 1,109 7.9% 6.6% 0.60x 7.6x 9.2x
Mean 21.9% 17.6% 3.02x 13.7x 17.8x
Median 20.1% 15.3% 2.79x 13.9x 16.7x
Food Ingredients
DuPont de Nemours, Inc. 29,256 46,286 24.1% 14.5% 2.15x 8.9x 14.9x
Givaudan SA 31,513 35,317 19.4% 15.0% 5.51x 28.5x 36.7x
Archer-Daniels-Midland Company 19,725 28,865 4.0% 2.5% 0.45x 11.2x 18.2x
McCormick & Company, Incorporated 20,370 24,787 21.3% 18.6% 4.65x 21.8x 25.0x
Koninklijke DSM N.V. 21,054 22,434 15.4% 9.9% 2.22x 14.4x 22.5x
Kerry Group plc 19,954 22,180 14.7% 11.5% 2.73x 18.6x 23.7x
Associated British Foods plc 18,667 22,167 13.1% 8.5% 1.09x 8.3x 12.9x
Otsuka Holdings Co., Ltd. 21,410 20,932 17.8% 12.4% 1.63x 9.2x 13.2x
International Flavors & Fragrances Inc. 13,273 17,456 21.6% 15.4% 3.40x 15.7x 22.1x
Symrise AG 14,178 15,978 20.4% 13.8% 4.18x 20.5x 30.3x
Chr. Hansen Holding A/S 11,220 12,174 34.4% 29.5% 9.42x 27.4x 31.9x
Bunge Limited 5,373 11,613 3.6% 2.3% 0.28x 7.8x 12.4x
Ingredion Incorporated 5,186 6,948 14.6% 11.2% 1.12x 7.7x 10.0x
Darling Ingredients Inc. 3,046 4,829 12.1% 2.4% 1.44x 11.8x NM
Angel Yeast Co., Ltd 4,387 4,741 21.2% 15.3% 4.26x 20.1x 27.8x
AAK AB (publ.) 4,342 4,714 9.6% 7.5% 1.54x 16.2x 20.6x
Tate & Lyle plc 3,917 4,450 17.0% 10.9% 1.27x 7.5x 11.6x
Corbion N.V. 1,723 2,052 13.7% 8.7% 1.87x 13.7x 21.5x
Mean 16.6% 11.7% 2.73x 15.0x 20.9x
Median 16.2% 11.4% 2.01x 14.1x 21.5x
Source: S&P CapIQ as of 22 April 2020
18 THE CORONAVIRUS IMPACT: INSIGHTS & TAKEAWAYS www.globalma.comPeer Valuation & Trading Analysis
Margin (%) EV/
EBITDA EBIT Sales (x) EBITDA (x) EBIT (x)
Mkt Cap EV
Company Name LTM LTM LTM LTM LTM
($mn) ($mn)
Food Processing
Nestlé S.A. 314,947 343,742 20.1% 17.1% 3.58x 17.8x 20.9x
Mondelez International, Inc. 74,659 92,622 20.5% 16.4% 3.58x 17.5x 21.8x
The Kraft Heinz Company 35,138 62,830 26.3% 22.3% 2.52x 9.6x 11.3x
Danone S.A. 43,817 58,160 20.6% 15.8% 2.05x 9.9x 13.0x
General Mills, Inc. 36,484 50,739 21.7% 18.1% 3.03x 13.9x 16.7x
The Hershey Company 30,053 34,045 24.7% 21.0% 4.26x 17.3x 20.3x
Tyson Foods, Inc. 21,873 33,769 9.6% 6.9% 0.78x 8.2x 11.3x
Kellogg Company 22,153 30,798 16.0% 12.4% 2.27x 14.2x 18.3x
Conagra Brands, Inc. 16,707 26,970 19.7% 16.3% 2.60x 13.2x 16.0x
Hormel Foods Corporation 26,028 25,673 13.6% 11.7% 2.70x 19.9x 22.9x
Associated British Foods plc 18,667 22,167 13.1% 8.5% 1.09x 8.3x 12.9x
Campbell Soup Company 15,329 21,360 17.9% 14.4% 2.64x 14.8x 18.4x
JBS S.A. 10,774 20,523 8.9% 6.5% 0.40x 4.5x 6.2x
The J. M. Smucker Company 13,520 19,189 21.4% 15.5% 2.52x 11.8x 16.2x
WH Group Limited 14,550 17,892 9.2% 7.3% 0.74x 8.1x 10.2x
China Mengniu Dairy Company Limited 13,762 14,050 7.0% 4.7% 1.24x 17.7x 26.1x
Saputo Inc. 10,105 13,092 9.5% 7.1% 1.17x 12.4x 16.5x
Barry Callebaut AG 10,835 12,884 10.6% 8.3% 1.69x 15.8x 20.2x
Lamb Weston Holdings, Inc. 8,226 10,624 21.6% 17.2% 2.69x 12.4x 15.7x
Grupo Bimbo, S.A.B. de C.V. 6,091 10,598 12.7% 9.2% 0.68x 5.4x 7.4x
Britannia Industries Limited 9,286 9,361 15.8% 14.3% 5.79x 36.7x 40.4x
Kikkoman Corporation 8,242 8,405 11.3% 8.4% 1.96x 17.4x 23.2x
Want Want China Holdings Limited 8,779 7,916 27.1% 23.1% 2.72x 10.1x 11.8x
Marfrig Global Foods S.A. 1,343 4,371 9.2% 7.0% 0.36x 3.9x 5.1x
Grupo Nutresa S. A. 2,559 3,463 11.8% 9.1% 1.14x 9.7x 12.5x
Grupo Herdez, S.A.B. de C.V. 453 1,138 15.1% 12.9% 0.96x 6.3x 7.4x
Watt's S.A. 350 536 9.7% 6.7% 0.91x 9.4x 13.7x
Mean 15.7% 12.5% 2.08x 12.8x 16.2x
Median 15.1% 12.4% 2.05x 12.4x 16.0x
Food Retail and Restaurants
Costco Wholesale Corporation 136,634 137,079 4.1% 3.1% 0.87x 21.2x 27.9x
Alimentation Couche-Tard Inc. 32,136 38,976 6.3% 4.8% 0.68x 10.7x 14.2x
Carrefour SA 11,916 27,704 4.7% 2.8% 0.33x 7.1x 11.9x
Chipotle Mexican Grill, Inc. 24,416 26,477 11.6% 7.8% 4.65x NM NM
Haidilao International Holding Ltd. 22,362 22,519 14.4% 11.8% 5.90x NM NM
CP ALL Public Company Limited 18,338 22,353 7.7% 5.8% 1.17x 15.2x 20.1x
Casino, Guichard-Perrachon SA 4,172 19,626 4.7% 3.2% 0.50x 10.4x 15.6x
Avenue Supermarts Limited 19,424 19,521 8.5% 7.4% 5.87x NM NM
Domino's Pizza, Inc. 14,977 19,137 18.5% 17.4% 5.29x 28.6x 30.3x
Source: S&P CapIQ as of 22 April 2020
19 THE CORONAVIRUS IMPACT: INSIGHTS & TAKEAWAYS www.globalma.comPeer Valuation & Trading Analysis
Margin (%) EV/
EBITDA EBIT Sales (x) EBITDA (x) EBIT (x)
Mkt Cap EV
Company Name LTM LTM LTM LTM LTM
($mn) ($mn)
Food Retail and Restaurants
Darden Restaurants, Inc. 8,791 14,226 12.1% 8.4% 1.62x 13.4x 19.3x
Aramark 5,815 13,184 8.3% 4.9% 0.81x 9.8x 16.6x
Empire Company Limited 6,457 10,989 5.3% 3.9% 0.56x 10.6x 14.6x
Dunkin' Brands Group, Inc. 4,835 7,673 34.8% 31.7% 5.60x 16.1x 17.7x
BJ's Wholesale Club Holdings, Inc. 3,558 7,374 4.0% 2.8% 0.56x 14.0x 20.0x
Casey's General Stores, Inc. 5,661 7,006 7.0% 4.1% 0.83x 11.7x 20.2x
BIM Birlesik Magazalar A.S. 4,779 5,153 6.3% 5.2% 0.76x 12.1x 14.6x
Jollibee Foods Corporation 2,902 3,351 6.8% 3.3% 1.03x 15.1x 31.5x
Cracker Barrel Old Country Store, Inc. 2,164 3,075 12.9% 9.2% 0.99x 7.6x 10.7x
BGF retail CO., LTD. 2,050 2,060 8.9% 3.3% 0.40x 4.5x 12.1x
Elior Group S.A. 1,183 1,775 5.8% 3.2% 0.33x 5.7x 10.3x
Grupo Gigante, S. A. B. de C. V. 874 1,456 11.2% 8.5% 0.85x 7.6x 9.9x
Mean 9.7% 7.3% 1.89x 12.3x 17.6x
Median 7.7% 4.9% 0.85x 11.2x 16.1x
Food Distribution
Sysco Corporation 26,112 35,163 5.7% 4.5% 0.58x 10.3x 13.0x
US Foods Holding Corp. 4,083 9,122 4.3% 2.9% 0.35x 8.1x 12.0x
United Natural Foods, Inc. 642 4,792 2.0% 0.8% 0.20x 10.0x 25.9x
The SPAR Group Ltd 1,835 2,144 3.3% 2.7% 0.30x 8.9x 10.9x
Metcash Limited 1,459 2,097 3.0% 2.8% 0.24x 7.8x 8.6x
Core-Mark Holding Company, Inc. 1,263 1,877 1.2% 0.7% 0.14x 12.2x 20.3x
SpartanNash Company 578 1,553 1.7% 0.6% 0.18x 10.9x 30.1x
MARR S.p.A. 891 1,107 7.1% 6.7% 0.60x 8.4x 8.9x
CJ Freshway Corporation 174 596 3.6% 1.8% 0.23x 6.3x 12.6x
Super Value Co., Ltd. 27 128 3.3% 2.1% 0.19x 5.9x 9.2x
AMCON Distributing Company 41 107 0.9% 0.7% 0.10x 10.7x 15.0x
ITOCHU-SHOKUHIN Co., Ltd. 510 77 1.0% 0.6% 0.01x 1.3x 2.2x
Satoh & Co., Ltd. 123 18 3.4% 2.9% 0.04x 1.1x 1.3x
Mean 3.1% 2.3% 0.24x 7.9x 13.1x
Median 3.3% 2.1% 0.20x 8.4x 12.0x
Food Tech and Digitally Native
Meituan Dianping 76,071 67,772 4.2% 0.6% 4.88x NM NM
Delivery Hero SE 15,177 14,394 NM NM 14.33x NM NM
Just Eat Takeaway.com N.V. 14,102 14,340 NM NM NM NM NM
Ocado Group plc 14,069 13,902 NM NM 6.12x NM NM
Grubhub Inc. 3,984 4,172 6.1% NM 3.18x 51.9x NM
Infomart Corporation 1,532 1,472 40.7% 28.9% 18.73x 46.1x 64.8x
Source: S&P CapIQ as of 22 April 2020
20 THE CORONAVIRUS IMPACT: INSIGHTS & TAKEAWAYS www.globalma.comPeer Valuation & Trading Analysis
Margin (%) EV/
EBITDA EBIT Sales (x) EBITDA (x) EBIT (x)
Mkt Cap EV
Company Name LTM LTM LTM LTM LTM
($mn) ($mn)
Food Tech and Digitally Native
Demae-Can Co.,Ltd 566 559 NM NM 8.22x NM NM
Oisix ra daichi Inc. 582 520 3.8% 2.4% 0.84x 22.3x 34.3x
eBase Co., Ltd. 425 401 29.4% 28.9% 9.95x 33.8x 34.4x
Blue Apron Holdings, Inc. 149 230 NM NM 0.51x NM NM
Autonomous Control Systems Laboratory 220 185 - NM NM NA NM
Goodfood Market Corp. 151 153 NM NM 0.98x NM NM
Gurunavi, Inc. 225 132 15.2% 4.7% 0.45x 3.0x 9.6x
Synchro Food Co., Ltd. 55 32 33.5% 31.1% 1.70x 5.1x 5.5x
Mean 19.0% 16.1% 5.82x 27.0x 29.7x
Median 15.2% 16.8% 4.03x 28.1x 34.3x
Overall
Mean 14.7% 11.4% 2.58x 13.6x 18.1x
Overall
Median 13.4% 9.2% 1.70x 11.8x 16.5x
Source: S&P CapIQ as of 22 April 2020
21 THE CORONAVIRUS IMPACT: INSIGHTS & TAKEAWAYS www.globalma.comPeer Valuation & Trading Analysis
Share Price Performance
The composite Food and Beverage index declined ~10.0% year-to-date, with Beverages registering the largest decline at
-19.7% major companies suffered the impact of a sell-off across all industries. All segments are gradually recovering as
operating performance improves and markets return to normal following the crisis.
120.00
3.9%
-11.7%
100.00
(Indexed to 100)
-13.0%
-13.4%
-16.5%
-16.6%
80.00
-19.7%
60.00
Jan/20 Jan/20 Feb/20 Feb/20 Mar/20 Mar/20 Apr/20
Agricultural Products Food Ingredients Food Processing
Beverages Food Retail & Restaurants Food Distribution
Food Tech & Digitally Native
Notes:
1. Agricultural Products includes Archer-Daniels-Midland Company, Wilmar International Limited, Sime Darby Plantation Berhad, Kuala Lumpur Kepong Berhad, Yuan Long
Ping High-Tech Agriculture Co., Ltd., Heilongjiang Agriculture Company Limited, KWS SAAT SE & Co. KGaA, Hortifrut S.A., Vilmorin & Cie SA, Fresh Del Monte Produce
Inc., Sakata Seed Corporation, SLC Agrícola S.A., B.F. S.p.A., Bunge Limited
2. Beverages includes The Coca-Cola Company, PepsiCo, Inc., Anheuser-Busch InBev SA/NV, Diageo plc, Ambev S.A., Heineken N.V., Pernod Ricard SA, Keurig Dr Pepper
Inc., Constellation Brands, Inc., Monster Beverage Corporation, Asahi Group Holdings, Ltd., Carlsberg A/S, Suntory Beverage & Food Limited, Molson Coors Beverage
Company, Thai Beverage Public Company Limited, China Resources Beer (Holdings) Company Limited, Davide Campari-Milano S.p.A., Arca Continental, S.A.B. de C.V.,
Tsingtao Brewery Company Limited, United Breweries Limited, National Beverage Corp., Royal Unibrew A/S, Fraser & Neave Holdings Bhd, Britvic plc, The Boston Beer
Company, Inc., Emperador Inc., C&C Group plc, Lotte Chilsung Beverage Co.,Ltd.
3. Food Ingredients includes Otsuka Holdings Co., Ltd., Givaudan SA, Kerry Group plc, McCormick & Company, Incorporated, Chr. Hansen Holding A/S, International Flavors
& Fragrances Inc., Symrise AG, Angel Yeast Co., Ltd, AAK AB (publ.), DuPont de Nemours, Inc., Associated British Foods plc, Archer-Daniels-Midland Company, Koninklijke
DSM N.V., Bunge Limited, Ingredion Incorporated, Tate & Lyle plc, Corbion N.V., Darling Ingredients Inc.
4. Food Processing includes Nestlé S.A., Mondelez International, Inc., The Kraft Heinz Company, Danone S.A., General Mills, Inc., Associated British Foods plc, Hormel Foods
Corporation, The Hershey Company, Tyson Foods, Inc., Kellogg Company, WH Group Limited, China Mengniu Dairy Company Limited, The J. M. Smucker Company,
Saputo Inc., Britannia Industries Limited, Lamb Weston Holdings, Inc., Campbell Soup Company, Conagra Brands, Inc., Kikkoman Corporation, Want Want China Holdings
Limited, Grupo Bimbo, S.A.B. de C.V., Barry Callebaut AG, JBS S.A., Grupo Nutresa S. A., Watt's S.A., Marfrig Global Foods S.A., Grupo Herdez, S.A.B. de C.V.
5. Food Retail and Restaurants includes Costco Wholesale Corporation, Alimentation Couche-Tard Inc., CP ALL Public Company Limited, Carrefour SA, Chipotle Mexican
Grill, Inc., Darden Restaurants, Inc., Avenue Supermarts Limited, Haidilao International Holding Ltd., Domino's Pizza, Inc., Aramark, Jollibee Foods Corporation, Dunkin'
Brands Group, Inc., BIM Birlesik Magazalar A.S., Casino, Guichard-Perrachon Société Anonyme, Casey's General Stores, Inc., Cracker Barrel Old Country Store, Inc., Empire
Company Limited, BJ's Wholesale Club Holdings, Inc., BGF retail CO., LTD., Elior Group S.A., Grupo Gigante, S. A. B. de C. V.
6. Food Distribution includes US Foods Holding Corp., The SPAR Group Ltd, Metcash Limited, MARR S.p.A., SpartanNash Company, ITOCHU-SHOKUHIN Co., Ltd., CJ
Freshway Corporation, Satoh & Co., Ltd., Sysco Corporation, Core-Mark Holding Company, Inc., AMCON Distributing Company, United Natural Foods, Inc., Super Value
Co., Ltd.
7. Food Tech and Digitally Native includes Meituan Dianping, Ocado Group plc, Grubhub Inc., Delivery Hero SE, Just Eat Takeaway.com N.V., Infomart Corporation, Oisix ra
daichi Inc., Demae-Can Co.,Ltd, Autonomous Control Systems Laboratory Ltd., Gurunavi, Inc., eBase Co., Ltd., Synchro Food Co., Ltd., Goodfood Market Corp., Blue Apron
Holdings, Inc.
Source: S&P CapIQ as of 22 April 2020
22 THE CORONAVIRUS IMPACT: INSIGHTS & TAKEAWAYS www.globalma.comYou can also read