Monsoon Floods 2020 Coordinated Preliminary Impact and Needs Assessment - Bangladesh Needs Assessment Working Group (NAWG) - ReliefWeb
←
→
Page content transcription
If your browser does not render page correctly, please read the page content below
Monsoon Floods 2020
Coordinated Preliminary Impact and
        Needs Assessment

    Needs Assessment Working Group (NAWG)

              Bangladesh
               Date: 25 July 2020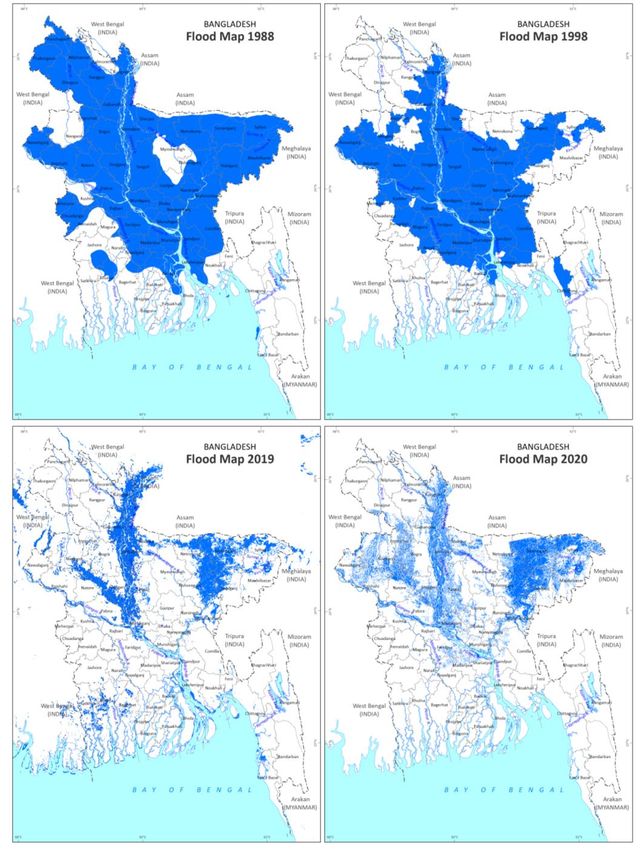
BANGLADESH
Monsoon floods 2020: Joint Needs Assessment
Monsoon Flood | July

                                    Coordinated efforts of

                                                 GONOCHETONA
                                                  DEWANGONJ

                                                   RUDO
                                                     Rural &
                                                      Urban
                                                   Development
                                                   Organization

                  Needs Assessment Working Group
About the Working Group :              The Needs Assessment Working Group (NAWG) is the platform for
government and non government humanitarian agencies under Humanitarian Coordination Task Team (HCTT).
The secretariat of the Working Group is hosted by CARE Bangladesh under the “Supporting Bangladesh Rapid
Needs Assessment (SUBARNA) Project.”

          Implemented By                     Fund Managed By                          Funded By

 Disclaimer: This material has been funded by UK aid from the UK government, however the views expressed do not
 necessarily reflect the UK government’s official policies.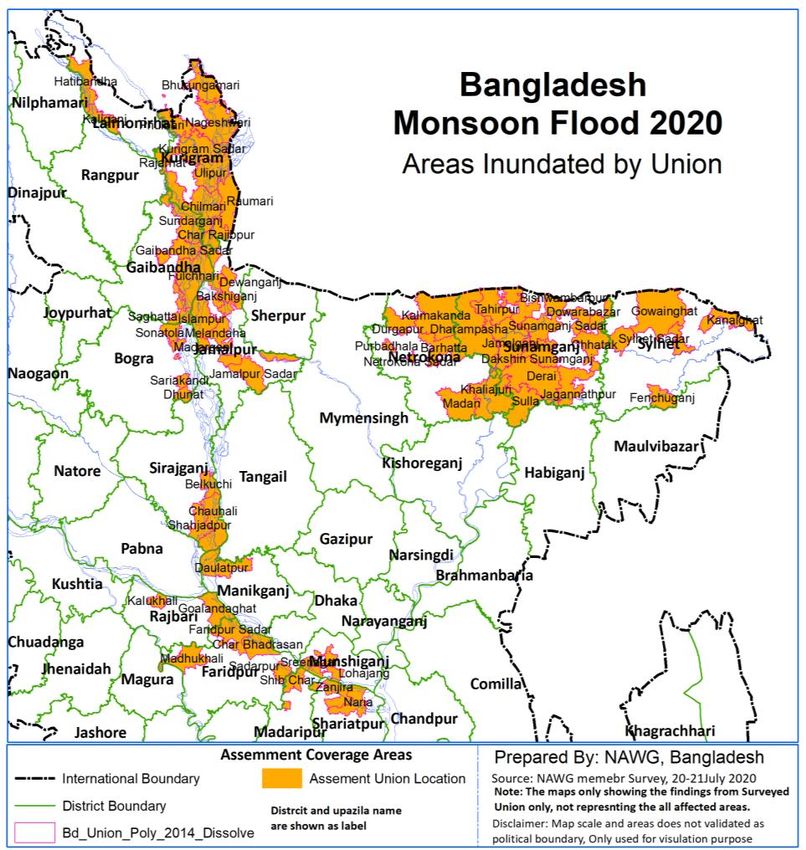
Table of Contents

                                   Topic                      Page No
   Executive Summary                                            4-5
   Key Findings                                                  6

   Sectoral Key Findings                                        7-14

   Joint Needs Assessment (JNA) Methodology                     15

   Geographical Synopsis of Monsoon Flood                      16-17
   Overall Impacts                                              18
   Overall Impact: People Affected                              19
   Geographic Scope of the Assessment                           20
   Demographic and Geographical Impacts                        21-24
   Vulnerabilities of the Affected Community                    25
   Anticipatory Action                                          26
   Priority Geographic Areas                                    27

   Sectoral Impacts and Prioritize
     -Child Protection
     -Displacement Management
     -Food Security and Livelihood
     -Integrated GBV and SRH                                   28-43
     -Health
     -Nutrition
     -Shelter
     -WASH
   Protection Concern of the Affected Community                 43
   Key Immediate Needs                                          44

   Annex 1: Government Response                                 46

   Annex 2: Humanitarian Agency Response                        47

   Annex 3: Historical major Flood event                        48

   Annex 4: Glossary and Acronyms                               49
   Annex 5: Relevant Information, Data Table and References     50
   Annex 6 : Assessment Timeline                                51
   Annex 7: Acknowledgment                                      52
   Contacts and Updates                                         56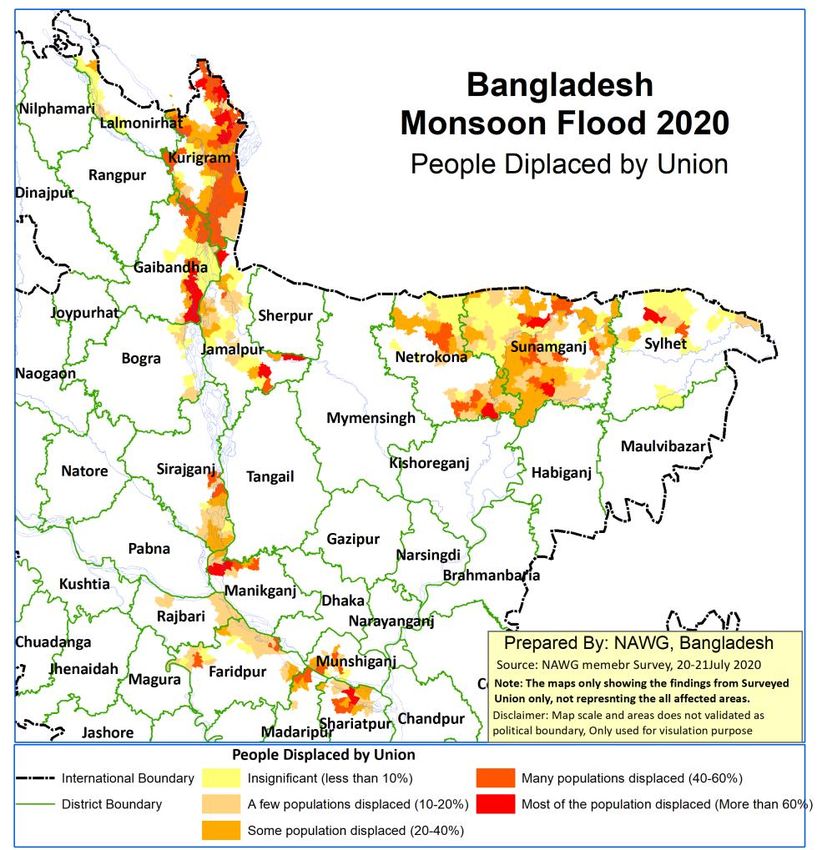
Executive Summary
The monsoon floods of the year 2020 has an overall impact on the Northern, North-Eastern and
South-Eastern region of Bangladesh. The floods has impacted 21 districts of Bangladesh with
moderate to severe impact on 16 Districts. Highest peak of the flooding was predicted to be at the
Bahadurabad point, with 71% probability of high flooding. The peak of the flood was anticipated to
hit on the 18th July 2020.
As of 22 July, 2020, 102 upazila and 654 unions have been inundated in flood, affecting 3.3 million
people and leaving 7,31,958 people water logged. 93 people has already lost their life, mostly as a
result of drowning is the major cause of the death and 41 child died due to drowning since 30th
June 2020.

The Monsoon floods coupled with prolonged inundation and the COVID-19 pandemic has an
exacerbating effect on the flood affected people. Therefore, making 2020 monsoon flood more
complex than ever; as there is an important practice of social distancing and handwashing which is
quite impossible to maintain as flood affected people are displaced and are evacuating to shelters
where it is congested and WASH facilities are also compromised.

Disruptions of the economic and social activity is high for unions with high displacement rate. As
per primary data, 24% unions have more than 40% of the people displaced, where 80% of union’s
people are staying in other places and 93% of the unions witnessed disruption in income
generating and social activities. Due to damages of shelters; many are living together which
increases the risk of COVID-19 spreading.

Many flood protection infrastructures such as dykes and embankments are already damaged from
previous monsoon floods along with the current floods. 220 unions have already reported having
their embankments damaged. The normal recovery cycle after a disaster is 3-5 years but due to
back -to- back disaster this recovery cycle is hampered. This also compromises the repair and
reconstruction of the infrastructures, which is further constrained by the COVID-19 pandemic.
Unrepaired and unmaintained infrastructures further put everything under vulnerable state for the
upcoming disasters. Therefore, making recovery a more complex but a crucial step.

Physical access to primary health care is disrupted due to restricted mobility and due to inundation
of flood and COVID-19 pandemic. The survey shows that 73% of the affected unions suffered from
disrupted health care services, therefore, increasing the risk of mortality, morbidity, lack of
nutrition (where 75 union reported compromised nutrition care) which may escalate epidemic.
Flood damage puts added distress on vulnerable (e.g. pregnant women, adolescent girls, children,
elderly people, person with disability etc.) and marginalized groups and on their safety and
security. Loss of home, restricted movement, lack of privacy, inaccessibility and disrupted services,
transportation and communication create prolonged distress on Sexual and Reproductive Health
(SRH), Gender Based Violence (GBV) and Child Protection. Primary data shows that health care
services and antenatal and neonatal care services have been disrupted in 251 (75%) and 215 (64%)
unions respectively.
Livelihood/income generating activities, functioning of local markets, crops, livestock and fisheries
have been severely affected in most of the flood affected areas causing high dependency on relief,
which leads to the possibility of increased food insecurity. As per data, 80% of the unions reported
irregular food consumption and complication in food preparation. Concern related to physical,
emotional and social suffering of the affected community has also been focused in this
assessment. Fear of uncertainty have been reported from 87% union while people from 60% union
have the feeling of insecurity and psychological depression or trauma leading them to get involved
in disrespectful work. An estimated 1,902 schools damaged due to flood coupled with COVID-19,
leads to lack of continuation of education, which increases the chance of school drop-outs.
Executive Summary
The ongoing monsoon floods severely comprises the need for safe drinking water and safe hygiene
practices. Out of the affected districts, 7 Districts are out of safe drinking water, 81,179 latrines and
73,343 tube-wells are damaged and destroyed. Approximately 93% of the sanitation facility is
disrupted. Therefore, increasing the risk of water borne disease, infection and COVID-19 spread.

The Ministry of Disaster Management and Relief (MoDMR) Government of Bangladesh in
anticipation of the monsoon flood 2020, took all possible precaution to limit the loss of lives and
livelihoods along with coordinated efforts from the relevant government and non-government
stakeholders. The emergency response was different from previous years because of implementing
early forecast mechanism (T-10 early action) which supported in early preparedness and action to
support towards emergency life savings humanitarian assistance including, cash, dignity items etc.
To support impacted communities the GoB has already mobilized resources.

An early to medium-term (05 to 09 months) early recovery and reconstruction effort will be needed
to repair the damaged infrastructures specially embankments, dykes, houses, safe drinking water
sources, sanitation facilities etc. for restoration of life and livelihood, rehabilitation of agricultural
lands and ensuring continuous efforts of recovery in doing so.
Key Findings Monsoon floods 2020 has affected 21 districts in northern and northern-eastern part of Bangladesh among which 16 districts are moderate to severely impacted. Notably, some of these most affected districts are already indicated as vulnerable districts due to COVID 19 situation such as Jamalpur, Sunamganj and Netrokona. More than seven hundred thousand families are waterlogged at 654 unions in 102 upazilas where 62 upazilas are moderate to severely affected Embankments in 220 unions among the most affected 334 unions have been damaged – embankments in 97 unions experienced more than 4 kilometers damage while the length of damage in embankments located in 53 and 70 unions range within 2-4 kilometers and 0.1-2 kilometers respectively In the last 24 days (30th June to 23 July 2020), the Health Emergency Operations Centre & Control Room of DGHS recorded a total of 7,462 cases (More than 50% from Acute Watery Diarrhea) and total of 83deaths (more than 80% from drowning); Due to acute shortage of food, pure drinking water and poor sanitation system, there is a possibility of communicable disease outbreak when flood water will start receding; there is potential threat that COVID-19 can spread very fast among the people staying in the flood shelters. About 100 thousands of the flood affected women are pregnant may face serious health condition. Livelihood/income generating activities disrupted in 309 unions (i.e. 93% of the total affected unions) Cultivation/fisheries/poultry/livestock (Agriculture) affected in 306 unions (i.e.92% of the total affected unions) Functioning of local markets have been severely disrupted in 144 unions (i.e. 43% of the total affected unions) Increasing relief dependency is found among the community of 263 unions (i.e. 79% of the affected area). Involvement in disrespectful work has been informed by respondents from 72 unions (i.e. 22% of the affected area) 80 unions experienced displacement above 40%. About 60% of the Unions reporting moderate displacement faced experienced irregular food intake 1,902 schools damaged (Mymensingh: 483, Rangpur: 762, Sylhet 635 and Barisal 22). 807,467 children are on the brink of losing access to education. 10 NFE Centres in 4 upazillas (Rajarhat, Madarganj, Nabiganj Goalanda) are damaged. Intensified sexual and gender based violence, particularly intimate partner and domestic violence and further marginalization of the vulnerable groups including the gender diverse, ethnic minorities. Approximately 93% sanitation facilities are disrupted in the affected sub-district. 81,179 latrines are damaged and destroyed; 73, 343 tube-wells were damaged and destroyed. Handwashing facilities are scarce, and as a result, maintaining safe hygiene practices and COVID 19 infection prevention and control is hampered. About 25% of union reported have thought that shelter is a big issue due to the impact of flood. According to the survey, most of the people from 24% of union have have displaced. About 38% of people staying at highland/road/embankments. Household food security and livelihood severely affected due to loss of employment and damage of food stock due to inundation Household food availability and utilization of food is challenged as 92 reported difficulties in cooking food
Sectoral Key Findings

Child Protection
Impacts                                                                         Key Statistics
• According to the National Disaster Response Coordination Center
  (NDRCC), 1.4 M children have been affected.                                   • 1.4 million child affected
• Family separation, becoming homeless, economic exploitation,                  • 6,79,178 family waterlogged
  drowning/injury/death                                                         • 13353 children shifted in
• Physical or sexual abuse, psychosocial distress or mental disorders             shelter center
• Abuse, neglect, exploitation and violence against children. Thus two          • 2.55 Million BDT for Child
  folds the impact for child with disability.                                     Food
• Child marriage may increase during flood situation                            • 13 districts were assured for
                                                                                  women and child safety (GoB)
Needs and Priorities                                                            • 3 lac 0-5 year child affected
• Documentation and tracing for children who are unaccompanied or               • 1.6 lac 5-18 girls children
  separated                                                                       affected
• Case management needs to be done by case worker especially for                • 1.6 lac 5-18 boys children
  unaccompanied, separated, street-based, survivors of sexual violence,           affected
  intellectual/ children with physical disability                               • 1.6 lac 5-18 boys children
• Cash and/or voucher assistance can be used to help families provide             affected
  for their children’s needs and prevent exploitation or school dropout         • 79% Union have difficulties in
• Workers need to help prevent trafficking by supporting family and               caring children, elderly and
  community for children.                                                         person with disability
• Workers need to identify and address risks and barriers that prevent          • 87% union have fear of
                                                                                  uncertainty
  children with disabilities from equally accessing goods, services, spaces
                                                                                • 60% union people have
  and information
                                                                                  emotional and psychological
• Alternative care for the children who are not with family/caregiver             depression or trauma. 40%
• Prevention works in consideration of ethical considerations or                  (Approx.) of them are children
  knowledge gaps can reduce or eliminate risk of abuse, neglect,                • 80% of union’s people are
  exploitation and violence                                                       staying in other places
• Though GoB assured for child safety in 13 districts, still we need to         • 55% union’s people are
  consider social worker/case workers’ involvement for addressing child           detached from other family
  protection perspective including other districts.                               members

Displacement Management
Impacts:                                                                      Key Statistics
• High displacement % of union seeing either some or many                     • 80 Unions (24% ) have more
  population have been displaced.                                               than 40% displaced population.
• 37% of the Char unions and almost 21% of the flood plain unions             • 55% of Char reported
  experienced displacement above 40%.                                           displacement more than 40%.
• % of union who saw heavy damage also have high displacement                 • 60% of the Unions reporting
• Unions with high displacement saw high disruptions of the                     moderate displacement faced
  economic and social activities.                                               experienced irregular food
                                                                                intake
Needs and Priorities:
                                                                              • Unions with less than 40% of
• Drinking water emerged as the main need (39%) followed by food
                                                                                displacement also reported
  almost 13%.
                                                                                issues such as lack of privacy,
• Priority should be in the rural unions as they seems to be worst
                                                                                insecurity and uncertainty.
  affected compared to urban unions/ward – 97% of the rural unions
  witnessed displacement.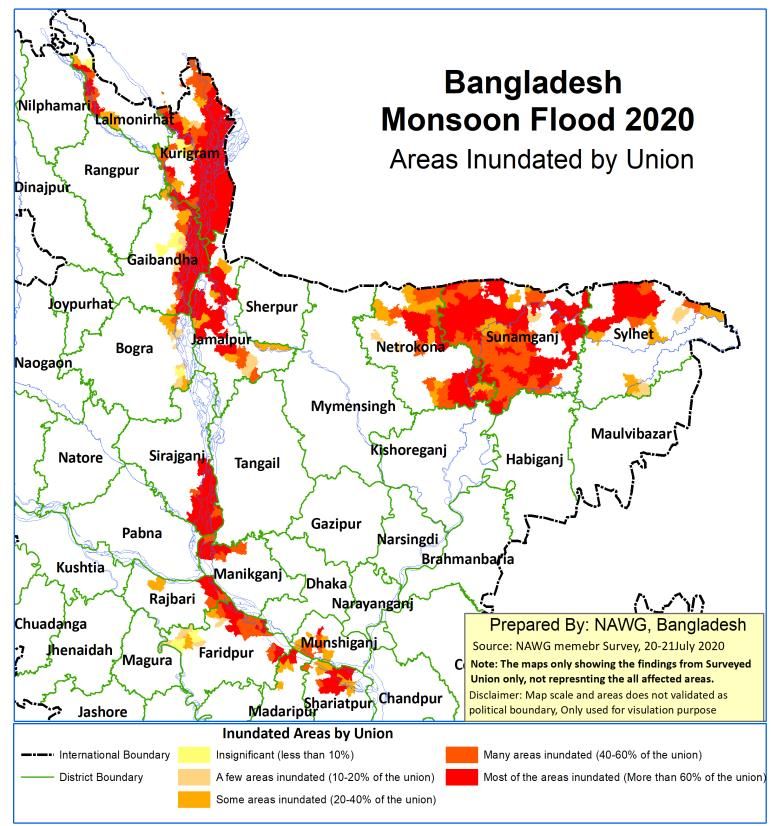
Sectoral Key Findings

Early Recovery
Impacts                                          Key Statistics
• The Monsoon flood has damaged the              • Embankments in 220 unions among the flood affected
  community and household infrastructures          334 unions have been damaged – embankments in 97
  severely and caused further harm to the          unions experienced more than 4 kilometers damage
  lives and livelihoods of the people which        while the length of damage in embankments located in
  was already constrained by the impact of         53 and 70 unions range within 2-4 kilometers and 0.1-2
  COVID19 pandemic                                 kilometers respectively
• Many flood protection infrastructures          • Livelihood/income generating activities disrupted in 309
  such as embankments and dykes are                unions (i.e. 93% of the total affected unions)
  already damaged in the flood affected          • Cultivation/fisheries/poultry/livestock        (Agriculture)
  districts while damage and inundation of         affected in 306 unions (i.e.92% of the total affected
  roads at many points of the affected             unions)
  unions have also been reported.                • Functioning of local markets have been severely
• Livelihood/income generating activities          disrupted in 144 unions ( i.e. 43% of the total affected
  and function of local markets have been          unions)
  severely affected in most of the flood         • Increasing relief dependency is found among the
  affected areas causing high dependency           respondents of 263 unions (i.e. 79% of the affected area)
  on relief, fear of uncertainty, feeling of     • Involvement in disrespectful work has been informed by
  insecurity     and     depression,     and       respondents from 72 unions (i.e. 22% of the affected
  involvement in disrespectful work.               area)
Needs and Priorities
Following early recovery support to the flood affected population would be instrumental considering the loss
of cultivable fields, fisheries, poultry, livestock etc.; impact on small business and local market and damages
of community infrastructure along with overall impact of the flood on livelihoods at the time of COVID19
pandemic:
• Provide multi purpose cash grant to the most affected poor households (i.e. female headed households,
   households having person with disability, households having 5 dependents but no income etc.) to
   maintain immediate family needs
• Create Cash for Work for repairing household and community level life saving infrastructures ( cross
   drainage, embankments, roads etc.)
• Provide start up grant to the small holder business households (especially women run businesses) to take
   charge of their own families
• Psychosocial services/counseling for the individuals/families who lost family members or lost income
   generating opportunities
• Technical support to authorities and community to support build back better the flood protection and
   basic social infrastructure, to make it more resilient in the future.
Sectoral Key Findings

Food Security
Impacts:                                                                                      Key Statistics
• Household food security and livelihood severely affected due to loss of employment          • 80% union reported
   and damage of food stock due to inundation.                                                   Irregular food intake or
• Household food availability and utilization of food is challenged as 92% reported              daily meal skipped, 92%
   difficulty in cooking food.                                                                   facing      difficulty    in
• Economic and Physical access to food is limited due to prices fluctuations impacted            cooking food.
   the affordability of food.                                                                 • Cost of rice had increased
• Market is disrupted due to inundation and communication breakdown. Only 43%                    by 23%, potatoes 43%,
   markets are functioning in a very limited scale. Local storage facilities are disrupted.      lentils 37%, broiler meat
• livelihood is extremely disrupted which reduced income & employment drastically.               13%,               non-leafy
• Negative coping mechanism adopted already (e.g. reduced meals, irregular food                  vegetables        35%     &
   intake, taking loan, selling productive assets, etc.)                                         soybean oil 23%
• Standing crops in agriculture land damaged by the flood water and river erosion             • 62% reported need for
   caused loss of agriculture land and land deformation.                                         food assistance, dry food
• Agriculture production will decrease which will challenge the local level food                 or cooked food. This
   availability. loss of livestock & fisheries hindering the livelihood and food security.       represent HH food stocks
• Significant impacts observed and further anticipated on food value chains and                  has been destroyed or
   prolonged impacts can include limited access and distribution, reduced food diversity,        damaged.
   impact on upcoming planting seasons, and even potential collapse of some                   • 93%                 reported
   agriculture sectors.                                                                          Livelihood/income
• Limited livelihood options due to disruption to food value chains (where most                  generating activities is
   vulnerable groups rely on for daily or seasonal work), compounded by limited access           mostly disrupted.
   to food, will lead to increased indebtedness and negative coping mechanisms.               • 41,918 Hector crop is
• Long-term negative impact on agriculture will increase poverty which will create               completely         damaged
   challenge for economic access to food.                                                        and 125,549 Hector crop
• Availability of fresh non-leafy vegetables decreased                                           is flooded again and
• Food expenditure rose significantly particularly protein-rich food became                      situation is deteriorating.
   unaffordable                                                                               • 80 % reported difficulty
                                                                                                 in loan repayment
Needs and Priorities                                                                          • FAO assessment shows
• Protection from food insecurity through food assistance with distribution of fortified         Prices          fluctuations
  food commodities (FSC Food Assistance package) to address both hunger and                      impacted the adorability
  nutrition to the most vulnerable including marginal groups (e.g. Female headed                 of food
  household, HH with disability etc.) as complement to the government effort ensuring         • 75% people do not have
  respects to religious and cultural traditions.                                                 buying capacity to access
• Provision of dry food and cooked food where cooking facilities are extremely                   sufficient & nutritious
  challenged.                                                                                    foods (Access to food).
• Protection of livelihood through immediate livelihood support as livelihood save lives.     • Moderate to severe
• To increase Income and generate employment as well as reduce relief dependency                 damage on the major
• Incentivized and support for agriculture restoration.                                          crops & fisheries.
• Emergency Agriculture input with operating cash to reduce the upcoming loss of crop         • 92 % reported moderate
  production, such as Agri Input (Seeds, instrument small machinery and tools etc.)              to severe damage on
• Fisheries input including operating cash support to recover fish farming to restore            livestock and fisheries
  livelihoods & fisheries production.                                                            production.
• Livestock assistance and operating cash distribution including feed, livestock              • 3,489 million BDT crop
  restocking, veterinary services and veterinary medicines.                                      damaged and additional
• Emergency Micro gardening kit with operating cash support for immediate                        125,549               hector
  production of vegetable even in the homestead.                                                 agriculture land affected.
• Cash for work to repair breached embankments and essential community                        • 92% HH has difficulty in
  infrastructures (market, agro staging area) to restore livelihoods and agricultural            cooking food.
  production.                                                                                 • 90% HH has difficulty in
• Multi Purpose Cash Grant with MEB to ensure that they have adequate access to                  accessing cooking fuel.
  essential food and non food items.
• Support the market distribution system, supply chain and value chain considering the
  disruption caused by the flood under the pandemic of COVID-19.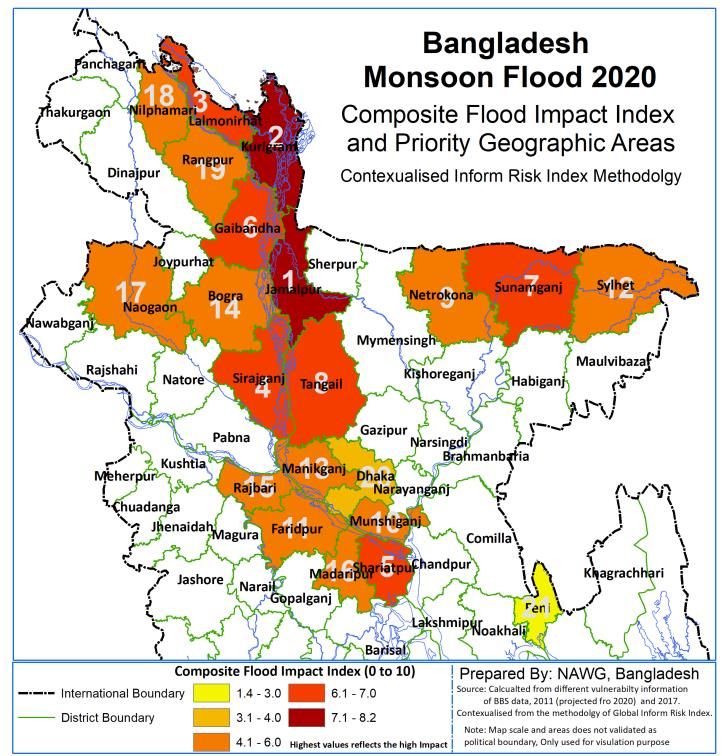
Sectoral Key Findings
                                                                                    Needs Assessment Working group

Education
Impacts:                                                                                              Key Statistics
• Learning loss: 807,467 children
• Learning at home in the context of COVID-19 is severely affected as children are                    • 1,902 schools
  unable to access the remote learning (TV as well as other platforms).                                 damaged
• Academic performance of these children is severely impacted due to double                             (Mymensingh:
  sufferings.                                                                                           483, Rangpur:
• Learners (children and adolescents) who are at the shelter with their families are                    762, Sylhet 635
  severely suffering the scarcity of learning facilities and materials.                                 and Barisal 22).
• Number of schools are getting used as Flood Shelter centers (Source: DPEO
  reports).                                                                                           • 10 NFE Centres
• Specifc plans would be required to bring the learning environment back.                               in 4 upazillas
                                                                                                        (Rajarhat,
Needs and Priorities:                                                                                   Madarganj,
• Repair and Maintenance of the schools/learning centres. The Directorate of
                                                                                                        Nabiganj
   Primary Education (DPE) has allocated limited budget for education in emergency.
                                                                                                        Goalanda) are
• Education kits and materials to the affected learners (khata, pencils, eraser,
   sharpener, school bag and umbrella) at home and in shelters.                                         damaged.
• Community (such as SMCs) mobilization for learning continuity at home and in                        • Learning
   shelters especially for affected and vulnerable children including children with                     materials     of
   disabilities..
                                                                                                        10,000 children
• Rolling out upazila education emergency preparedness plans
                                                                                                        is flowed in the
• Teacher’s orientation for education in emergency.
                                                                                                        above Upazilas.
• Within the framework of school safety and security protocols under Child centered
   DRR, and with focus on hazards and potential risks on children during flooding,
   Minimum Preparedness Actions (MPAs) recommended both structural and non-
   structural inclusive of capacity development to enhance the level of emergency
   preparedness in schools prone to recurrent flooding.
(source: District Education office, UNICEF, Save the Children and HCTT Need
assessment survey)

Health
Impacts                                                                              Key Statistics
• In the last 24 days (30th June – 23 July 2020), the Health Emergency               • The survey reviled that 73% of the
  Operations Centre & Control Room of DGHS recorded a total of 7,462 cases             study units suffered from
  (More than 50% from Acute Watery Diarrhea) and total of 93 deaths (more              disrupted Health care service
  than 80% from drowning);                                                             provision.
• Due to acute shortage of food, pure drinking water and poor sanitation             • More than 50% of the study
  system, there is a possibility of communicable disease outbreak when flood           unions are facing problems
  water will start receding;                                                           related to drinking water supply
• There is potential that COVID-19 can spread very fast among the people               and fresh water for hand washing.
  staying in the flood shelters.                                                     • 19% of the unions (64/334)
                                                                                       prioritized health issues (on
Needs and Priorities                                                                   composite weightage) in the
• Enhance disease surveillance to prevent impending communicable disease               ongoing flood while the major
  outbreak and focused monitoring by the local health authorities supported            concerns are Emergency health
  by the WHO Surveillance Immunization Medical Officers (SIMOs);                       services (medical team and
• Strengthen the COVID-19 active case finding and contact tracing, especially          drugs), Reproductive health
  in the areas close to flood shelters;                                                services, Antenatal and neonatal
• Strengthen health education activities in the flood affected areas particularly      health services, and Psycho-
  on personal hygiene and physical distancing while ensuring these services            social/mental health support.
  are accessible to different types of persons with disabilities.
Sectoral Key Findings
Integrated Gender Based Violence (GBV) and SRH
Impacts Key Statistics
• Intensified sexual and gender based violence, particularly intimate partner and
domestic violence and further marginalization of the vulnerable groups including • 100,000 of the
the gender diverse, ethnic minorities. flood affected
• Households undergoing economic stress and hardship often resorts to negative women are
coping mechanisms whereby women and girls are most affected, such as sex pregnant mothers
trafficking and slavery. affected.
• Maternal morbidity and mortality will increase as well as the unmet need for • Six unions
family planning. Due to the challenges of accessing lifesaving health care identified
services, the number of pregnant women giving birth without the support of a reproductive
midwife or skilled birth attendant will rise." health services to
be the number one
Needs and Priorities
area that
• Ensure adequate safety, security and protection measures for women,
immediately needs
adolescent girls, women with disability and other gender diverse people in
to be prioritized.
emergency flood shelters and temporary/makeshift shelters to protect them
• 11% of all unions
from any form of GBV as well as retrieving dignity and reducing their
identified
vulnerability.
reproductive
• Pregnant mothers, women and adolescent girls need to be able to access life-
health services to
saving sexual and reproductive health (SRH), maternal and emergency obstetric
be among the five
care.
most important
• Referral pathways need to be functioning and improved so that women and girl
areas that need to
survivors of GBV, and/or suffering life-threatening SRH and obstetric conditions
be improved.
can reach and receive standard services from a health facility.
• Health care facilities need to have sufficient number of health care workers
(HCW) and midwives to provide 24/7 services, as well as medical supplies and
equipment to provide treatment and care to patients with SRH and emergency
obstetric conditions, as well as clinical management of rape (CMR).
• Mobilize community volunteers and leaders (combined with youth, village
police, women led CBOs and others) with adequate information, education and
communication (IEC) materials to raise awareness of safety and security of
women, girls and other gender groups and specially women and girls with
disabilities at shelter and community.Sectoral Key Findings
Nutrition
Impacts: Key Statistics
• Disruption of essential health & nutrition services for children, As per JNA, 75% union reported
PLW and care givers will result in the deterioration of wasting nutrition care services have been
status which may increase the caseload of SAM. disrupted.
• Due to irregular food intake and skipping meal, assuming no 64% of union responded that
dietary diversity available which could lead to increased ANC and neonatal care services
malnutrition among children, women and vulnerable groups have been interrupted.
• Breastfeeding rate may decrease due to household damage and • 80% union reported Irregular
displacement, specially for people with disabilities it is a food intake or daily meal skipped,
potential concern. 92% facing difficulty in cooking
• Distribution of BMS is anticipated as large number of food.
participants reported to faces difficulty in child caring which 79% of the faces difficulty in
might increase the incidence of diarrhea amongst young children caring children or persons with
(due to use of unsafe water for milk preparation) resulting in disabilities and elderly
increased malnutrition and child mortality • Cost of rice had increased by
• Lack of maternal and childcare services due to monsoon flood 23%, potatoes 43%, lentils 37%,
and COVID19 both which will led increased child and maternal broiler meat 13%, non-leafy
mortality due to malnutrition. vegetables 35% & soybean oil
• Children and women’s calorie intake and micronutrients 23%
deficiency will be occurred due to skipping meals, disruption of • 62% reported need for food
income generation, price hiking of regular food items and reduce assistance, dry food or cooked
buying capacity. food. This represent HH food
stocks has been destroyed or
Needs and Priorities
damaged.
• 93% reported Livelihood/income
• Provision of management of acute malnutrition through case
generating activities is mostly
management for SAM and emergency nutrition supply for SAM
disrupted.
children.
• FAO assessment shows Prices
• Creating opportunity to community screening of SAM
fluctuations impacted the
• Support appropriate service delivery for PLW and children.
adorability of food
• Restoration of Infant and Young Child Feeding counselling and
• 75% people do not have buying
maternal nutrition counselling,
capacity to access sufficient &
• System strengthening for monitor BMS code violation
nutritious foods (Access to food).
• Provision of micronutrient supplements for PLW to ensure
• 92 % reported Moderate to
nutrition.
severe damage on Livestock and
• Provision of zinc Supplementation to children suffering from
fisheries production.
diarrhoea.
• 92% HH has difficulty in cooking
• Provision of IFA supplement for adolescent girls
food.
• Provision of deworming for under 5 children
• 90% HH has difficulty in
accessing cooking fuel.
• 79% of the faces difficulty in
caring children or persons with
disabilities and elderly
• 25% union’s household damage
and 27% union’s people
displaced.Sectoral Key Findings Shelter Impacts: Key Statistics • A large number of shelters inundated and fully/partially damaged due to flood water. • About 25% of responder • People has lost their usual living space and hence the current living have thought that shelter is condition is not sufficient to maintain reasonable social distance a big issue due to the considering Covid-19 pandemic. Due to damages of shelters; many are impact of flood. living together. It increasing the risk of Covid-19 spreading. • According to the JNA • Many people have left their homes due to the flood and taken shelters at survey 24% of people have roadsides, embankments and shelter centers, they have not sufficient displaced. bedding/utensils support for living, which are increasing their health • About 38% of people risks. staying at • Number of safe shelters is not adequate which is not sufficient to ensure highland/road/embankmen their security and dignity. ts. • Fresh water sources are impacted. Needs and Priorities • Shelter support is one of the most priority to affected people along with food, WASH and NFIs. • Provide transitional/makeshift shelter, tarpaulins, shelter toolkits, cash as emergency shelter assistance. • Provide technical support for house repairing along with in-kind and cash assistance as short term and longer-term shelter needs. • Advocacy with concern authorities to support the landless/affected families. • Renovation of shelter centers are required at affected areas. • Provision of accessible to all and safe shelter support is required in a longer-term basis.
COVID-19: Impact Analysis
Sectoral Key Findings

WASH
Impacts
• 21 Districts are affected by the current monsoon flood, among them 16             Share of affected upazilas
  districts are moderately to severely impacted. Out of these, 7 Districts           reporting disruption of
  are out of safe drinking water. 81,179 latrines are damaged and destroyed;            WASH services
  73, 343 tube-wells were damaged and destroyed.
• A significant number of Union (301) population are now without access to
  safe drinking water as monsoon floods inundated and destroyed WASH                  90 %               93 %
  infrastructure and contaminated water sources, risking outbreak of water-            Water           Sanitation
  borne diseases                                                                      supply            service
• Approximately 93% sanitation facilities are disrupted in the affected sub-         disrupted         disrupted
  districts
• Handwashing facilities are scarce, and as a result, maintaining safe hygiene        90 %              68 %
  practices and COVID-19 infection prevention and control is hampered.               Difficulty
                                                                                                       Difficulty in
• In flood shelters, a number of WASH facilities is not adequate, which is not           in
                                                                                                       maintaining
  sufficient to ensure privacy, security and dignity for women, people with                           personal and
                                                                                     collecting        menstrual
  disability and children.                                                             water            hygiene
Needs and Priorities
Primary and secondary analysis show that WASH services are drastically
interrupted due to the impact of Monsoon Flood, most of the WASH facilities
are under water and that emergency WASH support is immediately needed.
Immediate needs are: the swift provision of safe drinking water supply,
temporary emergency latrine facilities, the repair/construction for the
continuity of functionality of water facilities and the hygiene promotion and the   73,343
provision of hygiene kits for prevention of other waterborne diseases in the                          81,179
                                                                                    Tube well
most affected and vulnerable areas and flood shelters. Within this flood                          Toilet Damaged/
                                                                                    damaged/
                                                                                                     Destroyed
situation and in order to limit the spread of COVID-19, handwashing with soap is    destroyed
the most important practice, so the availability of safe drinking water, hygienic
sanitation facilities and handwashing materials are critical for the most
disadvantaged people, mainly children, women, elderly people and those with
disability who are the most vulnerable in the affected areas.
Priorities addressing children and women needs including needs of children and
women with disabilities needs should also be given to:
                                                                                                  7
                                                                                         Districts Lack of
• Provision of safe drinking water through repair/rehabilitation of damaged               Safe Drinking
water points, tube wells, installation of water treatment plants, disinfection                 Water
and ensuring water trucking and water boating
• Provision of adequate sanitation facilities through repair/construction of
damaged latrines/new temporary latrines for the most vulnerable people,
including those with disability and elderly people;
• WASH services and behavior change messages, especially in Health care
facilities and shelters is critical.
• Reinforcing capacity of communities and engage them to promote key
behaviors related to hand hygiene, handwashing with soap at critical times, use
of hygienic/basic latrines with handwashing stations with soap; also awareness
on water safety
• Coordinating and monitoring communities interventions in the most affected
areas, as well as those with heightened COVID-19 cases (in coordination with
the health cluster).
• Rehabilitation of WASH facilities in schools which were used as flood shelter
and/or badly damaged by the flood while following Consider Universal Design
Guideline in WASH facilities.
• Addressing these needs and priorities will contribute to save lives by reducing
the widespread contamination and spread of water-borne diseases.
Joint Needs Assessment (JNA) Methodology
Introduction
The frequency and nature of cyclonic storms are being changed and the nature of impacts is becoming divers. The
monsoon flood 2020 was anticipated as one of the severe floods.
The Needs Assessment Working Group have closely monitored the flood situation since the 1st spell of the flood and
produced three (3) anticipatory impact analysis and one (1) preliminary impacts. The Needs Assessment Working Group
(NAWG) led by the Department of Disaster Management (DDM) and CARE coordinated a rapid joint assessment of the
situation in collaboration with national authorities and partners with presence in the most impacted areas.
The primary purpose of the assessment is identifying the actual impact scenario, identifying immediate and mid-term
needs through contextualized primary (both GoB and field data collection) and secondary information. The primary data
collection by individual interview as well the information from local administrations, public representatives. The
assessment prioritized the most affected unions in moderate to severely affected 15 districts. The analysis was also done
based on baseline secondary pre-crisis information from Government (BBS) and other reliable sources. The sector-specific
analysis done by the respective clusters. The JNA assessment data are collected by more than 60 local, national and
international agencies present on the ground. The details methodology flow-chart is below-
Process and Methodology
Disaster Monitoring Anticipatory Impact
analysis
HCTT Meeting Preliminary Finds and KIN
Questionnaire
NAWG Meeting Preparation/
contextualization
Planning for Joint Needs Assessment
Secondary Data
SDR
Demographic and Social Vulnerability
Physical and Economic Vulnerability Train and Equip
Field Team for
Disaster Impacts Information (NDRCC) data Collection
DATA
Severity of Impacts by Analysis Surveyed in Primary Data
Geographic 15 Districts
Locations Collection at
Priority and
Union level
Ranking Local Government/
Sectoral Impacts and
Key informants/
Priority by Clusters 334 union from Health Professional/
62 upazila Public
Representatives
Severity of impacts and Sectoral Priority
Recommendations
Analysis Extent of the Assessment:
• The quantitative figure of impact and damage are compiled from the different GoB sources (NDRCC of
MoDMR, DPHE and DGHS) as of 22 July 2020. Thus shows 21 district affected where for one district is very
minimally affected, so for all quantitative figures 20 districts ahs been represented.
• For assessing the qualitative aspect comprises of damage, disruption, distress and need o the affected
community the most affected 15 affected districts were considered for the assessment. Key informants at
for each union were interviewed, and one compiled assessment form per union was completed and used to
compile the findings. So for all qualitative issue the analysis of 15 districts refers as representatives for all
affected 21 districts.
• The analysis and findings in this report represent the impacts up to 22nd July 2020. As the Flood is going on
and may impact additional areas , this quantitative part of the report will be updated if the ongoing flood
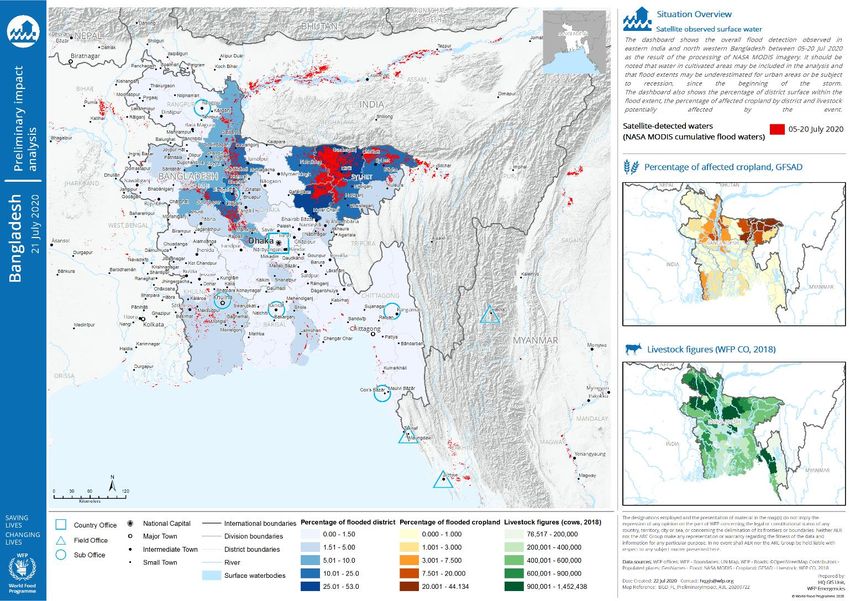
inundate new areas and new population.Geographical Synopsis of Monsoon Floods Monsoon rainfall continues to hit Bangladesh, leaving at least 3.3 Million affected people in 18 Districts, as reported by the International Federation of Red Cross and Red Crescent Societies (IFRC). According to media, the number of fatalities has reached 93 individuals. Thousands of people in low-lying areas are witnessing flood or landslide events. Approximately 56,000 people have been displaced to 1,086 flood shelters across 18 Districts. Road communication in some areas has been damaged by flood waters, isolating several sub-districts. Due to heavy rainfall, most of the areas of Sylhet division are inundated. Among four districts of the division two are fully flooded.
Geographical Synopsis Of Monsoon Floods

Impact of Monsoon floods 2020

         34,002 (24%)                             21 Districts from 5 division
        Square Km Flooded Areas                   (Rangpur, Rajshahi, Sylhet, Mymensingh ,Dhaka)
             in Bangladesh                                          More than 30% inundated

                                             Aggregated Flood
                                                   Extent
                   Total land Area         from 12-21 July 2020            Percentages of Areas
   Division            (Sq Km)                    (Sq Km)                        Flooded
   Sylhet             12368.79                    6794.00                         55%*
   Mymensingh         10554.75                    3734.17                          35%
   Rangpur            16337.36                    4812.04                          29%
   Dhaka              20407.52                   5909.749                          29%
   Rajshahi           18287.32                    5230.99                          29%
                                                 Data Source: Satellite Imagery Analysis by UNOSAT.
                             Satellite data: NOAA-20/VIIRS in cloud free zones as of 12 - 21 July 2020
                                                 * Regular inundated haor(low lying basin) areas included.
Overall Impacts
Overall Impacts on
21 District
21 16 Districts
102Upazila 16 Moderate to
Severe impact
654 3.3 M 7,31,958 83 34002
Unions Inundated* People died Sq km areas iundated
People Affected Waterlogged Families
110,696 2 81,179 73,343 1902
hectare crop land has Major Embankments Toilet Damaged/
Tube well Damaged/ School
been Damaged have damaged Destroyed
Destroyed Damaged
Data Source: Compiled NDRCC, DDM data , DGHS, DPHE, GoB and JNA data from Field (up to 22 July, 2020)
* Some of the Upazilas and Unions are still remain inundated.Overall Impacts: People Affected
Affected vulnerable population Number of Population Affected by Districts
breakdown (from 2 districts)
0.7 1.7
Million Million
Families Women
0.36 1.1
Million Million
Infant and Child Child and adolescent
(0 to 59 months) ( 5 to 18 age)
0.27 50,430
Million
Elderly Population Person With Disability
84,195 101,017
Pregnant Women
Women Headed Household
0.27 0.25
Million Million
Poor Households Agri labor dependent
Households * District with very minimum a(less than 500 people)
affected population are not visualized in the graph.
Major age-sex groups of Affected Population
900,000
Women Men
800,000
817462
800,427
700,000
600,000
561320
549,534
500,000
400,000
300,000
200,000
182,397
133,736
186300
136848
100,000
0
Infant and Child (0- Child and adolscent Adult (19-to 59) Elderly(60+)
to 59 months) (6-to 19)Geographic Scope of the Assessment
According to the NDRCC data of Assessment Coverage areas:
the Government of Bangladesh
dated 22nd July 2020, Monsoon 15 Districts, 62 Upazila, 334 Union
Flood 2020 impacted more or
Number of Number of No of Number of
less 21 districts over the country.
District Name Affected Affected Upazila Union
Among 21 districts 15 districts
Upazila Union/s Surveyed Surveyed
are worst impacted range from
moderate to severe impacts Bogura 3 19 3 10
associated with all physical Faridpur 5 23 4 19
dimensions of the flood (e.g. Gaibandha 4 28 4 25
inundation, erosion, water Jamalpur 7 59 6 32
logging). On the basis of theses Kurigram 9 59 9 59
physical dimensions and key Lalmonirhat 22 2 10
critical damages and disruptions, Madaripur 4 28 1 5
(e.g. house damage, Manikganj 7 21 1 8
embankment collapse, Munshiganj 4 19 2 13
population affected, long term
Netrakona 5 35 7 34
inundation) 62 upazilas were
Rajbari 3 7 2 5
selected from 15 districts for
conduction the assessment. Basic Shariatpur 4 46 2 13
Aspects of the assessment are as Sirajganj 6 51 3 15
follows Sunamganj 11 88 11 67
- One assessment format for Sylhet 9 47 5 19
one union, covered all
affected union in the targeted Map: Upazilas covered the Join Needs Assessment
upazila ( compiled overview
and response of multiple Key
informants, not the household
level survey)
- Explore an understanding of
the disaster’s impact by the
local elected representative
and other stakeholders in the
affected areas.
- Get a overview of the service
disruption and distress of the
affected community due to
this prolonged flood.
- Outlines how the disaster is
likely to unfold in the days
and weeks to follow.
- Identify the severity of Impact
and prior needs.
Note: Further all qualitative
aspects regarding damage,
disruption, distress and key
immediate needs will be analyzed
for 15 districts.Geographic and Demographic Impact
Areas Flooded
Since the first spell of flood started in last week of
June, in total 34,002 (24%)* square kilometer areas
inundated over the country. In the most affected 21
districts 17195 square kilometer areas are inundated.
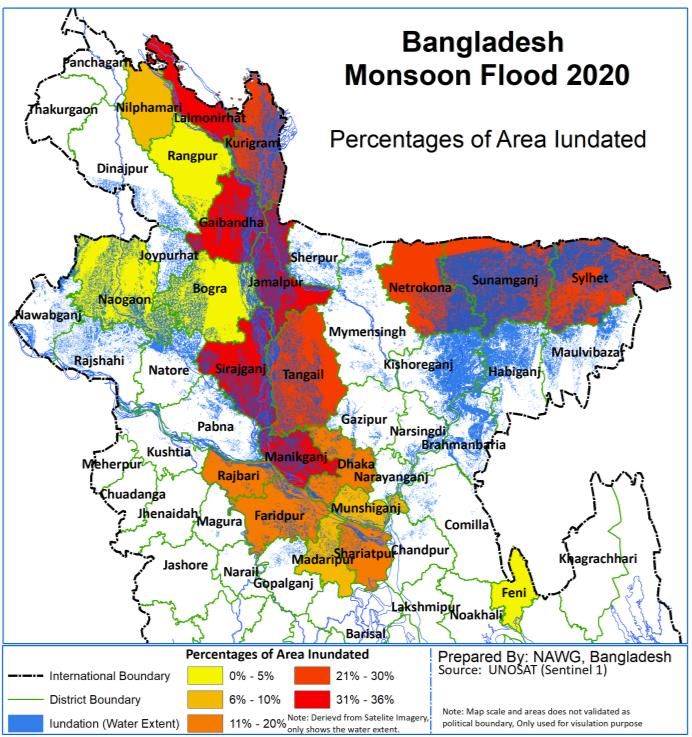
Graph: Percentages of area inundated by districts
Source: UNOSAT Rapid Mapping Services. (12-21 July); Satellite data: NOAA-20/VIIRS in cloud free zones as of 12 - 21 July 2020
* Including regular monsoon flooding low lying basin. (Specially in haor region (Sylhet, Sunamganj, Netrokona) the inundation also
covers the hoar inundation which tends to be inundated during monsoon.
The satellite imagery based analysis identified that Jamalpur experiencing flood in the highest portion of the
districts and subsequently Sunamganj , Sylhet, Tangail, Kurigram, Gaibandha and Netrokona districts faced
flooding more or less 50% of the areas.
Inundation at Union Level:
The primary impact survey findings depicts the
flood at local level and portion of the union
inundated. Among 334 most affected union the,
about 50% of has faced inundation of most of the
areas in the union. On the other hand more than
45% union experiencing flooding of more than
10% to 60 % areas in last two weeks.
Graph: Portion of the area inundated in Union
Insignificant Some areas
(less than (20-40%);
10%); 3% 18%
Most of the
areas (More
A few areas
than 60%);
(10-20%); 5%
50%
Many areas (40-
60%); 24%Geographic and Demographic Impact
Village Affected and Flooded
Preliminary Impact assessment of Percentages of Affected Villages/wards
monsoon flood focused on assessing the
extent of flooding at lowest
administrative region (union ad
94%
93%
90%
85%
ward/village). In the surveyed 334 union 100%
80%
79%
78%
78%
5117 (77%) villages/wards were 90%
67%
67%
66%
affected by flood out of 6668 80%
62%
59%
villages/ward. 70%
51%
46%
• In Jamalpur, Sunamganj, and 60%
Sirajganj district more than 90% 50%
villages were affected among the 40%
surveyed union, thus reflects the 30%
impacts is beyond manageable with 20%
the local capacity. 10%
• Kurigram and Shariatpur district 0%
Madaripur
Sirajganj
Bogura
Jamalpur
Shariatpur
Manikganj
Munshiganj
Faridpur
Gaibandha
Netrakona
Sunamganj
Kurigram
Rajbari
Sylhet
Lalmonirhat
experienced flooding in more than
80% villages among surveyed union.
• On an average more than 50% of
villages were flooded in other
districts.
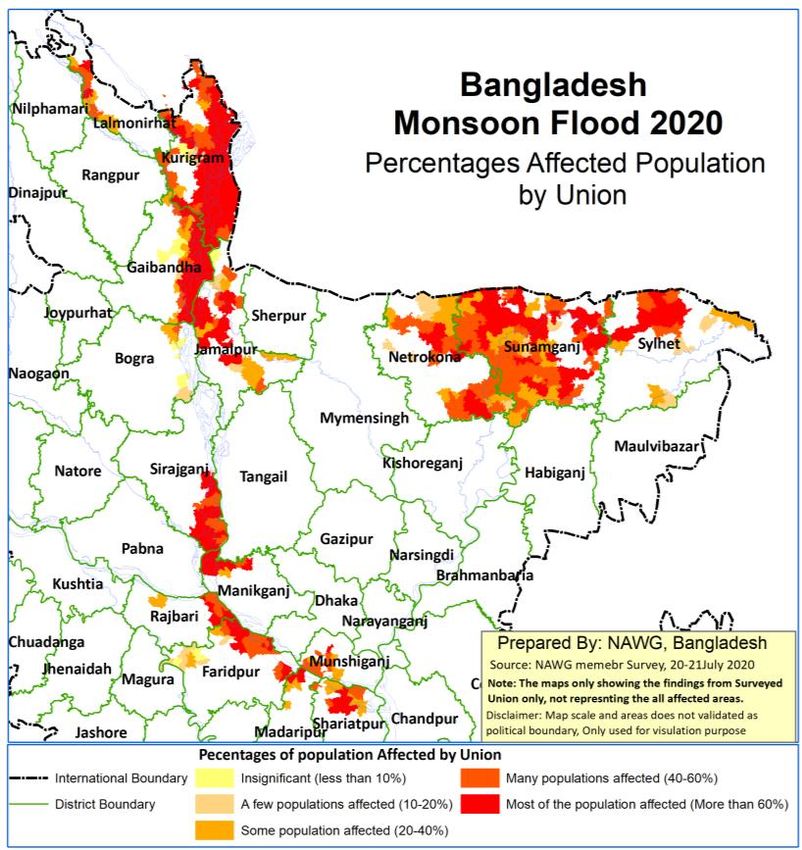
People Affected
Though this flooding is intense but filed survey depicts not all union affected equally in terms of the people
affected or waterlogged. The proportion of population affected union shows in the 138(41%) union the affected
population is more than 60% which reflects most of the population has been affected. On the other note 40-
60% population has been affected in 97 (29%) union which reflects the impact and extent of flood is severe in
surveyed union.
Additionally there are 63 (19%) union where
20 to 40% population has been affect in
surveyed union. Only 7% union mentioned
that 10 to 20% and 4% union reported as less
than 10% affected population in the union.
Graph: Portion of population affected in Union
Insignifican
t (less than Some areas
Most of the
10%); 4% (20-40%);
areas (More
than 60%); 19%
41%
A few areas (10-
20%); 7%
Many areas (40-
60%); 29%Geographic and Demographic Impact
People Displaced
Displacement due to flooding in
one of the major indicators
which triggered other distress
and hindrance to ensure
services. Mainly inundation or
damages of house forced
people to be displaced. This
monsoon flood displacement
mainly temporarily until the
flood water recedes.
• Out of 334 surveyed union at
least more than 10% people
from 250 union had to move
from their original location
(house).
• In 20 (6%) union most of the
population reported as
displaced.
• Displacement of 40-60%
population is reported in
60(18%) union and 20-40%
displacement is reported in
80 (24%) union which
reflects a large number of
people is displaced and living
in distress.
Graph: Portion of population displaced in Union
Current location of Displaced Population
The assessment tends to explore the current living
location of displaced population. This information Many areas Insignificant (less
(40-60%); 18% than 10%); 25%
shows the current location of the people from 250
unions out of 334 unions where people were
displaced or still remain displaced. Most of the areas
• The highest number of union (39%) reported (More than 60%);
displaced population living in own home or
relative’s home. People in the own home reflects Some areas (20-
that people were displaced and now return to A few areas (10-20%);
40%); 24% 27%
their houses.
• Among the location of the current living place of
displaced population 126 (38%) union reported Graph: Current location of displaced population
most of the displaced people currently living as
collectively on nearby highlands (mainly roads, Highland/Road/
Home (Own/With
embankment). The distress of this people is very Relatives); 39% Embankment; 38%
severe as they are mostly living under open sky.
• 50 (15%) union reported most of the displaced
people in the union currently living in educational Educational/
religious institute;
institute in a congested environment.
15%
• Other 27 (8%) union reported most of the
displaced people living in government managed
Govt. flood
shelter. shelter; 8%Geographic and Demographic Impact
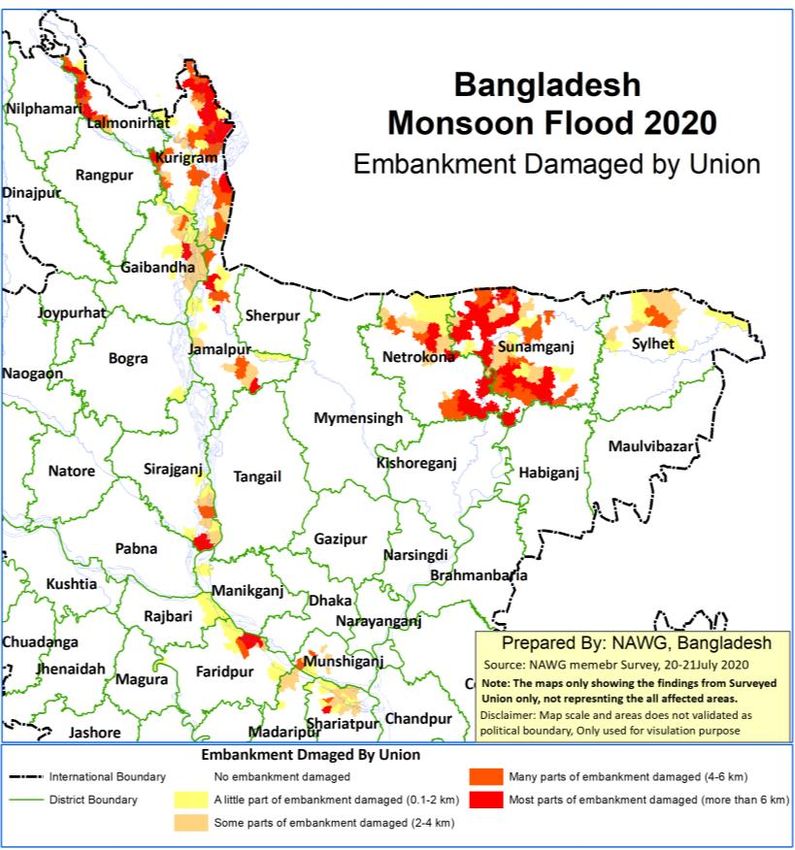
Damages of Embankment
Damages of embankment is one of the
regular phenomenon associated with
monsoon flood thus tends to prolong the
flood or frequently inundated the agri-land
and houses even when the water level is not
so high. In 114 (34%) union, there are no
damages of embankment but other 66%
union among 334 union has reported
damages of embankment in different scale.
Graph: Damages of embankment in Union
Most of the
union (more No embankment
than 6 km); 14% damaged; 34%
Many parts (4-6
km); 15%
Some parts of
embankment
damaged (2-4
A little part
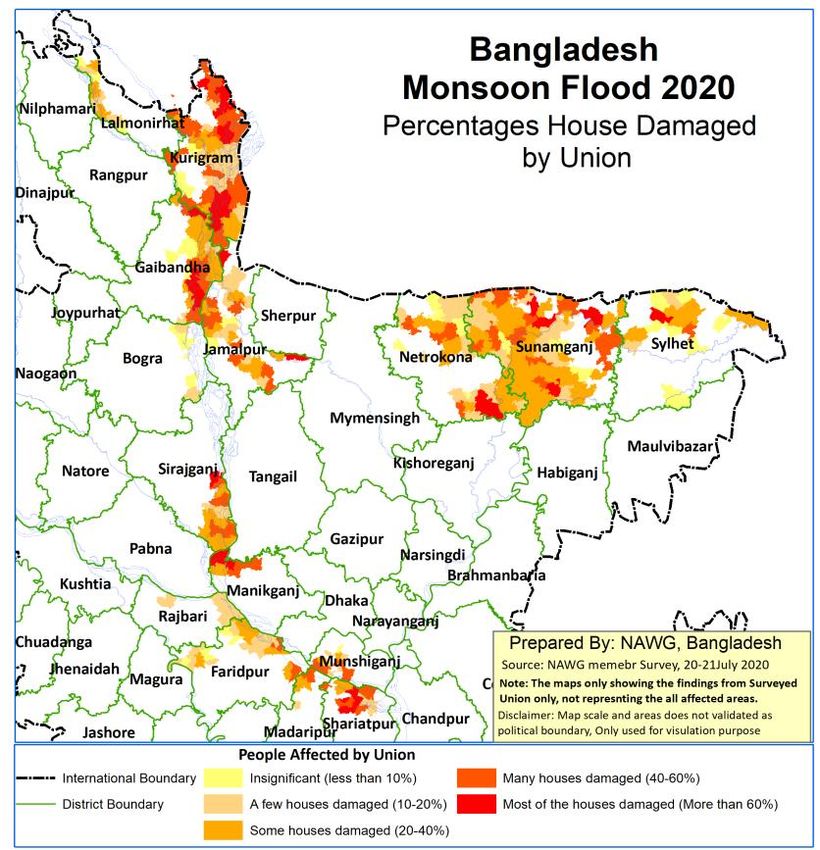
Damages of Houses
Housing structure in northern and north eastern flood prone zone are mostly katcha or Jhupri as highest
number of poor and extreme poor people live in these areas. Thus this type of severe flood has potential
impacts flood always has potentially damages the houses. In the surveyed 334 union , there damages of
houses reported either partially or fully or partially in 87% of the union.
• There 33 (10%) union where most of
the houses damaged fully or partially.
• 83 (25%) union reported damages of
40 to 60% of the house in the union.
• Additionally 20-40% houses were
damaged in 93 union.
• Additionally 80 union experienced
damages to 10 to 20% of houses.
Graph: Damages of house in Union
Mostly (More
than 60%); 10%
Insignificant (less
Many (40- than 10%); 13%
60%); 25% A few (10-
20%); 24%
Some (20-
40%); 28%Vulnerabilities of the Affected Community
This prolonged monsoon flood
create two fold impacts when its
associated with existing
vulnerabilities and aggravate
distress to the affected community.
For assessing the severity of
impacts relevant demographic and
socio economic vulnerability
indicators of the affected areas
were consider and indexed as per
the Global INFORM risk index
guideline. The analyzed
vulnerability indicators are-
Demographic Vulnerability
Number of Infant and child
affected, Number of Elderly person,
Number of person with disability
Socio economic Vulnerability
Number of poor and extreme poor,
Number of Women Headed HH,
Katcha and Jhupri Houses, Agri
labor dependent HH
Table : Data table of vulnerability indicators for the affected community
Number of Number of
Number of Number of Number of
Number of Number of Number ofPeople in People in
Affected Person Number of Katcha
Affected Extreme Women Affected Affected
Division District Name child (0-to with Poor HH and Jhupri
Elderly Por HH Headed Women Agri labor
59 Disability Affected HH
(60+) age Affcted HH Affcted Headed Depended
months) Affected Affected
HH HH
Rangpur Kurigram 25473 18195 3503 40268 30659 6198 25243 23541 34343
Rangpur Gaibandha 14869 10679 2595 15841 9812 4481 17414 14499 15345
Mymensingh Jamalpur 110412 81566 14125 130583 87544 29836 121421 84082 225511
Mymensingh Netrakona 10706 7250 1290 5486 2513 1777 8267 7036 14293
Dhaka Manikganj 692 714 111 283 151 128 547 248 430
Rangpur Lalmonirhat 19398 12992 3025 16602 9112 3441 14880 18477 31520
Dhaka Shariatpur 22388 18029 2675 6334 1996 6128 28575 11670 23062
Sylhet Sunamganj 16306 8380 1699 686 510 259 1450 1313 2157
Dhaka Munshiganj 11517 9872 1692 717 287 4842 22345 4563 19743
Dhaka Rajbari 3528 3105 589 2982 1414 662 2916 2693 5239
Dhaka Tangail 22672 21270 3225 7303 3321 4848 20088 13582 34900
Rajshahi Naogaon 6548 6022 1234 6050 3425 1807 7163 7885 13042
Sylhet Sylhet 21511 11461 2539 4465 2999 5136 29589 8387 16092
Dhaka Sirajganj 37230 25046 5348 23906 9721 5806 25153 26877 71474
Dhaka Faridpur 15559 12417 2439 2570 1057 3624 16499 11316 21809
Rajshahi Bogura 11892 9846 1969 8666 4301 2833 11112 10832 23399
Rangpur Nilphamari 3060 1841 393 2187 964 494 2150 3339 5761
Rangpur Rangpur 5000 3850 815 0 0 0 0 0 0
Dhaka Madaripur 8976 7509 1070 602 153 1629 7533 3968 11255
Dhaka Dhaka 959 543 95 231 38 268 1158 522 1642
Source: BBS (Projected from Population and Housing Census 2011, HIES-2017, Agriculture Census 2019Anticipatory Action
GoB preparatory Activities Early Warning
The Ministry of Disaster Management and Relief (MoDMR) Government of Bangladesh
took all possible precaution to limit the loss of lives and livelihoods in anticipation of the Evacuation
monsoon flood 2020. MoDMR coordinates early warning massage, evacuation, shelter
center management etc. The MoDMR also allocated emergency support (rice, food,
and Shelter
cash, child food, animal feed, house repairing cost and corrugated iron sheet) to the Management
districts most likely to be severely impacted.
Resource
Government and non-government’s preparedness on Monsoon Flood 2020:
allocation for
The GoB through its MoDMR monitored the situation closely and coordinated with response
all relevant government and non-government stakeholders.
The Health Emergency Operations Center and Control Room of the Department General for Health Services
(DGHS) is activated 24/7 as well as local control rooms. 627 Emergency Medical teams have already been
formed and 1772 medical teams has been deployed.
Prior to the disaster the monsoon flood 2020, the MoDMR allocated 16,400 metric tons of GR rice;
3,60,00,000 BDT GR cash, 50,00,000 BDT for child food, 92,00,000 BDT for animal food, 87,000 dry food
packages, 12,00,000 BDT for house repairing and 480 bundle of corrugated iron sheets for supporting the
affected population over the country.
1851 collective shelter has been arranged for flood faceted people.
DPHE has provided the following UNICEF supported supplies: 757 Hygiene kits, 675,880 WPT, 636 Bleaching
powder, 3,407 Jerry can, 684,880 Water Purification Sachets, and 180 Plastic Ring-Slab Sets in Rangpur,
Mymensingh and Sylhet.
Anticipatory Action by Humanitarian Agency
This monsoon flood was responded prior to the flood the
basis of forecast as anticipatory responses. Though this 51,412 From 136 From 21 From 5
initiatives has been practices as pilot since 2016, but this People Unions Upazilas Districts
year the anticipatory action was diverse with large
number of coverages as new dimension of humanitarian Kurigram- 75 -97222
response. CARE- SOLIDARITY _START Fund
BD/UKAID : P- 405
Sectors covered by anticipatory action CARE- CARE_ECHO(EU) : P- 15991
FAO- RDRS _CERF: P- 40083
People
Sectors PIB- ESDO _CERF : P- 1500
reached UNFPA-CARE- MJSKS _CERF:P-900
CwC/Community WFP- CERF: WFP- WFP _CERF : U-54, P- 7209
P- 34
Engagement 9000 UNFPA- AAB-RSDA_CERF: P- 600
Food Security 18575 UNFPA- AAB-ASOD_CERF: P- 650
WFP-_CERF : P- 1633
Gender-based Violence 5905 FAO-DAE_CERF: P- 26700
UNFPA-LAMB_CERF : P- 1848
Health Inculding SRH 4509
Multi-purpose cash Gaibandha- 50 -68427
assistance 22171 •CWW_ECHO(EU) : P- 3052
Shelter 254 •FAO-DAE_CERF : P- 26679
WASH 858 •LAMB_CERF : P- 1848
•WFP- RDRS _CERF : P- 28290
•PIB- ESDO _CERF :P- 1500
•UNFPA-CARE-SKS _CERF :P- 1800
•WFP- WFP _CERF : P-5256
Jamalpur- 36 -42079
•WFP- RDRS _CERF : P-8107
•UNFPA AAB-BACE_CERF: P- 1150
•FAO-DAE_CERF: P- 26700
•IRB_ECHO(EU) : P : 3706
Key for Map and Info Box: •PIB- ESDO _CERF : P-1500
• Darkest Color shows highest number of Household reach •UNFPA-LAMB_CERF : P- 1848
Sirajganj, 3497 • The Informational Box shows the information as below
Lead Agency- IP Agency_Funding Source : Number of •WFP- WFP _CERF : P-2070
Bogura, 8 Beneficiary; P= Number of beneficiary •WFP-NDP-CERF: P- 344
Number of population reached presented after district name.You can also read


