Fostering mathematical modelling competency of South African engineering students: which influence does the teaching design have?
←
→
Page content transcription
If your browser does not render page correctly, please read the page content below

Educational Studies in Mathematics
https://doi.org/10.1007/s10649-021-10068-7

Fostering mathematical modelling competency
of South African engineering students: which influence
does the teaching design have?

Rina Durandt 1                           2
                      & Werner Blum & Alfred Lindl
                                                     3

Accepted: 2 March 2021/
# The Author(s) 2021

Abstract
This paper reports on empirical results about the influence of two different teaching
designs on the development of tertiary students’ modelling competency and attitudes
towards modelling. A total of 144 first year engineering students were exposed to a
diagnostic entrance test, a modelling unit consisting of five lessons with ten tasks,
enframed by a pre- and a post-test, and at the end a questionnaire on attitudes
towards mathematical modelling. Similar to the German DISUM study, in the
modelling unit, one group of participants followed an independence-oriented teach-
ing style, aiming at a balance between students’ independent work and teacher’s
guidance, while two other groups were taught according to a more traditional
teacher-guided style. Linear mixed regression models were used to compare pre-
and post-test results. The results show that all groups had significant learning
progress, although there is much room for further improvement, and that the group
taught according to the independence-oriented design had the biggest competency
growth. In addition, this group exhibited more positive attitudes than the other
groups in five of six attitudinal aspects.

Keywords Attitudes towards modelling . Engineering students . Mathematical modelling
competency . Student independence . Teaching design

* Rina Durandt
  rdurandt@uj.ac.za
* Alfred Lindl
  alfred.lindl@paedagogik.uni–regensburg.de

1
    Department of Mathematics and Applied Mathematics, University of Johannesburg, Johannesburg,
    South Africa
2
    Department of Mathematics, University of Kassel, Kassel, Germany
3
    Department of Educational Sciences, University of Regensburg, Regensburg, Germany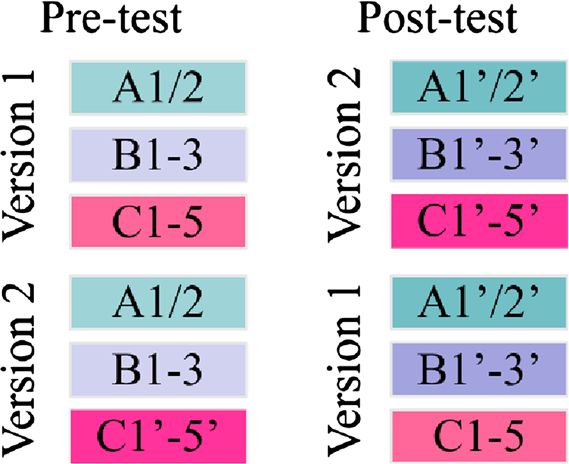
Durandt R. et al.

1 Introduction

Mathematical modelling is in many countries an integral part of mathematics curricula, both at
the primary and secondary school level and equally at the tertiary level where mathematics
often functions as a service subject for other disciplines (see Niss & Blum, 2020, chapters 5
and 6, for an overview on challenges and possibilities for the implementation of mathematical
modelling). One reason why modelling is compulsory is that an essential goal of mathematics
teaching is to enable students to solve real-world problems by means of mathematics. This is
particularly important for mathematics as a service subject, since the role of mathematics here
is to contribute to a better understanding and mastering of situations and problems stemming
from the serviced discipline. How can this goal be achieved, what are effective teaching
methods for mathematical modelling, especially in a tertiary environment? This article reports
on a study where two teaching designs for a modelling unit for first semester engineering
students were compared with respect to their impact on the students’ modelling competency
and their attitudes towards modelling.

2 Mathematical modelling competency

Mathematical modelling in the commonly used sense (for various characterisations of “math-
ematical modelling” see Niss & Blum, 2020, chapter 2) means solving real-world problems by
using mathematics, that is translating the problem situation into mathematics, working within
the resulting mathematical model of the situation, and interpreting the mathematical outcomes
in the given situation. An example is the problem of what the optimal speed is in dense traffic so
that the number of cars passing through a certain point becomes a maximum (see Niss & Blum,
2020, chapter 3). The solution consists of building a mathematical model which represents the
number of passing cars by a certain rational function, with the speed as independent variable, of
analysing this function concerning its maxima, and of interpreting the result as an answer to the
original question. When describing the solution process in an ideal-typical way, we can identify
seven steps which form the so-called modelling cycle (Blum & Leiß, 2007): understanding a
situation and constructing a mental model of it, structuring and simplifying the mental model,
mathematising the resulting real model, working within the mathematical model, interpreting
the mathematical results, validating these results, and presenting the solution (see Fig. 1).

Fig. 1 The modelling cycle according to Blum and Leiß (2007)
Fostering mathematical modelling competency of South African engineering ...

    Mathematical modelling competency is often defined (see Blomhøj & Jensen, 2007; Kaiser
& Brand, 2015; Niss et al., 2007) as an individual’s ability to construct and to use mathemat-
ical models to solve real-world problems, as well as to analyse or to compare given models.
Being able to carry out certain steps in this process (see Fig. 1) corresponds to specific sub-
competencies of the modelling competency (Kaiser & Brand, 2015; Maaß, 2006). In the
conceptualisation of Niss and Højgaard (2011, 2019), modelling competency comprises, in a
slightly narrower sense, steps 2, 3, 5, and 6 in the modelling cycle, whereas steps 1 and 7
belong to the communication competency, and in step 4 various mathematical competencies
may be required. We will, in the following, use mathematical modelling always in the wider
sense, and when we speak of modelling tasks we always mean tasks which require several or
all steps of the modelling cycle.
    Since mathematical modelling requires several competencies and skills as well as real-
world knowledge, it is cognitively demanding for students. An important empirical finding is
that every step in the modelling process is a potential cognitive barrier for students (e.g., Blum,
2015; Stillman et al., 2010). Already the first step, constructing a situation model, is cogni-
tively demanding and can be a big hurdle. One essential reason is that students also need
language proficiency for understanding a modelling task (Leiß et al., 2010; Plath & Leiß,
2018). The second step can also be a substantial hurdle because identifying relevant variables
and relations between them and making assumptions are demands that have to be performed
already with a view of what could or should be an appropriate mathematical model, a
phenomenon known as implemented anticipation (Niss, 2017; Stillman & Brown, 2014).
So, it requires specific teaching efforts to help students to overcome these hurdles and to
become competent in modelling (see section 3).
    The aims connected with mathematics in general and with mathematical modelling in
particular are not merely of a cognitive nature, that means students ought to acquire not only
knowledge, skills, and competencies but also appropriate attitudes towards mathematics and in
particular towards mathematical modelling. Some conceptualisations of the notion of compe-
tency even include the willingness to apply one’s ability into the definition of “competency”
(e.g., Weinert, 2001). Although the term attitude is widely used by researchers and educators,
it is a complex construct and requires some explanation. For some authors (e.g., Chamberlin &
Parks, 2020; McLeod & Adams, 1989) the affective domain is multifaceted and relates to
beliefs, attitudes, and emotions. Attitudes are generally regarded as less cognitive than beliefs,
but more than emotions, and may involve positive or negative feelings, and more generally
manners of acting, feeling, or thinking (Chamberlin, 2019; Goldin et al., 2016). There is no
agreement on the number of dimensions that best represents attitude (Vanhoof et al., 2011). In
our study, we view a student’s attitude towards mathematical modelling as the student’s
judgement about the subject, how the student acts, feels, or thinks about mathematical
modelling tasks. The individual dimensions of attitude that we use in our study were
developed based on research findings on attitudes towards mathematics or mathematical
modelling, taking into account the specific challenges of mastering mathematical modelling.
These dimensions are as follows: (i) the estimated difficulty of mathematical modelling
activities (for previous findings, see Jacobs & Durandt, 2017), (ii) the subjective value
(including usefulness and relevance in personal and professional life) of modelling (for related
findings see Krawitz & Schukajlow, 2018; see also the study of Hernandez-Martinez & Vos,
2018, with engineering students), (iii) the level of personal interest in studying modelling (see
Rellensmann & Schukajlow, 2017), (iv) the effort which the student is willing to invest in
learning modelling (which in our view is also related to motivation, see Jacobs & Durandt,
Durandt R. et al.
2017), (v) the level of cognitive competence or self-concept of intellectual skills and abilities to
study modelling (see related research from Sonnert et al., 2020), and (vi) the emotional
disposition—what we call affect—towards modelling (see Di Martino, 2019).
For many years, attitudes towards mathematics and their influence on success in mathe-
matics have been studied (compare Chamberlin, 2019) and it seems that performance in
mathematics influences attitudes, but the reverse is not necessarily true (Ma & Xu, 2004).
However, many studies have found that student attitudes, and particularly mathematical
anxiety (as the endpoint of negative attitudes), may lead to weaker mathematics performance,
which then creates a vicious circle feeding again into more negative attitudes (Burrus &
Moore, 2016). We also know from research that negative attitudes influence not only
performance but also other aspects like mathematical thinking or self-efficacy beliefs. A strong
interaction exists between mathematical modelling and the affective domain, as the one
influences the other, and both constructs, together with the interaction between these con-
structs, influence cognition (Chamberlin, 2019). On the one hand, mathematical modelling can
help students to understand the usefulness of mathematics, and on the other hand, a positive
attitude towards mathematics can strongly affect the way students approach real-life problem
solving (Di Martino, 2019).
3 Teaching of mathematical modelling
There are quite a number of empirical studies on the learning and teaching of mathematical
modelling, especially from the last two decades. In the following, we summarise some selected
findings on teaching modelling which we consider as particularly relevant for our own study
(for a survey about important empirical findings concerning modelling, see Blum, 2015;
Kaiser, 2017; Niss & Blum, 2020, chapter 6; Schukajlow et al., 2018; Stillman, 2015,
2019). An important general aspect of all those findings is that they have been obtained in
certain organisational, societal, and cultural environments, and it must be examined to what
extent these findings may be transferred and generalised to other environments. An essential
reason why transfer cannot be expected, neither for individual knowledge, skills, and compe-
tencies nor for findings about students’ learning, is the situatedness of all learning (see Brown
et al., 1989, and for mathematics in particular Watson, 1998). This is especially relevant for
any learning in the field of relations between the real world and mathematics, where extra-
mathematical contexts also play a role. So, the modelling competency which a student acquires
is usually restricted to certain mathematical areas and certain real-world contexts, and transfer
has to be carefully organised.
The most important global finding on teaching modelling is that it is, like any teaching, only
effective if basic criteria of quality teaching are fulfilled. This holds for all educational levels.
There is not only one way to teach modelling, but certain criteria that are relevant or even
indispensable. These criteria are based both on learning theories and on empirical findings. In
the general (e.g., Hattie, 2009) and the mathematics specific literature (e.g., Kunter et al., 2013;
Schlesinger et al., 2018; Schoenfeld, 2014), these criteria are specified and categorised into so-
called basic dimensions of instruction quality. Following the classification suggested in Blum
(2015), we distinguish five dimensions of quality teaching. In the following, we describe these
dimensions briefly (for details see Niss & Blum, 2020, section 6.4).Fostering mathematical modelling competency of South African engineering ... a) Effective classroom management This dimension comprises criteria such as structuring lessons clearly; using time effectively; separating learning and assessment recognisably; avoiding disruptions; varying methods and media flexibly. These criteria are largely indepen- dent of specific subjects. Numerous studies have shown that effective classroom management is necessary (though not sufficient) for learning to take place. b) Student orientation This dimension contains criteria such as progressing adaptively; linking new content with students’ pre-knowledge; using language sensibly; giving diagnosis, feedback, and support individually; using students’ mistakes constructively as learning oppor- tunities; and encouraging individual solutions of tasks. Concerning the last-mentioned criteri- on, Schukajlow et al. (2015b) found that, in an independence-oriented learning environment, students who developed several solution approaches had higher learning gains in their modelling competency. c) Cognitive activation of students This means stimulating students’ mental activities by maintaining a continual balance between students’ independence and teacher’s guidance, according to Aebli’s principle of minimal support (Aebli, 1985); avoiding wrong dichotomies such as teacher-guided instruction versus students working alone, “direct teaching” versus “discovery learning”, and instead intertwining those elements situationally. A key element for realising that balance is adaptive teacher interventions which allow students to continue their work without losing their independence (Blum, 2011; Stender & Kaiser, 2016), in particular strategic interventions (related to modelling tasks, these could be “Read the text carefully!”, “Imagine the situation clearly!”, “Make a sketch!”, “What do you aim at?”, “What is missing?”, “Does this result make sense for the real situation?”). Adaptive interventions can be regarded as a special case of “scaffolding” (Bakker et al., 2015). d) Meta-cognitive activation of students This means stimulating accompanying and retro- spective reflections about students’ own learning; advancing learning and working strategies. Many empirical results have shown positive effects of using strategies for modelling activities (for an overview, see Greer & Verschaffel, 2007; Niss & Blum, 2020, section 6; Vorhölter et al., 2019). An example of a strategic aid for students’ mathematical modelling activities is a 4-step modelling cycle (the “Solution Plan”, see Fig. 2) that has been developed in the DISUM project (see Schukajlow et al., 2015a, for empirical results of a study with a slightly different illustration of this plan). Fig. 2 The DISUM “Solution Plan”
Durandt R. et al.

e) Demanding orchestration of topics This means creating permanent opportunities for
students to develop, apply, and practice the aspired competencies by means of substantial
tasks; fostering learning with understanding; regularly including intelligent practising and
repeating; emphasising justifications; and linking between topics as well as between the
subject areas and the real world. This dimension is often hardly visible in current catalogues
of criteria for quality teaching, although findings about situated cognition (see above) point to
the necessity of explicitly addressing subject-specific aspects, because transfer from one topic
area to another or from one competency to another cannot be expected.

    We would like to mention two empirical studies in particular which compared the effects of
learning environments which emphasise different aspects of quality teaching on students’ modelling
competencies and students’ attitudes. First, we refer to the German interdisciplinary research project
DISUM1 because the study we report on in this paper was substantially inspired by DISUM (for
more information about the conception and the results of DISUM, see Blum, 2011; Blum &
Schukajlow, 2018; Schukajlow et al., 2012). In this project, a more independence-oriented teaching
style, called operative-strategic, was compared in a ten lesson mathematical modelling unit in
altogether 26 grade 9 classes (11–16 year olds), embedded in the topic areas of linear functions and
the Pythagorean Theorem, with a more teacher-guided style, called directive (common in everyday
German classrooms), and with an improved version of the operative-strategic style, called method-
integrative. In both the operative-strategic and the method-integrative design, the major aim was
maintaining a permanent balance between teacher’s guidance and students’ independence (see
quality dimension c), and encouraging individual solutions (see quality dimension b), whereas in the
directive design, the teacher guided the students and developed common solution patterns. In the
method-integrative design, the solution plan (see Fig. 2) was available to the students and the teacher
introduced them into its use by demonstrating (as a “model” according to cognitive apprenticeship,
see Brown et al., 1989) how modelling tasks may be solved. As to the cognitive results (see Blum,
2011; Blum & Schukajlow, 2018), all teaching styles had significant and very similar effects on
students’ technical mathematical skills, but only the two independence-oriented styles had signifi-
cant effects on students’ modelling competency. The method-integrative classes outperformed the
operative-strategic classes both in mathematics and in modelling. In addition, the students in the two
independence-oriented designs had a more positive development for affective variables (in particular
for joy and interest; see Schukajlow et al., 2012).
    Second, we refer to a recent study in Canada in which Parhizgar and Liljedahl (2019) compared
two teaching designs, one “teacher-centred” and one “student-centred”, for intra-mathematical
problems, word problems, and modelling problems, and investigated their influence on students’
attitudes towards mathematics. The sample consisted of nine grade 10 classes (15–16 year olds). The
topic areas were also linear functions and the Pythagorean Theorem. The results show that students
liked the word problems most, while the modelling problems seemed too difficult and the intra-
mathematical problems too easy and boring. Dealing with modelling problems had a positive
influence on students’ attitudes towards mathematics in both teaching designs, and the student-
centred design yielded slightly more positive attitudes, especially due to the students’ appreciation of
group work, but no significant difference between the two designs could be found.
1
  Didaktische Interventionsformen für einen selbständigkeitsorientierten aufgabengesteuerten Unterricht am
Beispiel Mathematik – in English: Didactical intervention modes for mathematics teaching oriented towards
students’ self-regulation and guided by tasks. The project was directed by W. Blum (mathematics education), R.
Messner (pedagogy, both University of Kassel), and R. Pekrun (pedagogical psychology, University of
München) and was carried out 2002–2013.
Fostering mathematical modelling competency of South African engineering ...
4 Research questions and hypotheses
The two comparative studies reported in Section 3 were carried out at the secondary school level.
What are effective teaching methods for mathematical modelling at the tertiary level? Will similar
effects for achievement and attitudes also be found at that level? Taking into account that
mathematics learning is situated and dependent on the specific learning conditions and contexts
(see Section 2), this is an open question, and studies which compare the effects of different teaching
styles on the development of tertiary students’ modelling competency do not exist yet. At that level,
mathematics is often taught in a rather teacher-centred way as a service subject for other disciplines
(see Alsina, 2007), so the effects may differ due to the different experiences, motivations, and
expectations of the students. In addition, it is interesting to see how the tertiary students’ pre-
knowledge from school mathematics which, according to empirical studies (see Rach & Heinze,
2017), often shows substantial deficiencies, influences the achievement in modelling.
Thus, in 2018, the idea arose to carry out a research study which compares the effects of
two different teaching styles which fulfil certain criteria of quality teaching (for details see
section 5.2), a method-integrative (MI) and a teacher-directive (TD) style, analogous to those
styles in the DISUM project, with first year engineering students in a South African context.
Like in DISUM, we were interested both in students’ modelling competency (as a whole, not
regarding specific sub-competencies) and in their mathematical competency. Mathematics
teaching in South African schools often follows a strongly teacher-centred intra-mathematical
conception, and students have severe shortcomings in basic mathematics skills (compare the
TIMSS findings in Reddy et al., 2020). That is why such a study was regarded as particularly
interesting, challenging, and revealing insofar as for most South African students both a
student-centred teaching style (like MI) and mathematical modelling would be new. Accord-
ingly, our research questions were as follows:
How do (1a) the modelling competency and (1b) the mathematical competency of first
year engineering students as well as (2) the students’ attitudes towards mathematical
modelling develop through a mathematical modelling unit, taught according to two
different styles? In particular: Will the method-integrative style (MI) yield higher prog-
ress in mathematical modelling and in attitudes than the teacher-directive style (TD)?
Taking into account the environment of the study, a beginners’ engineering mathematics
course, modelling competency refers to the students’ ability to solve modelling tasks (not yet
with specific engineering contexts) at the pre-calculus level. Mathematical competency refers
to the students’ ability to handle the mathematical knowledge which is required in the intra-
mathematical step when solving such modelling tasks.
The results of the studies quoted in Section 3 suggest, on the one hand, the expectation that
the two teaching styles have similar effects for mathematics but that the MI-style yields bigger
progress for modelling and for the attitudes. On the other hand, an advantage of the MI-style in
modelling seems unreasonable because of the South African students’ unfamiliarity with self-
regulated teaching methods. So, we expected that the advantage of self-regulated working is
compensated by the additional mental effort the students will need to get used to an unfamiliar
method within a relatively short period of time. Concerning attitudes, we expected, analogous
to former South African studies such as Durandt (2018), that the participants perceive
modelling activities as challenging and difficult, but also interesting, and that they do not
see their value in a short period, regardless of the teaching method. Thus, our hypotheses
related to the research question were as follows:Durandt R. et al.
Ad (1): We expect (a) slight progress in mathematical modelling and (b) substantial
progress in mathematics with no significant differences (α = .05) between the two
teaching styles.
Ad (2): We expect no significant differences (α = .05) between the two teaching styles in
attitudes towards modelling, and descriptively rather negative than positive attitudes
towards the difficulty and the value of modelling.
5 Methodology
5.1 Sample
Our study was carried out in 2019 in a South African university with 144 first year
engineering students in an extended curriculum programme as part of their formal educa-
tion. These students were randomly assigned to three distinct class groups MI, TD1, and
TD2, not more than 50 each, and exposed to a mathematical modelling teaching unit in
their first semester (during February & March). The language of instruction was English
for all groups. A total of 48.4% of the group MI were female, and 16.1% of students
speaking English as their home language, while the groups TD consisted of 37.2%
females, and 11.6% students with English as their home language (other languages spoken
are African, such as Zulu). The participation in the whole study was voluntary, standard
departmental ethical matters were addressed, and students from the different groups were
not penalised in their formal course results by the results of the modelling unit.
5.2 Research design
In order to investigate the teaching and learning of mathematical modelling at the
tertiary level with respect to principles of quality teaching, we applied a classical
study design. The intervention started with a diagnostic entrance test, informed by the
South African mathematics school curriculum (CAPS, see Department of Basic
Education, 2011), by prior knowledge components for calculus (see Stewart, 2016)
and the content of the planned course. A few weeks later, a pre-test was administered,
followed by a modelling unit with five lessons which included ten different modelling
tasks (see Section 5.3), and at the end a post-test and a questionnaire on attitudes
towards mathematical modelling (see Sections 5.4 and 5.5).
Analogous to the teacher-guided (“directive”) and the independence-oriented
(“method-integrative”) style from the DISUM project (see Section 3), two different
teaching styles were distinguished in the modelling unit. The more traditional teacher-
guided style, here referred to as teacher-directive (TD) design, is very common in
everyday mathematics classrooms in many countries and also well known in the South
African context at the tertiary level. The key principles of the teacher-directive style
are as follows:
& Development of common solution patterns for the tasks, guided by the teacher;
& Changing systematically between whole-class teaching (oriented towards the “average
student”) and students’ individual work in exercises with similar tasks.Fostering mathematical modelling competency of South African engineering ...
The core features of the method-integrative (MI) style are as follows:
& Teacher’s guidance aiming at students’ active and independent work on tasks, maintaining
a permanent balance between teacher’s guidance and students’ independence, and encour-
aging individual solutions (see Section 3, dimensions b and c);
& Realising that balance by adaptive teacher interventions, in particular strategic interven-
tions (see Section 3, dimension c);
& Changing systematically between independent work in groups and whole-class activities
(for the presentation, discussion, and comparison of students’ solutions and for retrospec-
tive reflections);
& Students’ work on tasks supported by the “Solution Plan” as a meta-cognitive aid (see
Section 3, dimension d).
In the second lesson, the lecturer demonstrated how to solve modelling tasks by using
the “Solution Plan” (in a task where the growth of trees was modelled).
In addition, the criteria for effective classroom management such as clear lesson structure or
recognisable separation of learning and assessment (see Section 3, dimension a) were explic-
itly considered in both teaching styles, and the mathematical substance of the content (see
Section 3, dimension e) was ensured in both styles by the tasks treated in the unit as well as by
individual practicing.
5.3 Treatment implementation
In both designs, all students received identical tasks in the same order during implementation,
and the time for treating the tasks was also identical. The content of the five lessons (45 min
each) was as follows.
Lesson 1: The first of three tasks contained the problem of how much air is in a balloon
shown on a picture with a base jumper on top (see Herget & Torres-Skoumal, 2007). The
other two tasks were interpretations of given real-life graphs (temperature of a hot water
tap and weight of a person, from Stewart, 2016).
Lesson 2: In the first example, the growth of the diameter of trees was modelled, based on
a given table (from Stewart et al., 2012). The second example dealt with the evacuation of
an aircraft, taken from Haines et al. (2001), where the best out of five given sets of
relevant variables had to be identified.
Lessons 3 and 4: A more complex task was treated extensively, the problem of what the
optimal speed is for dense traffic on a one lane road (see Niss & Blum, 2020, chapter 3).
Lesson 5: Four tasks were treated, first the problem to approximate how tall a giant would
be to fit the world’s biggest shoes (2.37 m by 5.29 m) given on a photo, and then,
similarly, to estimate the height of a man’s statue whose foot was shown. The two
remaining smaller tasks dealt with proportions.
Each lesson in both designs was planned in detail by the first two authors of this paper. Additional
steps were taken as control measures during implementation, such as discussions between the
lecturers before and after every lesson regarding the particular teaching design for the group,
possible task solutions, and appropriate teacher actions. The lecturers also compiled in-class notesDurandt R. et al.
for record keeping on every lesson. Apart from minor everyday logistical problems (e.g., student
transport problems), the implementation of the modelling unit went according to plan.
In order to allow direct comparisons between the two teaching designs regardless of the
lecturer’s competencies, two of the three groups (TD1 and MI) were taught by the same
lecturer (the first author of this paper). She was experienced in teaching both mathematics and
mathematical modelling, while the lecturer for the group TD2 was experienced in teaching
mathematics but inexperienced in teaching modelling. The second lecturer was trained in
teaching modelling by the first author in a few contact sessions before the unit started, and in
joint meetings before each lesson. Further data on the lecturers could not be gathered (for a
discussion of the teacher variable, see Section 7).
5.4 Instruments for competencies
The entrance test, as a diagnosis of basic competencies from school relevant for the course,
consists of 25 tasks (32 items with 38 marks) from the content areas algebra, geometry,
functions, trigonometry, calculus, and modelling. In case the average entrance competencies of
the three groups should be different, the results of the entrance test were to be considered as a
covariate in the analyses.
The pre- and the post-test were specifically designed for this project and aligned with the
modelling unit (see Table 1). Both tests contained three sections, of which the tasks in the first
two were adapted from other studies by the researchers:
(i) Section A with open modelling tasks that aligned with lessons 1, 2, and 5 from the
modelling unit (such as estimating the weight of a container, see Fig. 3, or identifying a
suitable function which approximately models a given data set),
(ii) Section B with intra-mathematical tasks of varying complexity, with topics relevant for
the modelling unit’s lessons 2, 3, and 4 (such as identifying direct or inverse propor-
tionality, or analysing a given rational function),
(iii) Section C with multiple-choice modelling tasks (where, for a given real world situation,
the best model or the best set of variables among five given options had to be identified),
selected from the well-known test of Haines et al. (2001), aligned with lesson 2 from the
modelling unit.
For each test section, two versions with parallel items were constructed (for sections A and B)
or selected (for section C), whose contexts differ only slightly (e.g., pre-test question A1 with a
cylindrical beer container and post-test question A1’ with a straw roll), allowing a comparison
A1. In the picture you can see a container full of beer. Beer
weighs 1.05 kg per litre.
What is the approximate weight of the beer in this container?
Explain your solution.
Fig. 3 Modelling item from the pre-test (section A)Fostering mathematical modelling competency of South African engineering ...
Table 1 Pre- and post-test design, and alignment with the modelling unit
Section Number of Pre-test and post-test (versions 1 & 2) Alignment with
tasks/items modelling unit
A: Modelling tasks 2/2 Modelling tasks with pictures (Beer Container Lessons 1 & 5
or Straw Roll) resp. with given data resp. lesson 2
B: Mathematical tasks 3/6 Mathematical tasks including proportional, Lessons 2, 3 & 4
linear and rational functions
C: Multiple-choice tasks 5/5 Multiple-choice modelling tasks Lesson 2
of the results. While the tasks in section B were intended to assess students’ mathematical
competency, the items in sections A and C were to assess students’ modelling competency.
Sections A and C remain separate also in the analysis because the multiple-choice items are
different in that they do not require to construct a model but to analyse a given model (compare
the definition in Section 2). To evaluate the task solutions, especially of items with an open
response format, a differentiated coding manual was prepared. It not only indicates which
solution is correct, but also provides detailed descriptions, concrete criteria, and illustrative
examples for judging if a solution is incorrect or correct (0/1) or how to assign marks for items
with several marks (0/1/2).
All tests were administered under the supervision of the first author and took place
during regular course hours (45 min) a few weeks before, at the beginning, and at the end
of the modelling unit, respectively. No formulary was allowed in the tests. The use of
calculators was required and allowed for the modelling section in the entrance test as
well as for the entire pre- and post-tests. In the pre-test, the same items were used in
sections A and B for all participants, and in the post-test, their parallel versions were
used. In section C, both versions of the items were used in both tests. Thus, there were
two versions 1/2 of the pre-test and two versions 1/2 of the post-test. The two pre-test
versions were randomly and equally distributed to each group of students. In the post-
test, each student received the other test version (i.e., pre1/post2 or pre2/post1) so that
altogether each student had to solve both versions of all items. Figure 4 shows the design
just described, where apostrophes indicate parallel versions of items. By mistake, group
TD1 received only version 1 of the pre-test, so only one version of section C, and hence
later only version 2 of the post-test. The researchers did not expect this inaccuracy to be
problematic because of the parallel items in each test version; however, the results
indicated some non-negligible effect stemming from section C (see Section 6.1).
Fig. 4 Pre- and post-test design with parallel itemsDurandt R. et al.
Table 2 Example items per aspect in SATMM
Aspects Number of items Example items
Affect 6 I am scared of mathematical modelling.*
Cognitive competence 6 I can learn mathematical modelling.
Value 9 Mathematical modelling should be a required part of my
professional training.
Difficulty 7 Mathematical modelling is highly technical.*
Interest 4 I am interested in using mathematical modelling.
Effort 4 I plan to/did attend every mathematical modelling class session.
*Negatively worded items were reverse-coded (1 becomes 7, 2 becomes 6, etc.).
5.5 Instrument for attitudes
Concerning mathematical modelling, we considered six attitudinal dimensions as par-
ticularly important (described in Section 2), and we found an appropriate instrument
containing these dimensions, the internationally recognised Survey of Attitudes To-
wards Statistics (SATS-36). Schau et al. (1995) originally introduced SATS-28
consisting of 28 items separated among four dimensions: affect, cognitive competence,
value, and difficulty. Later, two additional dimensions were added: interest and effort
(see Schau, 2003). In this study, we decided to adapt SATS-36 towards mathematical
modelling (denoted by SATMM) and thus to construct corresponding items to deter-
mine students’ attitudes towards mathematical modelling. An additional reason for this
decision was that SATS-36 has already been used locally by the first author (see van
Appel & Durandt, 2018). The SATMM consists of 36 questions (19 items reverse
coded) and responses were measured on a 7-point rating scale where higher scores
show a more positive attitude (1 = strongly disagree, 4 = neither disagree nor agree,
7 = strongly agree). Table 2 shows the six dimensions and an example item for each
dimension. The attitudes towards mathematical modelling were electronically collected
via the university’s online student portal at the end of the intervention.
5.6 Data processing and analysis
Not all students (N = 144) were able to participate in every performance test, so that the
number of participants differed slightly between the tests. However, the proportion of missing
values is low (entrance test 7.6%, pre-test 3.5%, post-test 2.1%); they will not be replaced in
the following analyses. In the SATMM questionnaire, it was not possible to assign a
participant code for data protection reasons, and as only 59 students took part in this online
survey, the group membership was distinguished between MI and TD only. Therefore, the data
on modelling competency and the questionnaire unfortunately cannot be linked.
After estimating the internal consistencies of all scales using McDonald’s Omega
(McDonald, 1999), sum scores were calculated for each section of the performance test as
well as overall. According to the dimensions of attitudes towards mathematical modelling, all
items of the SATMM were aggregated to scales by averaging. All data (pre-)processing and
further analyses for both the performance test and the SATMM were conducted using the
statistical software R (R Core Team, 2020) with additional packages (e.g., “multilevel”, Bliese,Fostering mathematical modelling competency of South African engineering ...
2016, or “lme4”, Bates et al., 2015). The underlying data sets and analysis scripts used are
available online at https://osf.io/bxsud.
To examine the effects of the teaching intervention, four linear mixed regression
models with dummy-coded predictor variables were created that take into account the
longitudinal data structure nested by participants (for intraclass correlations, see Tables 4
and 5). These models have several advantages: They can handle missing values at
different time points without excluding entire cases, have superior statistical power even
for small sample sizes, as well as less stringent requirements compared to conventional
methods (e.g., mixed ANOVAs), prevent the accumulation of type I errors, and can
consider (pre-)existing differences between groups or test versions (see Hilbert et al.,
2019). Therefore, the time variable (pre-test versus post-test), the indicator variable for
the version (1 or 2) of test part C, and the grouping variable (MI, TD1, TD2) were
dummy-coded (0/1) with TD2 as reference group for design-based reasons. This makes
the results of these models easy to interpret: According to the research questions, the
interactions model the most interesting differences in performance change of the other
two groups compared to that of TD2 (over time or/and test version).
6 Results
6.1 Development of competencies
As can be seen from Table 3, the values of McDonald’s Omega are satisfactory for the entrance,
pre- and post-test as a whole (ω ≥ .59), but relatively low for their single sections, as expected,
because they cover heterogeneous topics of the modelling unit with only a few items (Table 3).
For psychometric reasons (i.e., constant values, negative correlations with the respective scales,
non-equivalence), two items had to be removed from the entrance test and two items from
section C. That was contrary to our expectation, especially with regard to the two multiple-
choice modelling items in section C (Haines et al., 2001), but a retrospective analysis revealed
obvious differences between the seemingly parallel items (which have not been reported in the
literature so far). For instance, one item, where the question is “which of five given objects can
pass beneath a high voltage cable”, allowed a superficial solution strategy and thus was much
easier. After removing this and another item from section C, the two test versions with three
remaining items are more comparable than before, but not absolutely equivalent. Version 1 is
still at all times slightly more difficult than version 2 (see Table 3). This favours group TD1
which only received one test version, the easier one, in the post-test.
Due to significant group mean differences in the entrance test (F(2, 130) = 3.30, p = .04), its
total score was considered as a covariate and controlled for in the subsequent linear mixed
models. Regarding the sum score of test section A (modelling tasks) as dependent variable,
model A in Table 4 does not only show a significant gain in mathematical modelling
competency between pre- and post-test by TD2 (b = .69). Rather, MI and TD1 have significant
additional increases (b = .80 resp. b = .98), and the proportion of variance explained by model
A is good. With reference to research question 1a, these results, which are also visualised in
Fig. 5a, indicate that, under the respective learning conditions, the modelling competency of
groups MI and TD1 grows more than two times as much as that of group TD2. This isDurandt R. et al.
Table 3 Internal consistencies (McDonald’s ω) per test (section), means (M), and standard deviations (SD) per
group and test (section)
Test (section) Number Internal Group
of items consistency (Nentrance = 133/Npre = 139/Npost = 141)
TD1 TD2 MI
(48/44/46) (44/49/48) (41/46/47)
Omega (ω) M (SD) M (SD) M (SD)
Entrance test 30 .79 12.65 (5.59) 10.23 (5.48) 12.98 (5.28)
Pre-test (total) 11 .59 7.09 (2.86) 6.59 (1.84) 7.22 (2.65)
A: Modelling tasks 2 .17 1.09 (1.25) .45 (.71) 1.07 (1.31)
B: Mathematical tasks 6 .48 3.41 (1.54) 3.61 (1.26) 3.67 (1.52)
C: Multiple-choice tasks (version 1) 3 .43 2.59 (1.53) 2.28 (1.28) 2.09 (1.31)
C: Multiple-choice tasks (version 2) 3 .41 – 2.79 (1.35) 2.87 (1.60)
Post-test (total) 11 .60 10.11 (2.68) 9.08 (2.73) 10.89 (2.69)
A: Modelling tasks 2 .19 2.65 (1.77) 1.10 (1.29) 2.64 (1.63)
B: Mathematical tasks 6 .49 4.35 (1.34) 4.98 (1.26) 5.17 (1.42)
C: Multiple-choice tasks (version 1) 3 .38 – 2.62 (1.61) 2.71 (1.16)
C: Multiple-choice tasks (version 2) 3 .40 3.11 (1.23) 3.38 (1.01) 3.48 (1.31)
Because of the satisfying interrater reliability in about one-third of the sample in a first double coding by two
skilled raters (Cohen’s κ ≥ .72), the remaining cases were only coded by one of the two raters for economic
reasons
therefore not in line with our hypothesis 1a, but concerning MI in particular, it is similar to the
results of the DISUM study.
A second linear mixed model with regard to section B (mathematical tasks; see Table 4,
model B) focuses on research question 1b. The competency gain of TD2 is significant
(b = 1.36) and, as expected (hypothesis 1b), the increase of groups MI (b = .04) and TD1
(b = –.43) deviates only slightly and not significantly from that (similar to the results of
DISUM). Figure 5b illustrates this situation; the variance explained by model B is acceptable.
A third mixed model for test section C (multiple-choice modelling questions; Table 5,
model C) additionally considers the parallel versions of the simultaneously used items. In
accordance with hypothesis 1a, it shows no significant result and only descriptively a low,
nearly equivalent competency increase for all groups (see Fig. 5c). So, the proportion of
variance explained in the dependent variable is low (Table 5). This could be due to the fact that
after shortening the scale of section C, the number of remaining multiple-choice items was too
small, their closed task format perhaps unsuitable or their content not sufficiently adapted to
the modelling unit to record a corresponding increase in competency (see Section 7).
Finally, the results of the complete test are depicted in Fig. 5d for each group and
analysed in a fourth mixed model, namely model D in Table 5 (again considering the
different test versions). In comparison to the competency growth of the reference group
TD2 (b = 1.05), MI shows significant additional increases in both versions (1, b = 2.10;
2, b = 2.71), while the gain of TD1 (just version 2 at post-test; b = 2.82) is mixed with a
test version effect, as further analyses suggest. Taking this limitation into account, MI
therefore not only tends to perform slightly better than TD1 in the post-test (see Fig. 5d),
but in particular significantly better than TD2 (Table 5), and shows a significant
improvement in competency, mainly due to the learning intervention. This is similar to
the results of DISUM, but contrary to the assumption in our hypothesis 1a that the
competency progress does not differ between both teaching styles.Fostering mathematical modelling competency of South African engineering ...
Table 4 Linear mixed regression model for test section A (modelling tasks) and test section B (mathematical
tasks) considering the longitudinal data structure nested by participants
Model A (modelling tasks) Model B (mathematical tasks)
N | Obs. | ICC 128 252 7.82% 128 252 13.93%
b SE t p b SE t p
Intercept .12 .27 .43 .66 3.18 .28 11.23 < .01
Entrance test score .03 .02 1.96 .05 .04 .02 2.03 .04
Group TD1 .60 .29 2.04 .04 –.20 .30 –.66 .51
Group MI .60 .30 1.98 .05 .06 .31 .18 .86
Time .69 .27 2.58 .01 1.36 .25 5.49 < .01
Group TD1 × time .98 .38 2.60 .01 –.43 .35 –1.24 .22
Group MI × time .80 .39 2.06 .04 .04 .36 .11 .92
marg. R2 | cond. R2 .30 .41 .20 .45
N sample size, Obs. number of observations, ICC intraclass correlation, b (unstandardised) regression coefficient,
SE standard error, t t-value, p probability of committing a type I error, p ≤ .05 significant, R2 coefficient of
determination
Fig. 5 a Line graph for modelling tasks. b Line graph for mathematical tasks. c Line graph for multiple-choice
tasks. d Line graph for the complete testDurandt R. et al.
Table 5 Linear mixed regression model for test section C (multiple-choice modelling tasks) and the complete
test considering the longitudinal data structure nested by participants
Model C (multiple-choice tasks) Model D (complete test)
N | Obs. | ICC 128 252 < .01% 128 252 16.13%
b SE t p b SE t p
Intercept 2.10 .33 6.32 < .01 5.94 .62 9.64 < .01
Entrance test score .02 .02 1.19 .23 .09 .03 2.76 < .01
Group TD1 .27 .35 .77 .44 .17 .64 .27 .79
Group MI –.07 .43 –.15 .88 .01 .78 .01 .99
Test version .39 .41 .94 .35 –.67 .75 –.89 .37
Test version × group TD1 –.52 .50 –1.04 .30 –.07 .84 –.09 .93
Test version × group MI .10 .60 .16 .87 1.30 1.09 1.19 .24
Time .15 .41 .36 .72 1.05 .75 1.40 .16
Time × test version .52 .59 .89 .37 2.82 1.15 2.45 .02
Time × group MI .21 .60 .34 .73 2.10 1.09 1.93 .05
Time × test version × group MI –.14 .85 –.17 .87 –2.21 1.67 –1.33 .19
marg. R2 | cond. R2 .08 .08 .34 .44
N sample size, Obs. number of observations, ICC intraclass correlation, b (unstandardised) regression coefficient,
SE standard error, t t-value, p probability of committing a type I error, p ≤ .05 significant, R2 coefficient of
determination
6.2 Attitudes towards mathematical modelling after intervention
Regarding SATMM, the internal consistencies of the six corresponding scales were
estimated, using again McDonald’s Omega, and are overall acceptable, although the
reliability of the fourth aspect difficulty is relatively low (see Table 6). In an item analysis,
item 22 (“MM is a subject quickly learned by most people”) shows a rather small, but not
negative corrected item-scale-correlation. However, omitting this item from the scale
would have only marginally increased the value of McDonald’s Omega. For this reason,
content considerations, and because lower levels of internal consistency were also mea-
sured for the difficulty dimension in other studies (van Appel & Durandt, 2018; Vanhoof
et al., 2011), the item was retained. In subsequent studies, the scale is to be checked again
on a larger sample (see Section 7).
Table 6 Descriptive statistics and t-tests between groups TD versus group MI from SATMM
Attitude aspect Internal consistency Groups TD (n = 36) Group MI (n = 23) t-test
Omega (ω) Min Max M (SD) Min Max M (SD) t(57) p
Affect .70 2.33 6.00 4.50 (.80) 3.00 5.83 4.36 (.96) .59 .55
Cognitive competence .60 3.00 6.17 4.81 (.74) 3.33 6.00 5.00 (.71) –.98 .33
Value .64 3.44 6.00 4.88 (.64) 3.56 5.78 4.98 (.64) –.61 .54
Difficulty .44 1.43 4.71 2.85 (.66) 2.00 4.57 3.17 (.62) –1.90 .06
Interest .73 2.25 7.00 5.87 (1.03) 4.25 7.00 5.91 (.96) –.17 .87
Effort .63 5.00 7.00 6.67 (.52) 6.00 7.00 6.77 (.33) –.86 .39
7-point rating scale: 1 = strongly disagree, 7 = strongly agree, Min minimum, Max maximum, M mean, SD
standard deviation, t t-value, p probability of committing a type I error, p ≤ .05 significantFostering mathematical modelling competency of South African engineering ...
As can be seen in Table 6 and with regard to the underlying 7-point rating scale,
descriptive statistics reveal neutral attitudes for both groups in terms of affect, cognitive
competence, and value. The two groups have more negative attitudes in terms of difficulty,
although the MI group was slightly more positive than the TD groups (MTD = 2.85 versus
MMI = 3.17, t(57) = –1.90, p = .06). For the dimensions interest and effort, both groups
show more positive attitudes. T-tests revealed no significant difference between the
attitudes towards mathematical modelling between the TD groups and the MI group,
although for five from six aspects (except affect), the MI group descriptively experienced
more positive attitudes than the TD groups. Considering the reduced sample size, the small
differences may also be due to a positive selection of participants from all three groups but
overall, they are in line with our second hypothesis.
7 Discussion, perspectives, and limitations
The purpose of this study, carried out in 2019, was to enhance the teaching and learning of
mathematical modelling at the tertiary level, guided by principles of quality teaching. First year
engineering mathematics students in a South African university were exposed to a modelling
unit following two different teaching styles, oriented towards the “method-integrative” and the
“directive” style in the German DISUM project. While the first teaching style aimed at students’
independent work, supported by adaptive teacher interventions and by a meta-cognitive tool,
and encouraged individual solutions, the teaching according to the second style developed
common solutions guided by the teacher. The results of this study, also considering some
limitations in the design (relatively low number of items per test section, interchanged test
versions), indicate that implementing essential aspects of quality teaching might be a promising
approach also for the tertiary level, thus complementing the results of the DISUM study. Both
teaching designs, implemented by specifically trained lecturers, had effects, but for the devel-
opment of mathematical modelling competency, the method-integrative teaching style appeared
to be more favourable, analogous to DISUM but contrary to our cautious hypothesis. The MI
group significantly outperformed both TD groups in the whole test group TD2, and group TD1
more than descriptively, considering its substantial advantage of an easier test version in the
post-test. Also, the more positive attitudes of the MI group seem promising for learning
modelling. Thus, our study suggests a link between success in mathematical modelling and
positive attitudes (compare Chamberlin, 2019), although this could not be formally confirmed
due to the lack of technical possibilities to collect individual data and link the samples. This is a
limitation of the study and could be investigated in a follow-up study. These encouraging results
may have consequences for engineering education as well as for teacher education in South
Africa (see Durandt & Lautenbach, 2020; Jacobs & Durandt, 2017). In the future, more such
studies are needed which repeat certain elements of existing studies and change others in order
to better understand which influence certain variables have and to what extent empirical results
may be generalised beyond the specific circumstances (compare Niss & Blum, 2020, chapter 8).
An interesting result is that the two TD groups, both instructed according to the directive
teaching style but with different lecturers, had distinctly different learning gains. Although the one
researcher fulfilled the dual role of researcher and lecturer, which might be regarded as a limitation
of the study, the different roles were consciously balanced and standard ethical protocols were
followed. Corresponding with other results (e.g., COACTIV, see Kunter et al., 2013, or TEDS-M,
see Blömeke & Kaiser, 2014), the teacher variable seems important also at the tertiary level andDurandt R. et al.
for teaching modelling. This aspect should be further investigated, for instance by taking into
account the lecturers’ professional competencies as a variable. However, this requires new
instruments specifically geared towards teaching competencies relevant for the tertiary level.
From a normative point of view, the test results are rather weak, so there is certainly lots of
potential for further improvement. To a considerable extent, these disappointing results are
certainly due to unsatisfactory entrance qualifications of the students, and we know from research
that mathematics preparation has a considerable effect on mathematics performance (e.g., Sonnert
et al., 2020). An influencing factor could also be that the students had to work in English, which
for most of them is not their home language (see Section 3). We know from several studies (see,
e.g., Plath & Leiß, 2018) how important language proficiency is for understanding the context of a
modelling task and thus for building an appropriate situation model. This aspect should be further
investigated in similar multilingual environments. Apart from that, there is also room for a further
improvement of the teaching design. The students’ progress during the unit was rather small also
because five lessons can offer only limited possibilities. De Villiers and Wessels (2020) report a
similarly slow progress of South African engineering students’ competency development over an
intervention with six modelling tasks. One possibility is therefore to extend the duration of the
teaching unit and to include both more tasks and more phases for individual practising, with and
eventually without teacher support. Another possibility is to link the modelling examples more
closely to engineering topics and to those South African students’ life contexts, a limitation of our
study that should definitely be addressed in future studies.
On a more general level, the goal of our study was to gain more empirical insights into
opportunities and problems concerning the learning and teaching of mathematical modelling,
and particularly on measuring the modelling competencies of first semester students. The
number of such studies has certainly substantially increased during the last two decades (see
Niss & Blum, 2020, for an overview), but still we need much more. Our study has shown that an
approach where the teacher aims at a balance between students’ independent work and teacher
guidance, using strategic support, does not only yield promising results for the students’
modelling competency development at the lower secondary but also at the tertiary level.
Code availability (software application) All analyses were conducted with the statistical software (R Core
Team, 2020). The corresponding code is available at https://osf.io/bxsud (https://doi.org/10.17605/OSF.IO/
BXSUD).
Authors’ contributions All authors contributed to the study and agree with the content and give explicit
consent to submit this work for publication.
Funding Open Access funding enabled and organized by Projekt DEAL. Funding for the continuation of this
project has been approved by the National Research Foundation of South Africa for the period 2020 – 2022
(Grant number 121969).
Data Availability Some materials and results of this intervention study were presented at the International
Conference on the Teaching of Mathematical Modelling and Applications (ICTMA-19) in 2019 in Hong Kong.
The datasets presented in this study can be found in the online repository Open Science Framework https://osf.io/
bxsud (https://doi.org/10.17605/OSF.IO/BXSUD).
Declarations
Conflict of interest The authors declare that the research was conducted in the absence of any commercial or
financial relationships that could be construed as a potential conflict of interest.You can also read