ImageCLEF2018: Transfer Learning for Deep Learning with CNN for Tuberculosis Classification
←
→
Page content transcription
If your browser does not render page correctly, please read the page content below
ImageCLEF2018: Transfer Learning for Deep Learning
with CNN for Tuberculosis Classification
Amilcare Gentili1-2[0000-0002-5623-7512]
1 San Diego VA Health Care System, San Diego, CA USA
2 University of California, San Diego, CA, USA
agentili@ucsd.edu
Abstract. The diagnosis of Multi Drug Resistant (MDR) tuberculosis is chal-
lenging. We present our method for classifying whether a patient has MDR tu-
berculosis or drug sensitive (DS) tuberculosis based on a CT scan of that person's
chest, which achieved the best accuracy and the second-best AUC at the Im-
ageCLEF 2018 Tuberculosis - MDR detection task. Our approach consists of
reformatting the images in the coronal plane, converting them to png format and
using transfer learning to train a ResNext 50 convolutional neural network to
classify images as MDR or DS tuberculosis.
Keywords: Deep Learning, Convolutional Neural Network, Tuberculosis, Mul-
tidrug-resistant Tuberculosis, CT Scans.
1. Introduction
Tuberculosis is still a common disease and the diagnosis of Multi Drug Resistant
(MDR) tuberculosis is challenging. It is difficult for radiologists to distinguish between
MDR and Drug Sensitive (DS) tuberculosis and there is inconsistency in the literature
on which radiographic features are useful. For instance, presence of lymph node calci-
fications is associated with MDR in some papers and with DS in other [1-5]. The main
objective of the ImageCLEF tuberculosis task is to provide tuberculosis severity scores
based on automatic analysis of lung CT images of patients. Being able to extract this
information from image data alone can allow for more limited lung washing and labor-
atory analyses to determine tuberculosis type and drug resistances. This can lead to
quicker decisions on best treatment strategies, reduced use of antibiotics, and lower
impact on patients.[6]
2. Methods
The data set provided for the ImageCLEF 2018 Tuberculosis - MDR detection task
included 259 patients in the training set and 236 patients for the test set [7]. See Table
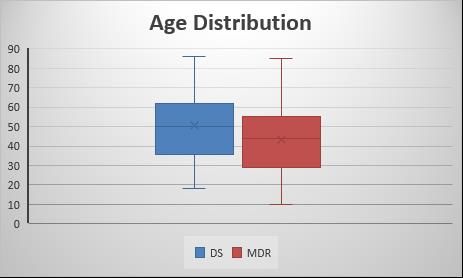
1.Table 1. Number of patients per class in the multi-drug resistance dataset. Num. Patients Train Test DS 134 99 MDR 125 137 Total patients 259 236 As reported in the literature[5, 8], patients with MDR tuberculosis were younger, mean age 43.6 ±17.17SD vs 50.7 ±18, applying the Student's t–test for two samples, this difference was significant with p
images containing areas of abnormal lung. Although we did not visually verify the im-
ages of this data set, tuberculosis usually involves the upper lobes with relative sparing
of the lung bases. As a result, axial images through the lung bases could possibly be
normal even in patient with severe disease in the upper lobes, so we chose to use the
coronal plane since a larger proportion of images should contain abnormal areas. As
med2image did not take in consideration slice thickness, the reconstructed coronal im-
ages were deformed and of different height. To correct this problem all images were
resized to a 512 x 512 matrix. Image masks for the lungs were available, but were not
used. To exclude chest walls and still include a significant portion of the lungs, of the
512 coronal images obtained for each patient only images 150 to 350 were utilized for
training — image 150 was the most posterior and 350 the most anterior image utilized.
All image equalization and data augmentation was done at the time of the training using
the fastai library [9].

2.2.   Neural Network Training

For training of the CNN, we rented from Paperport a cloud virtual machine with 8
CPUs, Quadro P5000 GPU, 30 GB RAM, and 500 GB solid state drive created using
the fast.ai public template. We took advantage of the fastai library to perform transfer
training of ResNext 50 [10] convolutional neural network.

For training the CNN an image size of 64 x 64 was utilized. The learning rate was
determined after running the learning rate finder function and plotting the learning rate
vs. loss. See Figure 2.
Fig. 2. LEARNING RATE VS. LOSS

After reviewing this curve, a learning rate of 0.002 was selected for the last layers. The
last layers were trained for 2 epochs without data augmentation, then were trained for
2 additional epochs using data augmentation. For data augmentation, we used random
rotations of up to 10 degrees in each direction, random changes of intensity of up to
5%, and random horizontal flipping (but no vertical flipping) based on the assumption
that right and left lung are similar, but upper and lower lobes are different. Subsequently
all layers were unfrozen and trained for an additional 3 epochs using a different learning
rate for different layers. The final layer learning rate was kept at 0.002, but the learning
rate for the middle layers was one third of the last layers and the initial layers learning
rate was one ninth of the last layers. Same augmentation used at training time was also
used at test time, and the average of 4 augmented images was used for each test image.
    As we had analyzed each image separately, we had 200 different results for each
patient, so we averaged the results of the 200 images of each patient. As expected, using
the average decreased the probability of MDR tuberculosis as some of the images were
including only normal or less abnormal lungs. As the number of patients with MDR
was known, the probability was manually rescaled in Microsoft Excel before submis-
sion to provide the correct number of positive and negative MDR cases and to use the
entire probability range from 0 to 1.

3.     Results

When each image is scored individually, patients with MDR tuberculosis have a sig-
nificant number of images scored as not MDR tuberculosis. This can be explained by
the fact that significant pathology necessary to make the diagnosis of MDR tuberculosis
may not be present in all images.
In the final table of results, the submitted run for MDR detection task was ranked first
for accuracy among the 39 submitted runs with a prediction accuracy of 0.6144 and
second for area under ROC-curve (AUC) equal 0.6114 on the test image dataset[7].
The best result in terms of AUC value was achieved by VISTA@UEvora team and
resulted in AUC = 0.6178.
Table 1. Subtask 1 - Multi-drug resistance detection results
Run Accuracy Rank Ac- AUC Rank
curacy AUC
MDSTest1a.csv 0.6144 1 0.6114 2
MDR_HOG_std_euclidean_TST.csv 0.5932 2 0.5205 23
MDR-Run-09-Sk-SL-F10-Personal.txt 0.5763 3 0.5921 4
MDR_FlattenCNN_DTree.txt 0.572 4 0.581 6
MDR_FlattenCNN2_DTree.txt 0.572 5 0.581 7
MDR_HOG_AllCols_euclidean_TST.csv 0.572 6 0.4693 36
MDR_Flatten.txt 0.5678 7 0.5637 12
MDR-Run-06-Mohan-SL-F3-Personal.txt 0.5593 8 0.6178 1
MDR-Run-10-Mix-voteLdaSl-F7-Personal.txt 0.5593 9 0.5824 5
MDR_Conv68adam_fl.txt 0.5593 10 0.5768 8
MDR_Flatten3.txt 0.5593 11 0.5575 13
MDR_Riesz_std_correlation_TST.csv 0.5593 12 0.5237 22
MDR_MultiInputCNN.txt 0.5551 13 0.5274 20
MDR_HOG_mean_correlation_TST.csv 0.5551 14 0.4941 30
MDR_Conv48sgd_fl.txt 0.5508 15 0.5424 17
MDR_Conv48sgd.txt 0.5466 16 0.564 11
MDR-Run-08-Mohan-voteLdaSmoF7-Personal.txt 0.5424 17 0.6065 3
MDR-Run-07-Sk-LDA-F7-Personal.txt 0.5424 18 0.573 9
MDR_AllFeats_std_euclidean_TST.csv 0.5424 19 0.5039 27
testSVM_SMOTE.csv 0.5339 20 0.5509 15
MDR_Riesz_mean_euclidean_TST.csv 0.5297 21 0.4824 33
MDR_Riesz_AllCols_correlation_TST.csv 0.5212 22 0.4855 31
testOpticalFlowFull.csv 0.5169 23 0.4845 32
testOpticalFlowwFrequencyNormalized.csv 0.5127 24 0.5473 16
MDR_FlattenX.txt 0.5127 25 0.5322 19
MDR_CustomCNN_DTree.txt 0.5085 26 0.5346 18
MDR_AllFeats_AllCols_correlation_TST.csv 0.5085 27 0.4568 38
MDR-Run-01-sk-LDA.txt 0.5042 28 0.526 21
DecisionTree25v2.csv 0.5 29 0.5049 26
MDR-Run-05-Mohan-RF-F3I650.txt 0.4958 30 0.5116 24
testOFFullVersion2.csv 0.4958 31 0.4971 29
MDRBaseline0.csv 0.4873 32 0.5669 10
MDR_AllFeats_std_correlation_TST.csv 0.4873 33 0.5095 25
testFrequency.csv 0.4788 34 0.4781 34
MDR-Run-06-Sk-SL.txt 0.4619 35 0.4661 37
MDR_run_TBdescs2_zparts3_thrprob50_rf150.csv 0.4576 36 0.5558 14
MDRLIST.txt 0.4576 37 0.5029 28
MDR-Run-04-Mix-Vote-L-RT-RF.txt 0.4576 38 0.4494 39
testflowI.csv 0.4492 39 0.474 354. Analysis of the Results
Although we achieved the best accuracy and second-best AUC, to be clinically useful
automatic detection of MDR need to further improve. Accuracy and AUC in the 0.61
range cannot be relied upon by the treating physician.
5. Perspectives for Future work
Due to the competition’s time contrains, several shortcuts were implemented: arbi-
trary selection of coronal images 150 to 350, conversion of images to png format, av-
eraging results of single slices of each patient. A better selection of images containing
the lungs or even better, the abnormal portion of the lungs/mediastinum, may improve
results. Using Hounsfield units from the original images, instead of values in the png
files may also be more accurate. Instead of averaging the results of single images and
rescaling the results, utilizing a more robust approach to combining results from multi-
ple images from the same patient may also help — possibilities to consider include
using an SVM[11] or an RNN [12].
6. Conclusion
In this paper, we presented the use of transfer learning to quickly train a CNN to
achieve the best accuracy and second-best AUC at the ImageCLEF 2018 Tuberculosis
- MDR detection task[7]. It also achieved better results than all submission at the Im-
ageCLEF 2017 Tuberculosis - MDR detection task.
References
1. Li, D., et al., Primary multidrug-resistant tuberculosis versus drug-sensitive tuberculosis in
non-HIV-infected patients: Comparisons of CT findings. PLoS One, 2017. 12(6): p.
e0176354.
2. Kahkouee, S., et al., Multidrug resistant tuberculosis versus non-tuberculous mycobacterial
infections: a CT-scan challenge. Braz J Infect Dis, 2013. 17(2): p. 137-42.
3. Lee, E.S., et al., Computed tomography features of extensively drug-resistant pulmonary
tuberculosis in non-HIV-infected patients. J Comput Assist Tomogr, 2010. 34(4): p. 559-63.
4. Yeom, J.A., et al., Imaging findings of primary multidrug-resistant tuberculosis: a
comparison with findings of drug-sensitive tuberculosis. J Comput Assist Tomogr, 2009.
33(6): p. 956-60.
5. Cha, J., et al., Radiological findings of extensively drug-resistant pulmonary tuberculosis in
non-AIDS adults: comparisons with findings of multidrug-resistant and drug-sensitive
tuberculosis. Korean J Radiol, 2009. 10(3): p. 207-16.6. Bogdan, I., et al., Overview of ImageCLEF 2018 : Challenges, Datasets and Evaluation.
Proceedings of the Ninth International Conference of the CLEF Association (CLEF 2018),
2018.
7. Yashin Dicente Cid, V.L., Vassili Kovalev, Henning Müller, Overview of
ImageCLEFtuberculosis 2018 - Detecting multi-drug resistance, classifying tuberculosis
type, and assessing severity score. CLEF2018 Working Notes, 2018.
8. Chung, M.J., et al., Drug-sensitive tuberculosis, multidrug-resistant tuberculosis, and
nontuberculous mycobacterial pulmonary disease in nonAIDS adults: comparisons of thin-
section CT findings. Eur Radiol, 2006. 16(9): p. 1934-41.
9. Howard, J.a.o., fastai. GitHub, 2018.
10. Saining Xie, R.B.G., Piotr Doll, Kaiming He, Aggregated Residual Transformations for
Deep Neural Networks. CoRR, 2016. abs/1611.05431.
11. Gao, X.W. and Y. Qian, Prediction of Multidrug-Resistant TB from CT Pulmonary Images
Based on Deep Learning Techniques. Mol Pharm, 2018.
12. Sun, J., Chong, P., Tan, Y.X.M., Binder, A., : ImageCLEF 2017: ImageCLEF tuberculosis
task - the SGEast submission. CLEF2017 Working Notes. CEUR Workshop Proceedings,
2017.You can also read