Portable Air Cleaner Test Report - The Built Environment ...
←
→
Page content transcription
If your browser does not render page correctly, please read the page content below
Portable Air Cleaner Test Report
 Blueair 211+ Portable Air Purifier: Impact of Ionizer
 August 2021

 Yicheng Zeng, Mohammad Heidarinejad, PhD, and Brent Stephens, PhD
 Built Environment Research Group
 Department of Civil, Architectural, and Environmental Engineering
 Illinois Institute of Technology
 http://built-envi.com/portfolio/air-cleaner-testing

Test Description
As a result of recent global indoor air quality challenges, including the infiltration of smoke from
historically large wildfires in the U.S. (Xu et al., 2020) and the increasing recognition of the potential
for aerosol transmission of COVID-19 in poorly ventilated indoor environments (CDC, 2020), there
has been an unprecedented level of interest and investment in indoor air cleaning technologies.
Here we report on controlled test chamber measurements conducted at the Illinois Institute of
Technology to measure the pollutant removal efficacy of a Blueair 211+ portable air purifier. The
product uses a combination of particle filtration and gas-phase (carbon) media,1 as well as small
ionizers integrated into the product.2 The product has been tested by AHAM to have a clean air
delivery rate (CADR) of 350 cfm for all three particle size ranges in the test and to meet AHAM ozone
(O3) emission limits of less than 50 ppb in a test chamber.3
Measurements included CADR characterizations for particulate matter ranging from 0.01 to 10+ µm
in diameter following injection of incense and dust, both with and without the ionizer disabled, as well
as measurements of negative ion concentrations during normal operation in the chamber (i.e.,
without pollutant injection) and with the ionizer disabled.

Measurement Description
Tests were conducted in a large aluminum environmental chamber (interior volume of 1296 ft3). The
unit was first tested in January 2021 4 and again in August 2021. The chamber is served by a
recirculating air handling unit connected via a flexible aluminum duct, capable of recirculating
between ~150 and ~200 cfm. Surrounding laboratory air enters unfiltered via infiltration through the
chamber, air handler, and ductwork, typically around 1.9-2.0 air changes per hour (ACH) with the
surrounding laboratory. A small mixing fan was operated in the chamber to encouraging mixing.

1
 https://www.blueair.com/ca/air-purifiers/blue-pure-211-plus/1695.html
2
 https://www.bestbuy.com/site/questions/blueair-blue-pure-211-540-sq-ft-air-purifier-white/5892131/question/03fa97d5-19ab-3cf7-
bee4-1bd11a504b73
3
 https://www.ahamdir.com/room-air-cleaners/
4
 http://built-envi.com/wp-content/uploads/IIT-CADR-Testing-February-2021.pdf
 1
Pollutant Removal Efficacy Testing
Pollutant removal efficacy testing involved measuring the CADR for each air cleaner using a pollutant
injection and decay method (Offermann et al., 1985; MacIntosh et al., 2008; US EPA, 2018). The
CADR is a measure of how much pollutant-free air an air cleaner provides, reported in units of airflow
rate (e.g., cubic feet per minute, or cfm). The CADR is traditionally measured for particulate matter
but can also be measured for other types of airborne pollutants (Howard-Reed et al., 2008). Three
particle size ranges are commonly tested in the widely used ANSI/AHAM AC-1 Test Standard,
Method for Measuring the Performance of Portable Household Electric Room Air Cleaners: tobacco
smoke (0.09-1 µm), dust (0.5-3 µm), and pollen (5-10 µm).
Pollutant injection was achieved by burning incense to generate particles primarily in the ‘smoke’
and ‘dust’ size ranges and shaking a vacuum cleaner bag filled with vacuumed dust to generate
particles primarily in the ‘pollen’ size range (Stephens and Siegel, 2012). Burning incense also
generates numerous gaseous pollutants (e.g., carbonyls, carbon monoxide, nitrogen oxides, and
VOCs (Lee and Wang, 2004)) that may be used to estimate CADR for the measured gas-phase
pollutants. Ozone was also detected as a product of incense burning, likely due to reactions between
NOx and VOCs (Hsu et al., 2019). Only loss rate data for particulate matter are analyzed here.
Testing was first conducted with the air cleaner turned on either during or immediately after pollutant
injection completed. This allowed for estimating the decay rate of pollutants with the air cleaner
turned on, which includes losses due to the ‘natural’ (i.e., background) decay due to deposition to
surfaces, ventilation/infiltration, etc., plus the effect of the air cleaner operating. After pollutant
concentrations (Ct) mixed and then decayed from the initial mixed peak (C0) towards background
levels in the chamber (Cbg), the air cleaner was turned off to reach a new chamber background (Cbg),
and then pollutant injection was repeated and pollutant concentrations were allowed to decay with
the air cleaner turned off to characterize only the ‘natural’ (i.e., background) decay rate.
A linear regression is used to estimate pollutant loss rates (K) under air cleaner on (Kac) and off (Knat)
conditions:
 !",$ − &'
 − = ×
 !",$() − &'

The CADR is calculated as the difference between the two loss rates multiplied by the interior
chamber volume:
 CADR = V×(Kac - Knat)
 Where: V = volume of the test chamber (ft3)
 Kac = total decay rate with air cleaner on (1/min)
 Knat = natural decay rate with air cleaner off (1/min)
 t = time from the beginning of the decay period (min)

 2
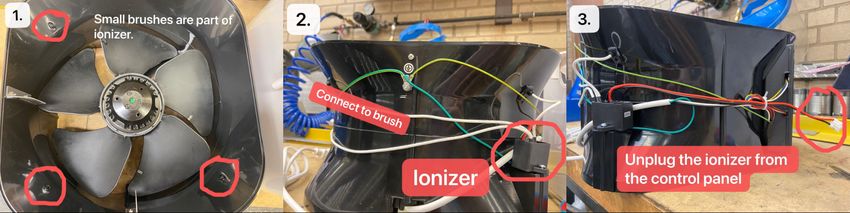
Measurement Equipment Used
 1. TSI NanoScan SMPS 3910 for ultrafine particle number concentrations
 2. TSI OPS 3330 and MetOne GT-256S OPC for 0.3-10+ µm particle number concentrations
 3. Aeroqual Portable Handheld Air Quality Monitor for TVOC concentrations
 4. 2B Technologies Models 211 and 405 for ozone and NOx concentrations, respectively
 5. Extech SD800 CO2 monitors to assess air change rates
 6. AlphaLab Air Ion Counter

Test Conditions
The air cleaner was placed on a table in the chamber and tested once on the highest fan speed
setting. The first test was conducted with the unit new out of the box in January 2021. A second
round of testing was conducted in August 2021 with another new unit out of the box, once to
characterize ion concentrations during normal operation (i.e., without pollutant injection) in the
chamber, and then again using injection and decay tests to characterize the CADR for particulate
matter but with the ionizer function disabled (see Figure 1).

 Figure 1. Steps taken to disable ionizer during the second round of testing

Example Test Data: Particle Injection and Decay
An example of resulting time-series test data is shown below for particles in the ‘smoke’ size range
during injection and decay measurements (i) during normal operation (January 2021) and (ii) during
operation with the ionizer disabled (August 2021).

Figure 2. Example time-series test data from ‘smoke’ size particle injection and decay tests
 3
Example Test Data: Ion Concentrations
Figure 3 shows a time-series profile of negative ion concentrations measured with the unit operating
in the test chamber without any pollutant injection. At 17:45, the air cleaner, located on the table,
was turned on and operated normally (i.e., with ionizers enabled). The ion counter was located on
the table as well. A large burst of negative ions was observed, briefly reaching >250,000 ions/cm3
and then decreasing to ~50,000 ions/cm3. At 18:05, the air cleaner was moved to the floor to increase
the distance between the air cleaner outlet and the ion measurement location. Ion concentrations
then averaged approximately -21,700 ions/cm3 (standard deviation of 8,440 ions/cm3) during the
next ~30 minutes of operation. The air cleaner was then switched off at 18:43. The product was
switched on again at 19:12, but with the ionizer disconnected, and there was no subsequent increase
in ion concentrations.

Figure 3. Time-series ion concentrations measured in the chamber during normal operation
 (i.e., no pollutant injection) first with the ionizer enabled (default condition) and then with
 the ionizer disabled

Example Test Data: Pollutant Loss Rate Estimates
Examples of resulting estimates of particle loss rates during air cleaner on and off conditions, with
and without the ionizer enabled, for particles in the ‘smoke’ size range are shown in Figure 4.

 Figure 4. Example of estimated loss rate constants
 4
Summary of Results
Table 1 shows results from CADR tests for the smoke (0.09-1 µm), dust (0.5-3 µm), and pollen (5-
10+ µm) size ranges, both during normal operation (ionizer enabled) and with the ionizer disabled.

 Table 1. CADR test results for three particle size ranges
 Normal Operation Ionizer Disabled
 % Difference
 Kac Knat CADR Kac Knat CADR in CADR
 Particle Metric (1/min) (1/min) (cfm) (1/min) (1/min) (cfm)
 Smoke (0.09-1 µm) 0.2498 0.0300 285 0.1603 0.0380 159 -44%
 Dust (0.5-3 µm) 0.2670 0.0285 309 0.2340 0.0414 250 -19%
 Pollen (5-10+ µm) 0.3473 0.0475 389 0.2455 0.1055 181 -53%

The CADR for smoke, dust, and pollen particle size ranges during normal operation (with the ionizer
enabled) were estimated to be 285, 309, and 389 CFM, respectively.

The CADR for smoke, dust, and pollen particle size ranges during operation with the ionizer disabled
were estimated to be 159, 250, and 181 CFM, respectively, representing 44%, 19%, and 53%
reductions in CADR compared to normal operation.

Based on these results, we estimate that between ~20% to ~50% of the measured CADR during
normal operation may be attributable to the ionizer function, which was observed to increase
negative ion concentrations from an average of less than 2000 ions/cm3 to over 20,000 ions/cm3 in
the test chamber.

Given the potential for ionization technologies to initiate indoor chemical reactions (Kim et al., 2017;
Zeng et al., 2021), further testing should characterize the impact of this device on gas-phase organic
compounds (e.g., VOCs, aldehydes, etc.).

References Cited
CDC, 2020. Scientific Brief: SARS-CoV-2 and Potential Airborne Transmission. Coronavirus
 Disease 2019 (COVID-19). URL https://www.cdc.gov/coronavirus/2019-ncov/more/scientific-
 brief-sars-cov-2.html
Howard-Reed, C., Nabinger, S.J., Emmerich, S.J., 2008. Characterizing gaseous air cleaner
 performance in the field. Building and Environment 43, 368–377.
 https://doi.org/10.1016/j.buildenv.2006.03.020
Hsu, C.-Y., Wu, J.-Y., Chen, Y.-C., Chen, N.-T., Chen, M.-J., Pan, W.-C., Lung, S.-C.C., Guo, Y.L.,
 Wu, C.-D., 2019. Asian Culturally Specific Predictors in a Large-Scale Land Use Regression
 Model to Predict Spatial-Temporal Variability of Ozone Concentration. IJERPH 16, 1300.
 https://doi.org/10.3390/ijerph16071300
Kim, K.-H., Szulejko, J.E., Kumar, P., Kwon, E.E., Adelodun, A.A., Reddy, P.A.K., 2017. Air
 ionization as a control technology for off-gas emissions of volatile organic compounds.
 Environmental Pollution 225, 729–743. https://doi.org/10.1016/j.envpol.2017.03.026
Lee, S.-C., Wang, B., 2004. Characteristics of emissions of air pollutants from burning of incense in
 a large environmental chamber. Atmospheric Environment 38, 941–951.
 https://doi.org/10.1016/j.atmosenv.2003.11.002

 5
MacIntosh, D.L., Myatt, T.A., Ludwig, J.F., Baker, B.J., Suh, H.H., Spengler, J.D., 2008. Whole
 house particle removal and clean air delivery rates for in-duct and portable ventilation
 systems. J Air Waste Manag Assoc 58, 1474–1482.
Offermann, F.J., Sextro, R.G., Fisk, W.J., Grimsrud, D.T., Nazaroff, W.W., Nero, A.V., Revzan,
 K.L., Yater, J., 1985. Control of respirable particles in indoor air with portable air cleaners.
 Atmospheric Environment 19, 1761–1771. https://doi.org/10.1016/0004-6981(85)90003-4
Stephens, B., Siegel, J.A., 2012. Comparison of test methods for determining the particle removal
 efficiency of filters in residential and light-commercial central HVAC systems. Aerosol
 Science and Technology 46, 504–513. https://doi.org/10.1080/02786826.2011.642825
US EPA, 2018. Residential Air Cleaners: A Technical Summary, 3rd edition.
Xu, R., Yu, P., Abramson, M.J., Johnston, F.H., Samet, J.M., Bell, M.L., Haines, A., Ebi, K.L., Li,
 S., Guo, Y., 2020. Wildfires, Global Climate Change, and Human Health. N Engl J Med
 NEJMsr2028985. https://doi.org/10.1056/NEJMsr2028985
Zeng, Y., Manwatkar, P., Laguerre, A., Beke, M., Kang, I., Ali, A.S., Farmer, D.K., Gall, E.T.,
 Heidarinejad, M., Stephens, B., 2021. Evaluating a commercially available in-duct bipolar
 ionization device for pollutant removal and potential byproduct formation. Building and
 Environment 195, 107750. https://doi.org/10.1016/j.buildenv.2021.107750

 6
You can also read