IWRA (India) - International Water ...
←
→
Page content transcription
If your browser does not render page correctly, please read the page content below

ISSN : 2277-1298 (Print)
                                                          ISSN : 2277-1301 (Online)

IWRA
IWRA

                                        (India)
                                                     JOURNAL
           Half Yearly Technical Journal of Indian Geographical Committee of IWRA

       Wish you a Very Happy & Prosperous New Year 2021

                                            Vol. 10 = No. 1 = January 2021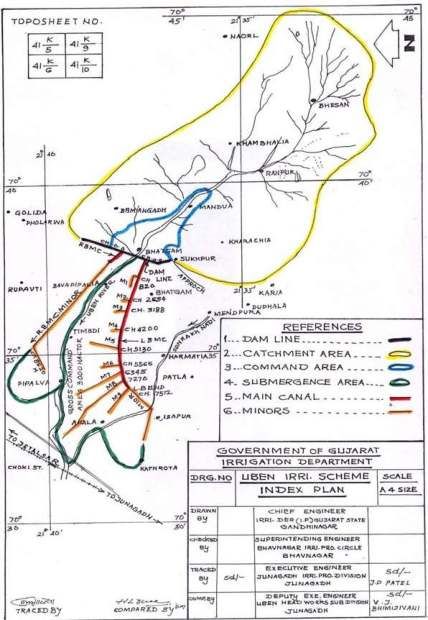
ABOUT JOURNAL

 Water is among the most precious gifts of the nature to mankind. Benign and life supporting in
 normal times, menacing during floods, and desperately sought in times of drought, the waters
 of the rivers, aquifers, springs, lakes, etc., have been part of our daily life. However, with the
 growing requirements of water for diverse purposes, water is becoming a critical and scarce natural
 resource and can not be regarded as available in abundance as might had been believed earlier.
 It is widely recognized that many countries are entering into era of severe water shortage. The
 increase is not only due to population growth but also due to improved life style of the people.

    The dramatic expansion of urbanized areas, which has been witnessed over the last few decades
    is likely to continue in most countries of the world. Such, often unplanned, growth leading to the
    emergence of conurbation and mega cities, poses a threat to both the availability and quality
    of surface and groundwater resources. These threats are both unprecedented and of immense
    scale when viewed from political, social and economic perspectives.

    The aim of the journal is to provide latest information in regard to developments taking place in
    the field of water resources, besides making aware the readers about the activities being carried
    out in the field of Water Resources, worldwide, such as technical papers, R&D Activities, and
    information regarding conferences, training programmes and important news.

                                      EDITORIAL BOARD

•     Prof. Ngai Weng Chan, Former Vice President, IWRA, and Professor, School of Humanities, University
      Sains, MALAYSIA
•     Mr. M. Gopalakrishnan, Hon. Secretary General, International Commission on Irrigation and Drainage,
      INDIA
•     Prof. A.K. Gosain, Department of Civil Engineering, Indian Institute of Technology Delhi, INDIA
•     Dr. Naim Haie, Department of Civil Engineering, University of Minho, PORTUGAL
•     Prof. S.K. Mazumder, Former Professor, Department of Civil Engineering, Delhi College of Engineering
      (now Delhi Technological University), INDIA
•     Dr. T.B.S. Rajput, Emeritus Professor, Water Technology Centre, Indian Agricultural Research Institute,
      INDIA
•     Mr. Tom Soo, Former Executive Director, International Water Resources Association
•     Dr. Cecilia Tortajada, Past President, IWRA, and Vice President, Third World Center for Water
      Management, MEXICO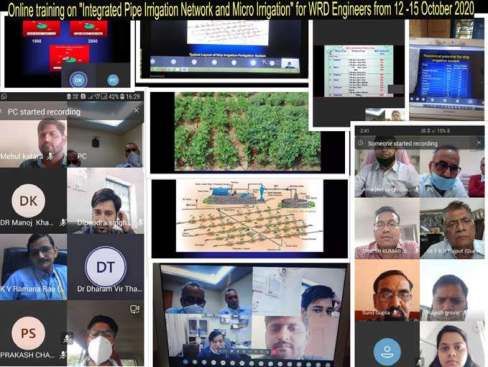
INDIAN GEOGRAPHICAL COMMITTEE Of IWRA

                                      IWRA (India) Journal
Volume 10, No. 1                                                                                                          January 2021

                                                        CONTENTS
                                                                                                                                   Page No.
    fROM EDITOR’S DESK
    Articles
    •     Reward from Right Decision at Right Time – A Case Study of Uben Irrigation Project – Dr. D.K. Dobariya                               3
    •     Assessment of Groundwater Vulnerability to Pollution by using GIS based DRASTIC Model in Delhi Region –
          Tapasya Tomer and Deeksha Katyal                                                                                                     8
    •     Bioremediation of Textile Dye Effluent – A Sustainable Approach – Kriti Akansha                                                    12
    •     Common and Emerging Aspects of Water Quality and its Public Health Impacts – Dr Girija K Bharat and
          Avanti Roy-Basu                                                                                                                    18
    •     Climate Changes Impact on Southwest Monsoon Rainfall Pattern Over River Basins of India –
          Pulak Guhathakurta and Nilesh Wagh                                                                                                 26
    •     Impact Assessment of On-site Sanitation System on the Quality of Groundwater in Sandysoil of Periurban
          Area of Bangalore City, Karnataka, India - A Case Study – Shivendra. B.T And Kiran D A                                             33
    •     NDWI and Hydrogeomorphology in Attaining Optimization Of Water Reseources In Pendurthi Mandal,
          Vishakhapatnam District, Andhra Pradesh, India Using Sentinnel Data-2 – Dr. Usha Chirala and Bhavana Pedada                        39
    Activities of Indian Geographical Committee of IWRA                                                                                       46
    IWRA News                                                                                                                                 51
    About International Water Resources Association (IWRA)                                                                                    55

Editor
•       Mr. A.K. Dinkar, Member Secretary Indian Geographical Committee of IWRA and Secretary, Central Board of Irrigation &
        Power (CBIP)
•       Dr. G.P. Patel, Treasurer, Indian Geographical Committee of IWRA and Director (WR) Central Board of Irrigation and
        Power (CBIP)
Associate Editor
•       Mr. Uday Chander, Chief Manager, Central Board of Irrigation and Power (CBIP)

All communications to be addressed to :
The Member Secretary
Indian Geographical Committee of IWRA, CBIP Building, Malcha Marg, Chanakyapuri, New Delhi 110 021

                                                                       Disclaimer : The opinions expressed in this journal are those of the
    Subscription Information 2021/ (2 issues)
                                                                       authors. They do not purport to reflect the opinions or views of the Indian
    Institutional subscription (Print & Online) : Rs. 900/US$75        Geographical Committee of IWRA or its members. Reproduction of
    Institutional subscription (Online Only)    : Rs. 600/US$50        the material contained in this journal may be made only with the written
                                                                       permission of the Publications Manager. Although every effort is made
    Institutional subscription (Print Only)     : Rs. 600/US$50        to ensure the correctness of information submitted for publication, the
                                                                       journal may inadvertently contain technical inaccuracies or typographical
    Subscription for 10 Years (Print)             : Rs. 5,000          errors. Indian Geographical Committee of IWRA assumes no responsibility
    Subscription for 10 Years (Print & Online)    : Rs. 8,000          for errors or omissions in this publication or other documents that are
                                                                       referenced by or linked to this publication.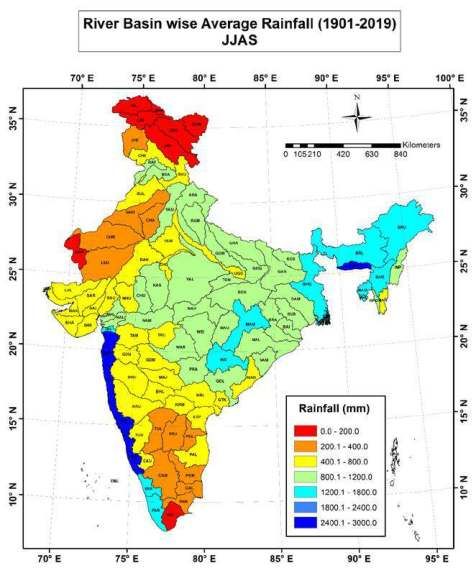
From the Editor’s Desk
First of all, I take this opportunity to wish all the members and readers a Very Happy
and Prosperous New Year.
With the support of all of you, the journal has entered into 10th year of its publication,
and the Nineteenth issue of the journal is now in your hands. I thank all the readers
for their feedback about the journal. The feedback from all the quarters has given us
the encouragement to our initiative and to bring out a quality journal.
The global spread of COVID-19 coronavirus has infected millions of people around
the world, and is continuing at a faster pace. At the moment, it’s a challenge to contain
the pathogen. This crisis is experienced directly by some and indirectly by all of us.
We have to fight together this pandemic and come back stronger as this is the need of the hour. In this
new COVID-19 situation, skill enhancement and training of professional has emerged as a very important
aspect and a challenge.
Considering the pandemic scenario, Indian Geographical Committee of IWRA (IGC-IWRA), in association
of Central Board of Irrigation and Power, the Secretariat of IGC-IWRA, organised series of Webinars
on Integrated Water Resources Management, Micro Irrigation for Improving Water Use Efficiency and
Planning & Design of Piped Irrigation Network, in the year 2020, keeping in view of limited availability
of water resources and rising demand for water, which has acquired critical importance for Sustainable
Management of Water Resources.
Water conservation is a key element of any strategy that aims to alleviate the water scarcity crisis in India.
As drought-like conditions have gripped many parts of India, the pressure to drill borewells in search of
increasingly scarce groundwater has escalated. Many regions are in the grip of a vicious cycle of drilling
causing the water table to sink further. There is an urgent need to explore what benefits water conservation
can bring, whether through modern or ancient water storage structures.
Construction of water harvesting structures, mass awareness among citizens for water conservation,
construction of new water storage structures, interlinking of rivers, renovation and repair of existing water
bodies are commonly recommended measures to mitigate drought effect. History tells us that both floods
and droughts were regular phenomena in ancient India. Perhaps this is why every region in the country
has its own traditional water harvesting techniques that reflect the geographical peculiarities and cultural
uniqueness of the regions. The basic concept underlying all these techniques is that rain should be
harvested whenever and wherever it falls.
Archaeological evidence shows that the practice of water conservation is deep rooted in the science
of ancient India. Excavations show that the cities of the Indus Valley Civilisation had excellent systems
of water harvesting and drainage. Even today, there is a valid logic in considering these ancient but
dependable alternatives to rejuvenate depleted groundwater aquifers. With government support, these
structures could be upgraded and productively combined with modern rainwater-saving techniques such
as anicuts, percolation tanks, injection wells and subsurface barriers. Storage of surface rain water and
rainwater saving techniques has their own role to play.
A.K. Dinkar
Member Secretary
Indian Geographical Committee of IWRA
volume 10 No. 1 January 2021 2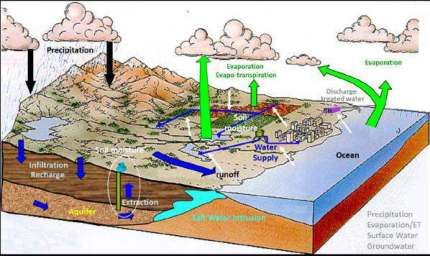
Reward from Right Decision at Right Time –
A Case Study of Uben Irrigation Project
Dr. D.K. Dobariya
Retd. Associate Professor (Agronomy) & Resource Person,
Water and Land Management Institute, Anand, (Gujarat), India
INTRODUCTION runoff for filling the reservoir. In Uben Irrigation Project
Uben Irrigation Project is a World Bank aided Project only 47.46 Mcft water was available against its capacity
situated near village Bhatgam of BhesanTaluka in of 572 Mcft. Even less than 10 % water was available in
Junagadh District of Gujarat State. Total CCA of the small reservoir. During this period due to water scarcity
project is 2500 Ha, which is already developed with fully in entire Gujarat, the Govt. has issued a circular to all
lined distribution system extending up to 8 Ha. Block District Collector that no body will allow to use the water
to serve entire command. In the entire command area, for irrigation from public water bodies viz, river, tank,
the measuring devices viz., ramp flume, proportional small reservoir etc. As per national water policy Govt.
flow divider and other efficient structures are provided has decided that the water should be reserved for drinking
for implementing the Rotational Water Supply (RWS) purpose as first priority and hence the circular was issued.
system. Committees such as farmers committee, chak In Uben irrigation command area Cotton and Groundnut
and sub-chak level committee for introduction of RWS crops were occupied majority areas. During October, no
were formed initially but now entire command has been rainfall was there and even no water available in most of
hand over to 11 WUAs and recently they have also formed the wells / tube wells of farmers. Cotton and Groundnut
federation of 11 WUAs. Index plan of Uben Project is crops suffers due to moisture stress in soil. If one
given in Figure 1. irrigation is to be supplied by canal, there was a chance
to increased crop yield just double. But initiallyCollector
The Brief Salient Feature of Uben Irrigation Project are was dis-agree to release water from Uben Irrigation
as under Project for irrigation purpose as he has having strong
1. Total C.C.A. : 2500 Ha. circular of GOG.
2. Total No. of Farmers : 1200 Nos. ACTION INITIATED BY f ARMERS
3. Gross Storage at FRL : 16.20 Mcm. However, Uben command area’s farmers are habituated
4. Dead Storage at OSL : 0.60 Mcm. to irrigate the field by Rotational Water Supply System
with high with high Water Use Efficiency since the year
5. Live Storage at F.R.L. : 15.60 Mcm.
1987. All the farmers are very co-operative, no any rules
6. Evaporation & Seepage losses : 5.71 Mcm. violation and no any internal conflicts for water distribution
7. Design Cropping intensity : Kharif : 94.50 % amongst farmers. Since 2007 farmers are joined in
PIM by forming 11 WUAs. All the presidents of WUAs
Rabi : 15.00 %
and other farmers were assemble and made a detailed
8. Principle Crops : Kharif :Groundnut proposal to Collector for water demand in consideration
Rabi : Wheat of following points :
The irrigation was started from Kharif 1986 and thereafter, 1. Uben Irrigation Project has no any domestic water
strictly RWS system was enforced and water has been supply scheme at present.
released as per pre-determined canal operation plan. 2. No water is needed for domestic purpose surrounding
After continuous efforts made by Irrigation Department area of Uben Project upto end of April month.
and WALMI, farmers co-operation were achieved for
3. Small quantity (only less then 10%) of water could
adopting canal operation plan and RWS system.
not be retain in reservoir upto end of April month due
PREAMBLE to evaporation and seepage losses.
In the changing climate since last 20 years,Gujarat 4. Cotton and Groundnut crops requires water just
receiving good rainfall except few years. In the year in a week because there were a critical stages for
2014-15, in kharif season in entire Gujarat rainfall was irrigating the crop fields (in cotton – boll formation
very less particularly during end of the kharifseason. and in Groundnut – Pod development stage).
Even during initial period of kharif season rainfall was 5. If boththe crops to be supplied water, there was a
just adequate to crop water requirement but no to much chance to increase the crop yield just double.
3 volume 10 No. 1 January 2021
4 IWRA (India) Journal
fig. 1 : Index Plan of Uebn Irrigation Project
volume 10 No. 1 January 2021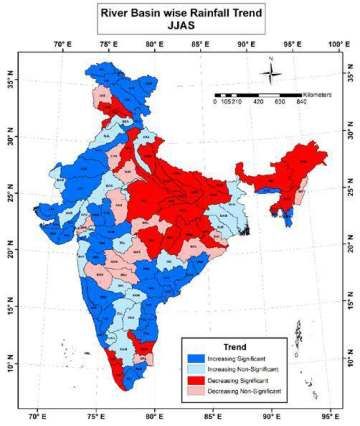
Reward from Right Decision at Right Time – A Case Study of Uben Irrigation Project 5
Considering abovepoints the proposal was submitted The details of water demand and water rates collection
to the District Collector through the concerned Irrigation is given in Table 1. The figures of Table-1 indicate that
Engineer with their recommendation. DistrictCollector from 8 villages 532 farmers has demanded water for 842
has review the proposal and he has realized the water ha. against that irrigation department has sanctioned 829
demand ofUben farmers and immediately he has ha. area for one irrigation only. WUAs has collected
sanctioned the proposal and grant the permission to advance water rates amounting Rs. 2,84538=00 i.e. 100
release water from Uben Irrigation Project for irrigating % recovery. It is a general principal that taking and giving
the Cotton and Groundnut crops. The date-wise events :farmers has demanded water, Govt. has demanded water
are as under : charges and co-operation from farmers.
Date Events Farmers has paid 100 % water charges in two days
and it is a cumulative effectsof last 28 years of culture
04-10-2014 Federation of 11 WUAs has made
developed viz; co-operation, co-ordination, un-selfish
proposal for water demand to the
mentality etc. This environment created by continuous
District Collector through Irrigation
efforts of WALMI, Central Design Organizations,
Department.
Agriculture Deptt. and Irrigation officers.
05-10-2014 District Collector has granted permission
The time allocation schedule for tail minor No.10 is given
for releasing water from Uben Project
in Table 2, which reflect that 24 hours are equal (day &
for irrigation.
night) for irrigation. Normally in most of the irrigation
08-10-2014 A meeting of Uben Federation was projects farmers are hesitate or not taking to much care
arranged in which 11 WUAs presidents for efficient water use during right time but in Uben Project
and another 24 members remained such problems not observed since last 28 years.
present for plan-out water distribution
and likely area to be irrigate. RESULT & DISCUSSION :
08-10-2014 to Collected water demand forms from (a) Area covered: During rotation period, 35.94 Mcft
12-10-2014 farmers through11 WUAs with water water was released from reservoir and 829 ha. Area
rate collection in advance. could be irrigated in which 70 % area under Cotton
crop & 30 % area under Groundnut crop.
Side by side farmers had resolves
weeds, silts from canal network and (b) Crop productivity : Crop productivity data given in
make a clean canal for running water Table 3 indicates that crop yield could be increase just
smoothly with minimum losses. double. 1500 Kg/ha. Groundnut could be produced
with one irrigation against 625 Kg/ha without
12-10-2014 to Irrigation department’s dedicated staff
irrigation. 1250 Kg/h. Cotton could be produced with
13-10-2014 has started preparing canal irrigation
one irrigation against 700 Kg/ha. without irrigation.
schedule, water allocation schedule
By this way farmers of 6 villages got additional
from evening of 12-10-2014 considering
benefits of Rs. 20385625 = 00 against water rates of
forms received upto 12-10-2014
Rs. 284538. That means by only paying 1.39% water
evening.
rates additional amount gained by farmers about
By morning 13-10-2014 the time Rs. 2 crores.
allocation schedule were ready due to (c) Water Productivity : Water Productivity is a ratio
use of computer in irrigation sector. of Rs. gained to water release from HR. In this
All the farmers were intimated for their case 35.34 Mcft water i.e. 1000850 M3 water was
turn for irrigation upto evening of 13- released for irrigating the crop in area of 829 ha.
10-2014. which produced addition income of Rs. 20385625=00
14-10-2014 Early morning water was release from over un-irrigated crop. Data given in Table 4 shows
Uben Project to canal network and that water productivity comes about Rs. 20.37 / M3
upto 1400 hrs. canal network was of water which is a very high as compare to other
filled up with water and after that all irrigation project where it will comes harly about 10-
the 11 minors has started irrigation 12 Rs./ M3
and farmers got water one by one as (d) Water Use Efficiency : It is a ratio of water supplied
per pre-determine schedule even in all to field against released from HR. The data given in
water courses (outlets). Table 4 indicates that the duty comes about 23.46 ha
volume 10 No. 1 January 2021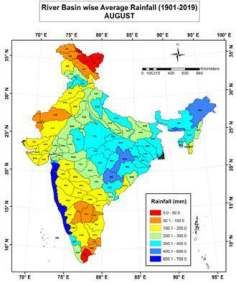
6 IWRA (India) Journal
Table 1 : The details of water demand & water collection rates.
Sr. Name of No. of Area in ha. as per Amount of water charge paid by
No. village Irrigator farmers in advance (in Rs.)
7/12 Sanctioned Water Local fund Total Amount
record area rates
1 Bava Piplava 70 82.45 82.45 23581 4717 28298
2 Arab Timdi 211 398.50 394.24 113033 22602 135635
3 Piplava 158 229.86 220.63 63093 12625 75718
4 Dedrava 4 9.90 9.90 2831 566 3397
5 Akala 88 119.70 118.89 33998 6798 40796
6 Choki 1 2.02 2.02 578 116 694
7 Ishapur 0 0 0 0 0 0
8 Kathrota 0 0 0 0 0 0
Total 532 842.43 829.13 237114 47424 284538
Table 2 : The time allocation schedule for tail minor No.10.
Sr. Name of Irrigators Survey Land Land Allotted Rotation period (date & time)
No. No. area as area time in
per 7/12 sanct- Hrs. Water supply Water supply
record ioned started closed
Date Time Date Time
1 Nanduben Popatbhai 63/2 0.88 0.88 10=35 14-10-14 14=00 15-10-14 00=35
2 Savitaben Govindbhai 24 0.70 0.70 08=25 15-10-14 00=35 15-10-14 09=00
3 Arjanbhai Vallabhbhai 243/1 1.41 1.41 16=55 15-10-14 09=00 16-10-14 01=55
- Total 2.99 2.99 35=55 - - - -
Table 3 : Crop productivity& Income
Sr. Name of Irrigated Crop productivity Kg/ha. APMC Additional yield
No. crop area in Market & income due to
ha. price irrigation
Rs/Kg.
Without With Additional Total Additional
Irrigation Irrigation Productivity due yield Income in
to irrigation in Kg. Rs.
1 2 3 4 5 6=5-4 7 8=3x6 9=7x8
1 Groundnut 249 625 1500 875 35 217875 7625625
2 Cotton 580 700 1250 550 40 319000 12760000
Total 829 - - - - - 20385625
volume 10 No. 1 January 2021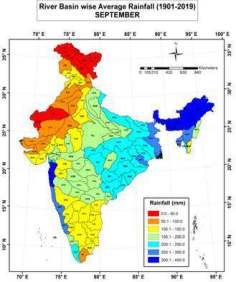
Reward from Right Decision at Right Time – A Case Study of Uben Irrigation Project 7
Table 4 : Water Productivity & Water Use Efficiency
Water release at Area Duty = Area/ Delta at Delta at field Additional Water
HR irrigated volume of HR in in mm with 67 income in productivity
in ha. water mm. % conveyance Rs. due to in Rs/M3
Mcft M3 efficiency irrigation at HR
1 2 3 4=3/1 5=2832/4 6=5x0.67 7 8=7/2
35.34 1000850 829 23.46 120 80 20385625 20.37
/ Mcft of water release from HR.120 mm. water delta CONCLUSION & LESSON LEARNED BY
received by farmers at HR and it will reach hardly fARMERS IN THIS SITUATION
80 mm. depth at field considering 67% conveyance
Now farmers has realized that crop should be irrigate with
efficiency. Any Irrigation Engineer / Agronomist can
the help of alternate furrow irrigation or Drip irrigation and
justify that even after longer dry spell in medium
day by day area under drip irrigation has been increased
black soils of Uben command area minimum 3
particularly in Cotton crop and sprinkler in Groundnut crop.
inches water depth is needed to irrigating the field.
If farmers of canal irrigated area having uniformity, co-
That means water use efficiency is very high in this
ordination and co-operation anybody can convenience to
project.
take right decision at right time.
It is a rewards from Right Decision at Right Time.
A drop of water is worth more than a
sack of gold to a thirsty man
volume 10 No. 1 January 2021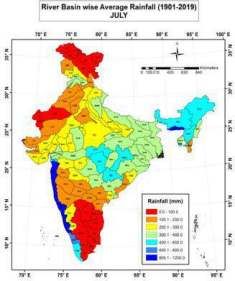
Assessment of Groundwater Vulnerability to Pollution by
using GIS based DRASTIC Model in Delhi Region
Tapasya Tomer and Deeksha Katyal
University School of Environment Management, GGSIP University, New Delhi, India
INTRODUCTION groundwater vulnerability in USA, however, it has been
Ground water is the principal resource of water for applied in many countries including Japan [10], China
drinking, agricultural, and industrial requirements. [11], Tunisia [12], and Ecuador [13]. In India, DRASTIC
Increasing population and rapid industrialization was employed in Kapgarhi catchment, West Bengal
particularly in developing countries like India, has affected [14], central Ganga plains, Uttar Pradesh [15], Loni,
the availability and quality of ground water due to over Maharashtra [16] and Mewat district, Haryana [17].
utilization and inappropriate waste management in urban The present case study is related to categorization of Delhi
areas [1] [2]. The demands of the growing population into different pollution vulnerability zones. Since the city
have also necessitated developing new methods and has limited surface water allocation for drinking purposes,
plans to conserve the available groundwater resource it is completely reliant on the groundwater to fulfill the
[3]. In this perspective, scientists and resource managers industrial, agricultural and domestic requirements. As
have sought to develop aquifer vulnerability assessment the groundwater supports major anthropogenic activity
techniques for projecting which areas are more likely to in the region, water resource management is of prime
become contaminated due to activities at or near the importance. This can be achieved through vulnerability
land surface[4]. maps which demarcate zones where it is susceptible
In general, groundwater vulnerability is the tendency to receive and transmit pollution, so that they can be
or likelihood for the contaminants to reach a specific prevented from future contamination. This study aims
location in the groundwater system after release at some to achieve two objectives of studying groundwater
location above the uppermost aquifer [5]. The concept of vulnerability to pollution through DRASTIC model.
groundwater vulnerability relates to the fact that certain OBJECTIvES
physiographic settings are inherently more vulnerable or
1. Identification of potential contaminant zones by using
sensitive to having contaminants migrate from surface
vulnerability index.
to impact ground water quality. If these areas of higher
vulnerability can be identified, then land use developments 2. Integration of data in GIS to prepare vulnerability
that pose a higher risk to the groundwater system can be maps
redirected to less sensitive areas. METHODS
After rigorous research, a variety of methodologies for DRASTIC model was used to assess the aquifer
the assessment of groundwater vulnerability to pollution vulnerability to pollution in Delhi region. The information
have been devised worldwide with different sets of about the layers of the model was provided via geographic
hydrogeological parameters and variability of parameters information system (GIS). Arc GIS 10.2.2 software was
produces different results. The most widely applied used to generate an interactive geodatabase, compile
model is DRASTIC [6] which was developed by US the geospatial data, compute the DRASTIC index and
EPA (United States Environmental Protection Agency) to generate the final vulnerability map. The methodology
as a standardized system for assessing the intrinsic followed during the study is given in Figure 1.
vulnerability of groundwater to contamination. In the same
year, Foster (1987) developed GOD model [7], a classical
DRASTIC MODEL
system for quick assessment of aquifer vulnerability to The DRASTIC model was developed by the United States
pollution. Van Stempvoort et al. (1993) employed AVI Environmental Protection Agency in 1985 [6] to evaluate
model [8] by using the thickness of aquifers and hydraulic pollution potential of groundwater for entire U.S.A.
conductivity and later Civita (1994) developed a new DRASTIC is based on the hydrogeologic setting and the
model SINTACS [9] by modifying DRASTIC. Thereafter, acronym DRASTIC stands for the seven parameters used
various improved versions of vulnerability index were to compute vulnerability index. The parameters are Depth
formulated and applied by various researchers. In to water table, net Recharge, Aquifer media, Soil media,
this study, DRASTIC was adopted for vulnerability Topography (slope percentage), Impact of the vadose
assessment. DRASTIC model was developed for zone and hydraulic Conductivity of the aquifer. The
volume 10 No. 1 January 2021 8Assessment of Groundwater Vulnerability to Pollution by using GIS based DRASTIC Model in Delhi Region 9
DATA COLLECTION DATA INPUT DATA CONVERSION
(SCANNING, MANUAL) (DIGITIZATION)
SS
DATABASE CREATION
SPATIAL DATABASE
LOCATION MAP OF WEIGHTING OVERLAY GENERATION OF THEMATIC
THE STUDY AREA PROCEDURE MAPS FOR VARIOUS
PARAMETERS
GENERATION OF
VULNERABILIY INDEX
DATA INTEGRATION
FINAL VULNERABILITY
DATA INTERPRETATION MAP
1 : Flowchart
fig.igure of overall
1: Flowchart methodology
of overall forfor
methodology groundwater
groundwatervulnerability
vulnerabilityanalysis
analysis using DRASTIC model
using DRASTIC modelinin GIS.
model employs a numerical ranking system that assigns RESULTS
relative weights and rates to various parameters that help The final vulnerability map was generated by overlying
in the evaluation of relative groundwater vulnerability to seven hydrogeological thematic layers in ArcGIS software
contamination [18]. The numerical relative rating varies and then resultant map was reclassified into four classes
from 1 to 10 and weights from 1 to 5 [2]. Table 1 indicates according to the degree of vulnerability. The DRASTIC
DRASTIC rating and weighting values according to the index obtained varies from 85 to 157 (Table 2).
various hydrogeological settings in the study area. The
final vulnerability is a weighted sum of the above seven Table 2 : Area under vulnerability to groundwater
parameters and can be computed using the following pollution in the study area
additive equation:
Sl. DRASTIC Area( in Area (in vulnerability
Di = DrDw+RrRw+ArAw+SrSw+TrTw+IrIw+CrCw (1) No. index sq km) %) zones
where w is weight factor for parameter and r is rate for 1 85-103 323.17 21.79 Low
parameters
2 104-121 506 34.12 Medium
Table 1 : Assigned weights and rates of
DRASTIC Parameters 3 122-139 381.08 25.70 High
4 140-157 272.75 18.39 Very high
Parameters Rates Weights
Total 1483 100.00
Depth to water level (D) 1,3,5,7,9 5
and 10 The results of this model revealed that about 21.79%
Net Recharge (R) 6,8 and 9 4 area was in the “low” vulnerable zone with a DRASTIC
index ranging between 85 to103 and 34.12% stretch
Aquifer Media (A) 3, 5 and 6 3
was in the “moderately” vulnerable zone with a DRASTIC
Soil Media (S) 4,5,6 and 8 2 index of 104 to 121. 25.7% area was covered under
Topography (T) 1 and 9 1 “high” vulnerability zone with a DRASTIC value between
Impact of the Vadose Zone 4 and 6 5 122 to 139 , while 18.39% of area was under “very high”
(I) vulnerability category with a DRASTIC index ranging
between 140 and 157. This indicates that about 45% of
Hydraulic Conductivity (C) 2, 4 and 10 3 the NCT, Delhi was at very high to high risk regarding
Source: Aller et al. (1987) pollution potential. These areas were mainly in the
volume 10 No. 1 January 202110 IWRA (India) Journal
North-West, North, North-East, East, Central, New Delhi Areas along Delhi ridge including Hauz Khas, Aaya
and some part of Western districts of Delhi wherein the Nagar, Mayapuri and Shekhawati lines were found to be
physical factors like gentle slope and high water table least prone to groundwater contamination which could
were supporting the chances of shallow aquifer getting be attributed to the less recharge and deep water table
polluted. The areas under the ‘Very high’ vulnerability at the given area.
category mainly lie in the region near River Yamuna, The study exhibits a methodology to assess vulnerability
Bhalaswa landfill and Gazipur landfill. The areas, under that could be used for various districts in coherence
the ‘High’ vulnerability were mainly in the North-West with index mapping techniques to evaluate and identify
and West region of the city like Kanjhawala, Rohini, contamination potential zones. This could be further
Mangolpuri, Kingsway camp and Nangloi. The findings used by all the stakeholders including private and public
suggested that areas in the South, South-West, West agencies to increase awareness and knowledge of
and a small part of North-West and East districts of Delhi groundwater pollution and potential pollution zone.
including Najafgarh, Dwarka, Vikas Puri, Bawana, Ashok
Vihar and Mayur Vihar have ‘Moderate’ vulnerability REfERENCES
(Fig 2). On the other hand, a major part of South-West 1. Singh, S.K., Singh, D., Han, D., Gautam, S.K.,
and South Delhi district has ‘Low’ pollution potential 2015. Modelling groundwaterquality over a humid
that includes the area along the southern part of Delhi subtropical region using numerical indices, earth
ridge like Hauz Khas, Shekhawati lines and Aaya Nagar. observation datasets, and X-ray diffraction technique:
Thus, DRASTIC analysis finally suggests that area along a case study of Allahabad district. Environ Geochem
the Yamuna Floodplain is more prone to contamination Health. 37, 157–180.
while potential of groundwater contamination in Delhi
2. Tomer, T., Katyal, D. & Joshi, V. (2019). Sensitivity
ridge area is minimal.
analysis of groundwater vulnerability assessing using
DRASTIC method: A case study of National Capital
Territory, Delhi, India, Journal of Groundwater for
sustainable development, 9,1-14.
3. Gogu, R. C. & Dassargues, A. (2000). Current trends
and future challenges in groundwater vulnerability
assessment using overlay and index methods.
Environmental geology, 39(6), 549-559.
4. National Research Council (NRC, 1993). Ground
water vulnerability assessment, contamination
potential under conditions of uncertainty. Washington,
D.C: National Academy Press.
5. Katyal, D., Tomer, T., & Joshi, V. (2017). Recent trends
in groundwater vulnerability assessment techniques:
A review, International Journal of Applied Research,
3(5), 646-655.
6. Aller, L., Bennet, T., Leher, J.H. & Petty, R.J. (1987).
DRASTIC: A standardized system for evaluating
ground water pollution potential using hydrogeological
settings.USEPA Report, 600/2-87-035, Robert S.
Kerr Environmental Research Laboratory, Ada, OK.
7. Foster, S.S.D. (1987). Fundamental concepts in
aquifer vulnerability, pollution risk and protection
strategy. In Duijvenbooden W van & Waegeningh
HG van (Eds), Vulnerability of soil and groundwater
fig. 2 : Groundwater vulnerability map using DRASTIC model to pollutants, Proceedings and Information , The
Hague, 69-86.
CONCLUSION 8. Van Stempvoort, D., Evert, L. & Wassenaar, L. (1993).
The DRASTIC analysis indicated that areas along Aquifer vulnerability index: a GIS compatible method
Yamuna floodplain such as Bhalaswa, Burari, Gokalpuri for groundwater vulnerability mapping. Canadian
and Rajghat were more prone to groundwater pollution. Water Resource Journal, 18, 25-37.
This could be credited to its sandy and gravel lithology.
volume 10 No. 1 January 2021Assessment of Groundwater Vulnerability to Pollution by using GIS based DRASTIC Model in Delhi Region 11
9. Civita, M. (1994). Le carte della vulnerabilitàdegli 14. Remesan, R. & Panda, R. K. (2008). Remote
acquiferi all’inquinamento: Teoriaepractica (Aquifer sensing and GIS application for groundwater
vulnerability maps to pollution). Pitagora, Bologna. quality and risk mapping. In proceedings of The 3rd
10. Babiker, I. S., Mohammed, M. A. A., Hiyama, T. & International Conference on Water Resources and
Kato, K. (2005). A GIS-based DRASTIC model for Arid Environments and the 1st Arab Water Forum.
assessing aquifer vulnerability in Kakamigahara 15. Khan, M. M. A., Umar, R. & Lateh, H. (2010).
Heights, Gifu Prefecture, central Japan. Science of Assessment of aquifer vulnerability in parts of
the Total Environment, 345, 127–140. Indo Gangetic plain, India. International Journal of
11. Zhou, J., Gand, Li., Liu, F., Wang, Yu. & Xia, G. Physical Sciences, 5(11), 1711-1720.
(2010). DRAV model and its application in assessing 16. Natraj V. M. & Katyal, D. (2014). Study of Fertilizer
groundwater vulnerability in arid area: a case study Effect on soil status in and around Loni, Maharashtra,
of pore phreatic water in Tarim Basin, Xinjiang, India, In the 3rd World Conference on Applied
Northwest China. Environmental Earth Science, 6, Sciences, Engineering and Technology Proceedings,
1055–1063. Kathmandu, Nepal, ISBN 13: 978-81-930222-0-7.
12. Saidi, S., Bouria, S., Dhiaa, H.B. & Anselmeb, 17. Mehra, M., Oinam, B. & Singh, C. K. (2016). Integrated
B. (2011). Assessment of groundwater risk using assessment of groundwater for agricultural use in
intrinsic vulnerability and hazard mapping: Application Mewat district of Haryana, India using geographical
to Souassi aquifer, Tunisian Sahel. Journal of information system (GIS). Journal of the Indian
Agricultural Water Management, 98, 1671-1682. Society of Remote Sensing, 44(5), 747-758.
13. Sharadqah, S. (2017). Contamination Risk 18. Sinanh, M. & Razack, M. (2009). An extension to the
Evaluation of Groundwater in the Canton of DRASTIC model to assess groundwater vulnerability
Portoviejo-Ecuador, using Susceptibility Index and to pollution: application to the Haouz aquifer of
two Intrinsic Vulnerability Models, American Journal Marrakech (Morocco). Journal of Environmental
of Environmental Sciences, 13(1), 65-76. Geology, 57, 349-363.
volume 10 No. 1 January 2021Bioremediation of Textile Dye Effluent –
A Sustainable Approach
Kriti Akansha
Research Scholar, Department of Bio-Engineering, Birla Institute of Technology,
Mesra, Ranchi, Jharkhand, India
ABSTRACT
Excessive, inefficient and indiscriminate use of water by textile industry is a major contributor to the
degradation of environment. Despite the adverse impact on environment, this sector generates large-
scale employment for the skilled as well as unskilled workforce. Much attention has been given on
the remediation of contaminants due to the growing awareness and concern of the global community
about the discharge of synthetic dyes into the ecosystem and their persistence. Several physico-
chemical decolorization methods have been reported over the past two decades, but few have been
implemented by the textile manufacturing industry. This has been largely attributed to high costs, low
efficiency and poor performance, over wide range of dyes. Bioremediation of synthetic dyes by vari-
ous microbes is emerging as an effective, innovative and sustainable solution among other emerging
pollution control technologies. In this article, we discuss ill effects of textile dye to environment, differ-
ent methods used for dye decolorization, their progress and limitations.
INTRODUCTION come in varied bright colorsand are easyto handle. Based
The textile industry does not only provide clothing to on the chemical structure, synthetic dyes are classified
people but also plays a significant role in employment into azo, anthraquinone, sulfur, phthalocyanine, and
generation and economic growth. The dyeing process is triarylmethane. Based on the application acid, they are
water intensive and the amount of water used depends classified as basic, direct, disperse, and vat dyeing. Dye
on various factors, such as the materials being dyed and effluents are high in color, suspended solids, chemical
the equipment used. For example, wool and cotton fabric oxygen demand (COD), biochemical oxygen demand
use more water than polyesters or nylon. During the (BOD), pH, temperature and metals. The latter is due
dyeing process, color is applied to the fabrics, andvarious to the presence of additives like caustic soda, sodium
chemicals are used to enhance the process of adsorption carbonate. Metals such as mercury, zinc, iron, chromium,
between color and the fibers. When the final product is and lead cause environmental damage, which makes it
ready, some of these dyes and chemicals become part crucial to check the effluent with standard concentration
of the effluent of textile industry. before dischargingit to any water stream[2].
This not only exerts pressure on freshwater sources, THE LEGAL fRAMEWORK Of MANAGING
but also contributes to the pollution load and resists DYE EffLUENTS
degradation. The effluents can contaminate the In 2015, India was the third-largest exporter of textiles
surrounding soil, surface water, sediments, degrade the in the world, and more than 45 million people are
environment and impacthuman and ecological health. directly employed by the textile industry. Despite
To protect the environment, textile effluent treatment the existing environmental legislation and principles
is essential which allows subsequent recycling and being implemented in the early 1970s, the progress in
reuse in textile factory processes or for other suitable minimizing and regulating emissions has been limited
purposes. due to inadequate monitoring and surveillance by the
STATUS AND COMPOSITION Of TEXTILE concerned State Pollution Control Boards (PCBs). One of
the glaring reasons behind this is low or simple penalties
WASTEWATER
for non-compliance of environmental norms under the
The composition of textilewastewatervaries, depending existing environment legislations, growing number of
mainly on the fabric, chemicals, technology and machinery. small textile industry units lacking any technological,
It is also dependent on the season and fashion trends[1]. economic, and managerial capacity to handle their waste,
The dyes can be divided into two forms - natural and corruption and lack of accountability.
synthetic. Synthetic dyes are widely used because they
volume 10 No. 1 January 2021 12Bioremediation of Textile Dye Effluent – A Sustainable Approach 13
In 2014, the ‘Circular Economy’ approach started taking Table 1 : Standards for discharge of effluents from
shape and the narrative towards waste management textile industry and real textile effluent from different
made a paradigm shift. At the end of 2015, the Ministry sources
of Environment, Forest and Climate Change (MoEF&CC),
Government of India, issued guidelines on standard Parameter Standard India Pakistan
for effluents released from the Textile Industry1, which (applicable [35] [36]
proposed that all cotton and woolen processing units for all
must achieve zero liquid discharge (ZLD). Following modes of
the Draft notification, the Environment (Protection) Fifth disposal)
Amendment Rules, 2016 (Table 1) was notified that pH 6.5 to 8.5 10.7 8.8
specify the standards for effluents from textile industry. Colour P.C.U 150 66
It mandates ZLD for large units in ecologically sensitive (Platinum Cobalt
areas. As a result of judicial intervention development Units)
which aimed at driving polluters to build wastewater
Suspended Solids 100 6438
treatment plants and increase the quality of the inputs/
raw materials under the Precautionary and Polluter Pays Bio-Chemical 30 1478 201
Principle, the legislature acted promptly by pressuring Oxygen Demand
the Central Pollution Control Board (CPCB) and state (BOD)
authorities to issue directions and take steps to address Chemical Oxygen 250 1734 513
the environmental pollution by textile industry. In India, Demand (COD)
he Tirupur region in Tamil Nadu became the first
Wastewater from the textile industry has many polluting
textile industry cluster to systematically practice ZLD.
substances, like organochloride pesticides (OCPs), heavy
In February 2015, the CPCB by exercising its power
metals, etc. [4]. Synthetic dyes are modeled in such a
under the Water (Prevention and Control of Pollution)
manner that they are recalcitrant and resist fading on
Act, 1974, the Environment (Protection) Act, 1986 and
treatment with water, soap, sweat, light, or any type of
the Environment (Protection) Rules, 1986, stipulated
oxidizing agent.
stringent standards for the textile industry for discharging
pollutants. Directions were issued to the wet processing The appearance of color in the effluent is the first sign that
textiles sector in nine Gangetic states to implement ZLD- water has been polluted, and the release of this colored
based CETPs (Common Effluent Treatment Plants) and effluent negatively affects the main water stream. Even
IETPs (Industrial Effluent Treatment Plants). This was at a concentration of 1 mg/L, some of the dyes could
done as attempt to achieve the wider goal to pursue be observed in water. These water streams, when used
the installation of ETPs (Effluent Treatment Plants) and in agriculture, can potentially cause bioaccumulation of
decrease the impact on the river’s water quality. Those contaminants in the edible crops which gets in to the
Textile units which released more than 25,000 L/day (25 food chain and adversely impacts human health and
KLD) were given 16 months (till the end of December ecology. These colored effluents, when mixed with water
2016) to put in place the required infrastructure and bodies, reduce its light penetration capacity and thereby
ensure that the technique worked well. Abstraction of negatively impact the aquatic flora and fauna.
groundwater, surface water or the municipal water supply ENvIRONMENTAL AND HEALTH IMPACTS
was prohibited for regular industrial process. However,
Of TEXTILE WASTEWATERS
use of reused water was incentivized and fresh water
could only be used as makeup water along with reused Dye-containing effluent also has been shown to increase
water. the BOD of contaminated water. Azo dyes are largest
group of synthetic dyes of all the defined dyes and are
ISSUES AND CHALLENGES fACED DURING extensively used. Textile effluent has been characterized
REMEDIATION by undefined organic pollutants, dyes, increased chemical
As water is the key component in the dyeing process, the oxygen demand (COD)and high conductivity due to a high
textile industry has been one of the major producers of amount of dissolved salt, high amount of sulfide, halogen,
waste water. Approximately 100 L of water is expected to and heavy metals. Most of the dyes pose health risks to
be required for processing of 1 kg of textile chemicals[3]. all kinds of life forms because of their non-biodegradable
Every year all around the world, almost 2,80,000 tons nature. Azo dyes have been known as potential health
of textile dyes get released into industrial wastewater. hazards. Several azo dyes have also been the cause
1. Draft Notification for Amendment Rules on Standards for Effluent from the Textile Industry
volume 10 No. 1 January 202114 IWRA (India) Journal
of DNA damage, which leads to malignant tumors[5]. Table 2 : Different chemical and physical methods for
When azo compounds enter the human body through treating dyes with their associated demerits (Alabdraba
skin contact or injection, they are metabolized intofree and Bayati 2014).
radicals and aromatic amines in the gastrointestinal
tract and the mammalian liver via azo-reductase. Azo Treatment Demerits
dyes are known as relatively persistent contaminants methods
asunder aerobic conditions, they are not readily degraded. Fenton's reagent Sludge generation
In anaerobic conditions, intestinal bacteria and some Ozone treatment Short shelf life
environmental microorganisms can reduce azo dyes to
Photochemical The formation of byproducts is a
colorless amines,which can be mutagenic, carcinogenic
oxidation major drawback.
and toxic to humans and animals. Three specific forms
of carcinogenic activation pathway are available for azo Sodium The generation of toxic chlorinated
dyes: (1) oxidation of azo dyes with structures containing hypochlorite compounds which are considered
free aromatic amine groups; (2) reduction and cleavage dangerous for the environment as
of the azo bond to produce aromatic amines; and (3) well as human health
activation of azo dyes via direct oxidation of the azo An electrochemical A high amount of electricity is
linkage to highly reactive electrophilic diazonium salts. required.
REMEDIATION Of TEXTILE WASTEWATER Membrane filters Concentrated sludge production
is a major disadvantage.
The textile industry is under immensestress to cut down the
application of harmful chemicals, particularly mutagenic, Ion exchange Regeneration is a possible
carcinogenic, and allergenic substances. The remediation economic constraint, not useful
of textile dye effluent is focused not only on the removal for dispense dye.
of color (deolorization) but also on the dye molecule’s Coagulation/ Sludge generation, poor result
degradation and mineralization. Physical and chemical flocculation with acid dyes
processes are used to decolorize colored effluent and were Radiation Radiation is very expensive,
subjective to physio-chemical factors like dye interaction, which makes it less feasible to
particle size, sorbent surface area, temperature, pH, use
and contact time[2]. Conventional treatment methods
for effluent treatment have been ineffective in dealing substances from the atmosphere, bioremediation utilizes
with effluents containing synthetic dyes, which are highly biological components (microorganisms or enzymes). In
unstable chemical pollutants. (Table 2) presents and contrast, biotransformation is referred to as conversion
array of treatment methods and associated demerits. of contaminants from highly toxic to harmless form by
In order to overcome these challenges, in recent years chemical modification brought about by living organisms.
biotechnological methods have been used, which have Flexibility in this technique is understood by the fact that
shown remarkable achievements. they can be employed ex-situ (off-site) or in situ (on-site),
and even plants can be used (phytoremediation).
The drawbacks of all these processes have been mainly
due to low efficiency, high cost, disposal problems, and Until now maximumstudies have focusedon the
limited versatility. Thus, most of the chemical and physical utilization of microbial species for the treatment of dye
methods for the treatment of colored wastewater are not wastewater but now the scientific community has recently
widely used in textile industry sites or plants [6]. recognized that plants developing near polluted sites
are equipped with transport systems (facilitating the
BIOLOGICAL METHODS Of TEXTILE DYE removal of contaminates from water and soil systems
DEGRADATION within plants) have the inherent metabolic and extractive
In the last few years, awareness among the scientific ability that allows them to dealefficientlywith accumulated
community about biological techniques has increased pollutants[7], [8]. Studies have shown that plant species
tremendously. These techniques have various benefits genetically adapt withtime to survive and evolve to
over the conventional ones such as low cost, environment- metabolize or detoxify toxins on highly polluted substrates
friendly, safe operation, and less sludge production. to overcome environmental stress[9], [10].
Biotransformation, biodegradation and bioremediation Phytoremediation has begunto develop as an energy-
are regarded as remediation or treatment processes efficient and environmentalsustainable remediation
achieved by the use of simple biological systems. technology for air, soil, surface, and groundwater.
Bioremediation is now being considered as an upcoming Basically, it is a collection of techniques that emphasize the
treatment option for dye removal in diverse conditions. effective application of plants, their associated enzymes,
For the complete elimination of toxins and /or harmful and accompanying microbes for the isolation,transport,
volume 10 No. 1 January 2021Bioremediation of Textile Dye Effluent – A Sustainable Approach 15
detoxification, sequestration and mineralization of The enzymatic treatment methods positively influence
toxicants through complex natural biological, physiological, the environment as they pose a low chance of biological
and chemical processes/ activities of plants and their contamination. Enzymes of both bacterial and fungal
microbes.Plants like Lemna minor, Scirpusgrossus, origin, such as lignin peroxidase, manganese peroxidase,
Eichhorniacrassipes, Spirodelapolyrrhiza are used for and laccase, can metabolize xenobiotic compounds [19],
removal of different types of dyes[11]–[14]. Such plants [24], [25].
can then be safely harvested, processed, or disposed
Laccase belongs to the multicopper oxidases group,
of.
which has low substrate specificity and is highly capable
fungi are most effective in breaking down or sometimes of degrading the spectrum of xenobiotic compounds
complete mineralization of synthetic dyes. These and aromatic and non-aromatic substrates.The enzyme
degradation properties are attributed to the presence of can degrade phenolic compounds and aromatic azo
a powerful extra-cellular and intracellular enzyme system compounds. Cu 2+ is used as a mediator to oxidize
comprising of lignin peroxidase, laccase and manganese aromatic amines[26], [27]. Laccase enzyme produce by
peroxidase, robust morphology, and various metabolic Fungal strain Podoscyphaelegans is able to decolorize
activities. The benefit of fungal mycelia over unicellular five azo dyes (Congo Red, Orange G, Direct Blue 15,
species is that they produces enzymes which solubilizes Rose Bengal, Direct Yellow) efficiently [27].The versatile
the insoluble material. They have a high cell to the surface laccase enzyme produce by Streptomycetes sp. has
ratio, which allows them to have greater interaction opened a new door for its commercial use.
with contaminants, both physically and enzymatically.
Azoreductase, also known as azobenzene reductase,
In tolerating a high concentration of toxicants, extra-
is a reducing enzyme. These catalysts can degrade azo
cellular fungal enzyme are also beneficial. Some of the
dyes into colorless amines via the process of reductive
examples are Alternaria alternate, Aspergillusniger and
cleavage. The whole process requires Nicotinamide
Phachrysosporium[15]–[17].
Adenine Dinucleotide (NADH) or Flavin Adenine
Bacteria have many advantages as compared to Dinucleotide (FADH), which acts as an electron donor
filamentous fungi, such as faster growth rate, higher in a redox reaction[28]. Microbes like Staphylococcus
hydraulic retention time, and could be efficient in aureus, Bacillus subtilis and Pseudomonas sp. have been
treating high-strength organic wastewaters.Generally, found to decolorize azo dyes (Methyl Red, Disperse Blue
azo dyes decolorization occurs under conventional and Acid yellow) through the production of azo reductase
anaerobic, facultative anaerobic, and aerobic conditions [29]–[31].
by different groups of bacteria. Wide variety of bacteria
Peroxidase isrelated to the group of oxidoreductases,
are used for remediation of dyes they are Nocardiopsis
which work on peroxide acting as the electron acceptor.
alba, Pseudomonas sp., Bacillus cereus and Klebsiella
Knowledge of such factors will influence the degradation
sp.[18]–[21].
activity, facilitating the development of bioreactors for the
Yeast is able to grow fast and withstand adverse bioremediation of industrial waste. These enzymes have
environmental conditions [22]. Limited literature is a heme group attached to the active site. Both lignin and
available on the study of the decolorization effectiveness manganese peroxidases have same reaction mechanism
of yeast. Some groups of microorganisms have not been (catalytic enzyme causes oxidation of H2O2 to an oxidized
extensively studied for their degradation abilities with state) (Durán and Esposito 2000). Various microorganisms
respect to synthetic dyes and other organic xenobiotics. involved in dye decolorization with peroxidases activity
For example, cyanobacteria (blue-green algae) have a includes Thermomonosporacurvata[32], Bacillus
ubiquitous distribution, but there is scant information subtilis[33], Enterobacterignolyticus[34].
about their role in the functioning of ecosystems,
CONCLUSION AND WAY fORWARD
including degradation of recalcitrant compounds
such as dye and dyestuffs. Chroococcus minutes, At present, wastewater from textile dyeing is one of
Gloeocapsapleurocapsoides, Phormidiumceylanicum the significant sources of water pollution. This type of
are some of the algae reported on dye decolorization wastewater has the characteristics of high color, COD and
[23]. BOD value, complicated structures, which makes it difficult
to degrade. Textile effluent mainly consist of hard to treat
ENZYMES fOR DYE REMOvAL waste and toxic wastes,each of which requires different
The plant and microbial systems possess efficient pollution prevention and treatment approach. Individual
enzymatic systems which can be used for bioremediation. waste/waste stream signify an individual problem which
Therefore, it is important to find out the mechanism of can be solved by considering the facts like,
biotransformation followed by the organism and probable
1. Region
enzymes involved in complex biochemical reactions.
volume 10 No. 1 January 202116 IWRA (India) Journal
2. Local Condition [5] Chung KT. 2016 Azo dyes and human health: A
3. Local drainage conditions review. J. Environ. Sci. 34: 233–261.
4. Main sewage channel [6] Jin X., Liu, G., Xu, Z., and W Yao. 2007 Decolorization
of a dye industry effluent by Aspergillus fumigatus
5. Quantity and composition of waste water
XC6. Appl. Microbiol. Biotechnol. 74: 239–243.
Our main focus should be in adopting technologies which
[7] Batool S., Akib, M., Ahmad, M., K., Balkhair, KS and
enableminimum environmental pollution. Unfortunately,
Ashraf MA. 2014 Study of Modern Nano Enhanced
none ofthe treatment method is efficient or universally
Techniques for Removal of Dyes and Metals. J.
accepted for effluent treatment. Therefore, treatment of
Nanomater. 2014: 1–20.
effluent is done by application of various methods, which
includes physical, chemical and biological treatment [8] Jamee R and Siddique R. 2019 Biodegradation of
depending upon pollution load. The class of life directly synthetic dyes of textile effluent by microorganisms:
dependent on ability to manage water in interest of the an environmentally and economically sustainable
people. Minimization of waste has great significance in approach. Eur. J. Microbiol. Immunol. 9: 114–118.
lowering the emission load and cost of production. The [9] Ojuederie O and Babalola O. 2017 Microbial and
main purpose of wastewater treatment process is water Plant-Assisted Bioremediation of Heavy Metal
can either be reused or returned to the water cycle, Polluted Environments: A Review. Int. J. Environ.
but never be wasted. Moreover, it reduces the cost of Res. Public Health. 14: 1504.
buying more water for industrial purposes. With the
[10] Koźmińska A., Wiszniewska, A., Hanus-Fajerska,
improvement of the environmental protection laws, and
E and E Muszyńska. 2018 Recent strategies of
the growing awareness on environmental protection and
increasing metal tolerance and phytoremediation
compliance, the pollution of dyeing enterprises, and the
potential using genetic transformation of plants.
treatment of textile dyeing wastewater have caught the
Plant Biotechnol. Rep.12: 1–14.
attention of stakeholders. The enhancement of knowledge
of wastewater treatment technology, and the improved [11] Tan KA., Morad, N and Ooi JQ. 2016.
understanding of microbial ecology and the web of intra- Phytoremediation of Methylene Blue and Methyl
species linkages, are the need of the hour. Combined Orange Using Eichhornia crassipes. Int. J. Environ.
efforts are required by textile industry specialist and Sci. Dev. 7: 724–728.
water technologists to cut down the water intake in the [12] Movafeghi A., Khataee, AR., Moradi, Z and Vafaei
industry. Our main focus should be to save life and its F. 2016 Biodegradation of direct blue 129 diazo dye
environment. Thus we should minimise using chemicals by Spirodela polyrrhiza : An artificial neural networks
and dyes, which are harmful to our ecosystem. modeling. Int. J. Phytoremediation. 18: 337–347.
Conflict of interest : The authors declare that they have [13] Almaamary EAS., Abdullah, SRS., Hasan, HA.,
no conflict of interest. Rahim, RA and Idris M. 2017 Malaysian journal of
REfERENCES analytical sciences treatment of methylene blue
in wastewater using Scirpus grossus (Rawatan
[1] Yaseen DA and Scholz M. 2018 Treatment of Metilena Biru dalam Air Sisa Menggunakan Scirpus
synthetic textile wastewater containing dye mixtures grossus). Malaysian J. Anal. Sci. 21: 182–187.
with microcosms. Environ. Sci. Pollut. Res. 25:
[14] Yaseen DA, Scholz M. 2017 Comparison of
1980–1997.
experimental ponds for the treatment of dye
[2] Obasi PN and Akudinobi BB. 2020 Potential health wastewater under controlled and semi-natural
risk and levels of heavy metals in water resources conditions. Environ Sci Pollut Res. Environ. Sci.
of lead–zinc mining communities of Abakaliki, Pollut. Res. 24: 16031–16040.
southeast Nigeria. Appl. Water Sci. 10: 84.
[15] Jayasinghe C, et al., Degradation of Three Aromatic
[3] Adeel S., Abrar, S., Kiran, T., Farooq, T., Gulzar, Dyes by White Rot Fungi and the Production of
A and M. Jamal. 2018 Sustainable Application of Ligninolytic Enzymes. Mycobiology. 36: 114, 2008.
Natural Dyes in Cosmetic Industry, in Handbook of
[16] Chakraborty S., Basak, B., Dutta, S., Bhunia B, and
Renewable Materials for Coloration and Finishing,
Dey A. 2013 Decolorization and biodegradation of
Hoboken, NJ, USA: John Wiley & Sons, Inc., 2018:
congo red dye by a novel white rot fungus Alternaria
189–211.
alternata CMERI F6,” Bioresour. Technol. 147: 662–
[4] Correia VM., Stephenson, T., and Judd SJ. 1994 666.
Characterisation of textile wastewaters – A review.
[17] Asses N., Ayed L., Hkiri N and Hamdi M. 2018 Congo
Environ. Technol. 15: 917–929
Red Decolorization and Detoxification by Aspergillus
volume 10 No. 1 January 2021You can also read