Leeds Joint Strategic Assessment 2021 - Draft Summary Report
←
→
Page content transcription
If your browser does not render page correctly, please read the page content below
DRAFT

                           Appendix 1

Leeds Joint Strategic Assessment
2021

Draft Summary Report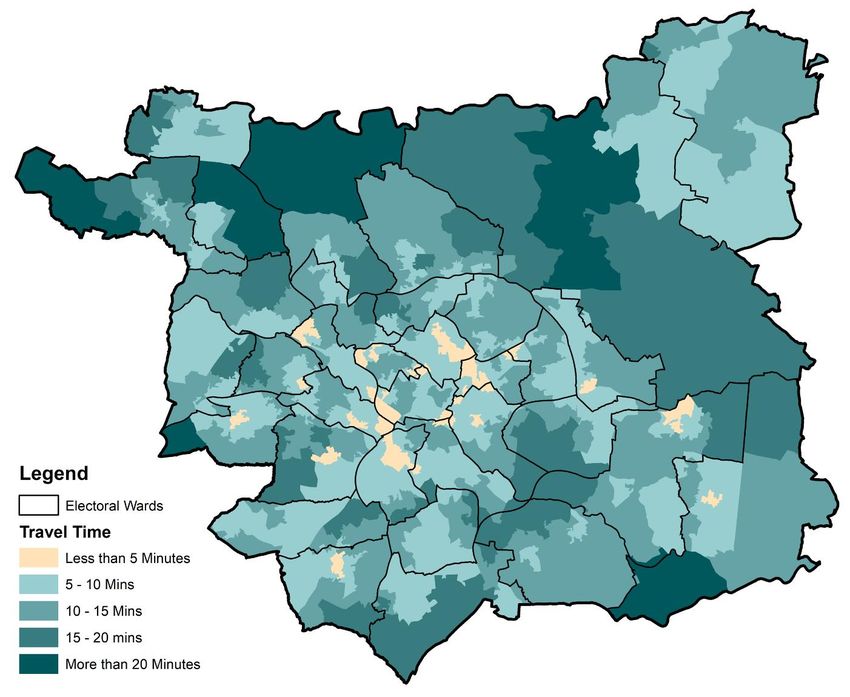
DRAFT

Contents
Introduction and Purpose ......................................................................................................... 6
   What is the Joint Strategic Assessment (JSA)? ......................................................................... 6
   Producing the JSA during a global pandemic ........................................................................... 6
   How to use the JSA............................................................................................................... 9
      Structure ....................................................................................................................... 10
      Deprived Leeds terminology ............................................................................................ 10
      Accessibility ................................................................................................................... 10
   Updates ............................................................................................................................ 10
Section 1: A Changing City: Population Trends .......................................................................... 12
   Headlines .......................................................................................................................... 12
   Overview .......................................................................................................................... 12
   Population growth centered in our most disadvantaged communities ..................................... 13
   A more diverse population .................................................................................................. 14
   Population is still ageing ..................................................................................................... 15
   More children and young people ......................................................................................... 16
   Policy implications ............................................................................................................. 17
Section 2: Starting Well - Child-Friendly Leeds........................................................................... 18
   Headlines .......................................................................................................................... 18
   Population ........................................................................................................................ 19
   Child poverty ..................................................................................................................... 19
   Safeguarding ..................................................................................................................... 20
   Health .............................................................................................................................. 21
      Infant mortality .............................................................................................................. 21
      Child obesity .................................................................................................................. 22
      Activity levels ................................................................................................................. 23
      Breastfeeding ................................................................................................................ 23
      Vaccinations .................................................................................................................. 24
      Oral health .................................................................................................................... 25
      Young people and alcohol ............................................................................................... 25
      Mental health ................................................................................................................ 26
      Sexual and reproductive health ........................................................................................ 26
   Education and learning ....................................................................................................... 27
      Early years ..................................................................................................................... 27
      Key stage 2 .................................................................................................................... 28
      Key stage 4 and beyond .................................................................................................. 28
   Support for children with special educational needs .............................................................. 29

                                                                                                                                         2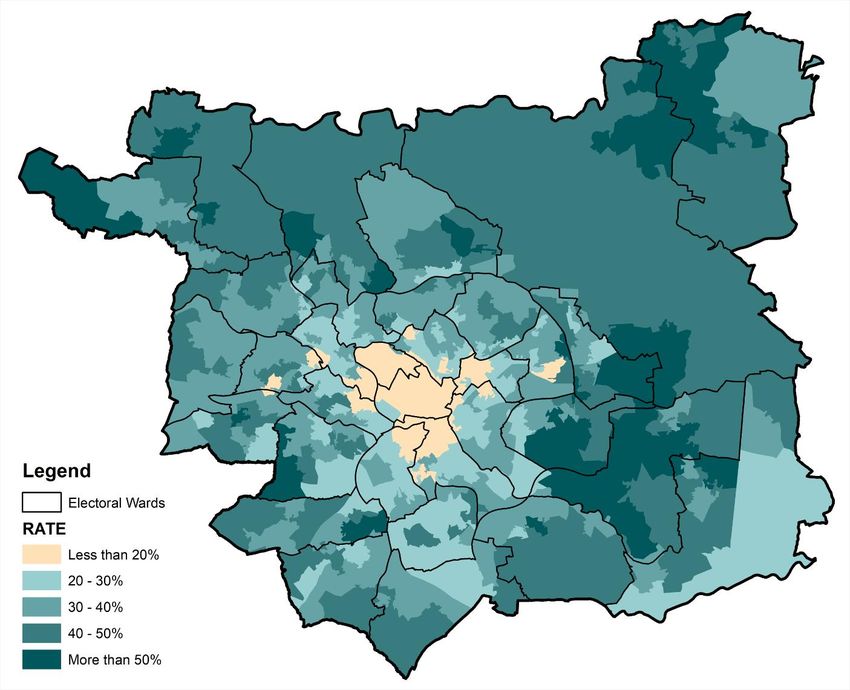
DRAFT

  School attendance during Covid-19 ...................................................................................... 30
  Policy implications ............................................................................................................. 31
Section 3A: Living Well – Health and Wellbeing ........................................................................ 32
  Headlines .......................................................................................................................... 32
  Immediate and direct health impacts of Covid-19 .................................................................. 33
  Longer-term trends – the health / wealth gap ....................................................................... 34
  Life expectancy .................................................................................................................. 35
  Preventable mortality......................................................................................................... 36
  Suicide rates ...................................................................................................................... 37
  Alcohol related admissions ................................................................................................. 38
  Liver disease mortality ........................................................................................................ 39
  Respiratory disease mortality .............................................................................................. 39
  Circulatory disease mortality ............................................................................................... 40
  Cancer mortality ................................................................................................................ 40
  Smoking prevalence ........................................................................................................... 41
  Smoking attributable mortality ............................................................................................ 41
  Obesity ............................................................................................................................. 42
  Diabetes ........................................................................................................................... 42
  Mental health .................................................................................................................... 43
  Policy implications ............................................................................................................. 44
Section 3B: Living Well – Thriving Communities ........................................................................ 45
  Headlines .......................................................................................................................... 45
  Socio-economic inequality .................................................................................................. 46
     Geography of inequality .................................................................................................. 46
     Communities of interest .................................................................................................. 47
  Poverty ............................................................................................................................. 48
  Leeds’ vibrant third sector .................................................................................................. 49
  Community resilience ......................................................................................................... 50
     Family support ............................................................................................................... 50
     Civic participation ........................................................................................................... 51
     Social connections .......................................................................................................... 52
  Safe communities .............................................................................................................. 52
  Digital inclusion ................................................................................................................. 53
  Housing ............................................................................................................................ 53
     Housing delivery............................................................................................................. 54
     Affordable housing development ..................................................................................... 55
  Housing costs .................................................................................................................... 56
  Policy implications ............................................................................................................. 58

                                                                                                                                        3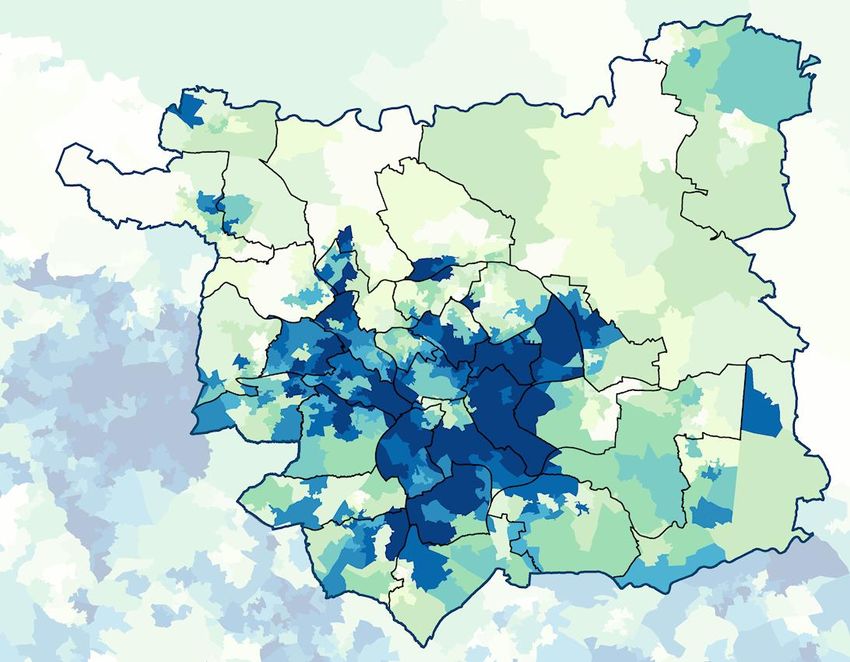
DRAFT
Section 3C: Living Well - Climate Change .................................................................................. 60
Headlines .......................................................................................................................... 60
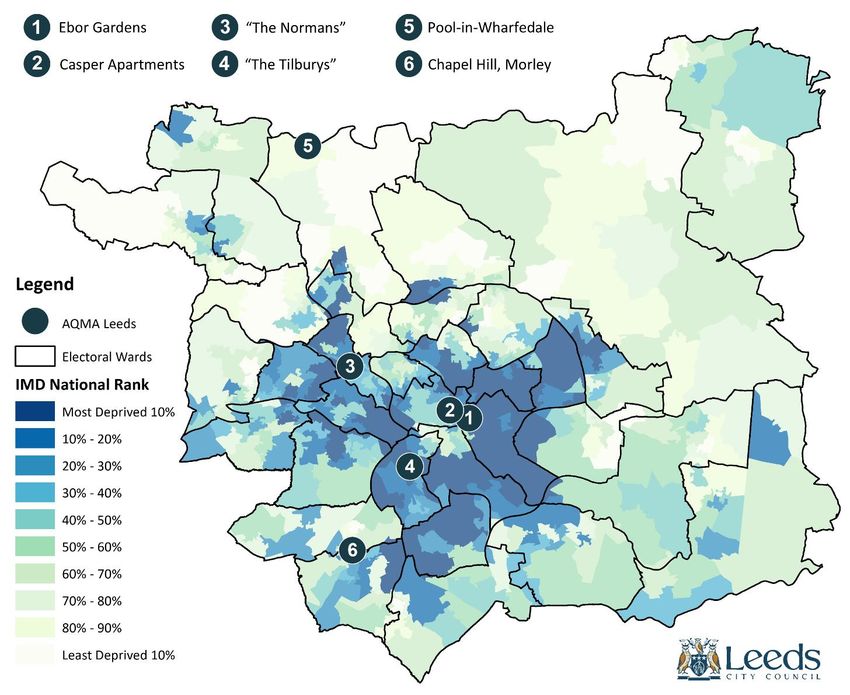
Carbon emissions ............................................................................................................... 60
Air quality ......................................................................................................................... 63
Energy efficiency and fuel poverty ....................................................................................... 66
Food ................................................................................................................................. 67
Transport .......................................................................................................................... 68
Walking and cycling ........................................................................................................ 68
Public transport.............................................................................................................. 69
Access to green space......................................................................................................... 70
Policy implications ............................................................................................................. 71
Section 4: Working Well - Inclusive Growth .............................................................................. 73
Headlines .......................................................................................................................... 73
Economic impact of Covid-19 .............................................................................................. 73
Employment...................................................................................................................... 74
Earnings ............................................................................................................................ 77
Business performance – growth, diversity and productivity .................................................... 80
Policy implications ............................................................................................................. 82
Section 5: Ageing Well - Age-Friendly Leeds .............................................................................. 84
Headlines .......................................................................................................................... 84
Demography and housing ................................................................................................... 85
Healthy ageing................................................................................................................... 87
Life expectancy .............................................................................................................. 87
Physical health conditions ............................................................................................... 87
Frailty ........................................................................................................................... 88
Mental health ................................................................................................................ 88
The impact of Covid-19 ................................................................................................... 88
Active, included and respected ............................................................................................ 89
Active............................................................................................................................ 89
Included ........................................................................................................................ 90
Loneliness ..................................................................................................................... 90
Mobility and accessibility ................................................................................................ 90
Employment and Learning .................................................................................................. 92
Labour market ............................................................................................................... 92
Caring and carers............................................................................................................ 92
Policy implications ............................................................................................................. 92
Section 6: Implications of the Analysis (To be developed further) ................................................ 94
A Changing City: Population Trends...................................................................................... 94
4
DRAFT

Starting Well - Child-Friendly Leeds ...................................................................................... 94
Living Well – Health and Wellbeing ...................................................................................... 95
Living Well – Thriving Communities ...................................................................................... 95
Living Well - Climate Change ............................................................................................... 96
Working Well - Inclusive Growth .......................................................................................... 96
Ageing Well - Age-Friendly Leeds ......................................................................................... 97

                                                                                                                             5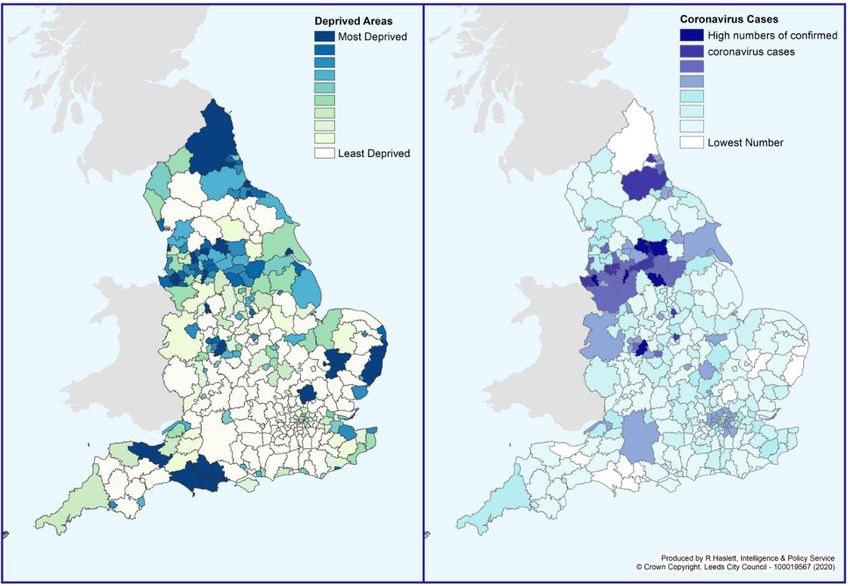
DRAFT

Introduction and Purpose

What is the Joint Strategic Assessment (JSA)?

The JSA provides a holistic and reliable source of data and analysis about key demographic, socio-
economic and health trends in Leeds. It aims to present an up-to-date picture of the issues driving
health and wellbeing in the city, providing deeper insights which help us to understand the
interrelated nature of the challenges which affect people’s lives. The JSA does not attempt to set out
the current policy response, rather, its primary purpose is to inform commissioners and policy makers
about the future needs of the city to better enable effective strategic planning, priority setting and
commissioning decisions – helping to make the most of the resources available, deliver the best
possible outcomes for Leeds citizens in a joined-up way, and engage everyone to play their part.

In Leeds we put the wider determinants of health and wellbeing at the core of our JSA, recognising
the way factors including the economy, education, environment and housing impact on health
outcomes and wider wellbeing over a person’s lifetime and are therefore crucial to our ambition to
improve the health of the poorest fastest. The JSA also provides valuable insight in assessing the future
health and care needs of our changing population, helping to inform change and development in the
health and care system. It underpins Leeds’s strategic framework including the statutory Health and
Wellbeing strategy, our Inclusive Growth strategy and is available to support the future planning of
other partners and organisations across the city. From 2021 the JSA will provide a valuable evidence
base and context for the agreement of a new city plan for Leeds which describes our shared vision and
ambitions for the future.

While much of the JSA is focused on analysing the drivers of need across Leeds, we also adopt the
city’s asset-based approach to reflect where there are strengths on which we can build. Guiding us in
this effort are the voices and lived experiences of people living in Leeds, especially those living in our
low-income communities and those facing personal or environmental challenges in their lives.

Producing the JSA during a global pandemic

Most of the background research and analysis which has informed the JSA was undertaken in the
spring and early summer of 2021 when Leeds, the UK and the rest of the world is still dealing with the
Covid-19 pandemic. The pandemic has caused social and economic change on a scale not seen in our
lifetimes, and its lasting medium and longer-term effects remain unclear particularly on issues such as
mental health and wellbeing.

Producing an accurate analysis of the current and future challenges the city faces in this context is
very challenging. Much of the data available is partial in nature or is yet to show the full effects of
Covid-19. In other cases, it is too early to draw any conclusions about how Leeds will recover following
the pandemic. Therefore, throughout this summary report we have highlighted areas where there
should be further lines of inquiry over the coming months to assess the impact of Covid-19, and we
will publish further analysis and reporting on the Leeds Observatory.

Despite this ongoing uncertainty, we can offer some analysis of the pandemic’s impact with assurance.
There are headlines common to places across the UK which we have experienced in Leeds, the most
striking of which is clearly the direct impact on human life. Since March 2020 we have seen significantly
higher excess deaths as a direct result of Covid-19 when compared to the 2015-2019 average (Figure
1: Deaths in 4-week groupings, variation with 2015-19Figure 1).

                                                                                                        6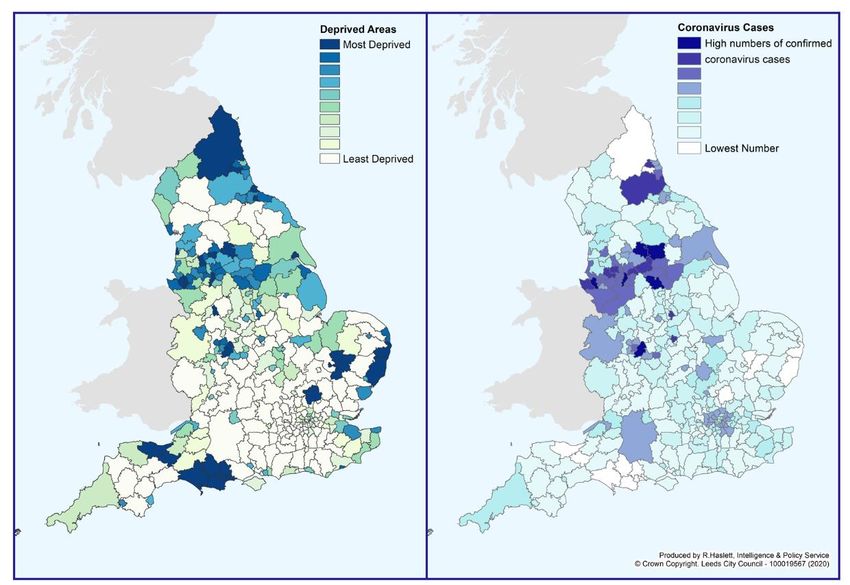
DRAFT

As of 30 July 2021, there have been 1,739 deaths recorded in Leeds with Covid-19 on the death
certificate, and there have been 90,411 total cases in the city by the same date1.

                               Figure 1: Deaths in 4-week groupings, variation with 2015-19

                                                                        Source: Leeds Public Health Intelligence, June 2021

Crucial to the purposes of the JSA, Covid-19 has not affected all populations equally. There has been
a clear disproportionate impact of the virus on older people. With the exception of the 90+ age group,
where the highest number of cases have occurred, case rates have generally been higher in younger
populations. Despite this the majority of hospitalisations and 93% of all Covid-19 deaths in Leeds have
affected people aged over 602.

                      Figure 2: Cumulative Covid-19 cases in Leeds by age, March 2020 – August 2021

                                                                     Source: Leeds Public Health Intelligence, August 2021

The virus can also be seen to exacerbate existing inequalities with case rates higher in areas already
experiencing disadvantage (Figure 2Error! Reference source not found.). Along with more diagnoses
there is a higher likelihood of people losing their lives to Covid-19, with mortality rates in the most
disadvantaged communities more than double the least nationally and survival rates remaining lower

1   GOV.UK Covid-19 Dashboard
2   Covid-19 deaths by age group (Leeds Public Health Intelligence, August 2021)

                                                                                                                         7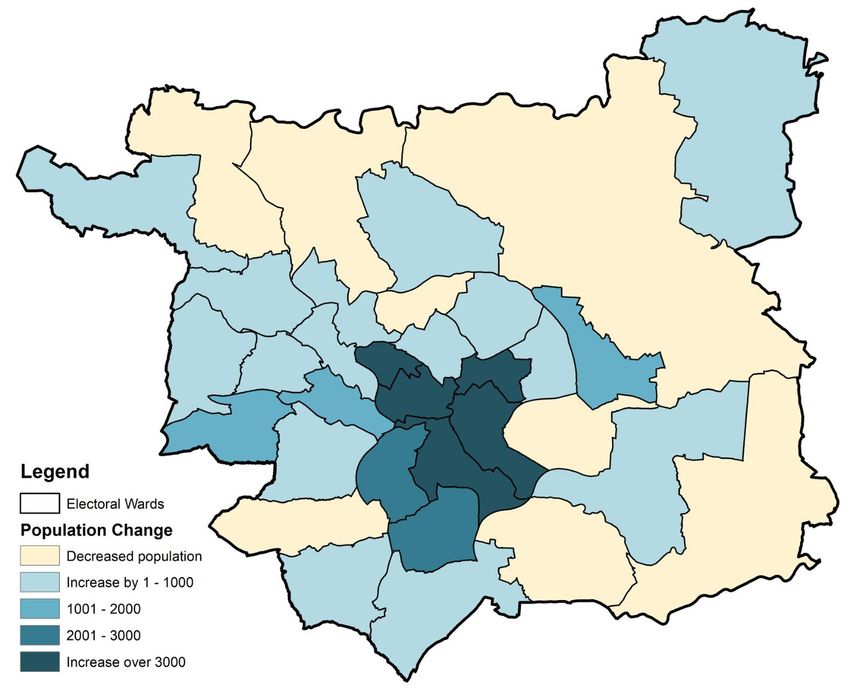
DRAFT

after adjusting for sex, age and ethnicity – particularly for those of working age where the risk of death
almost doubled3. Within Leeds itself these differences are less pronounced in the data, although the
mortality rate in the most deprived decile according to the Indices of Multiple Deprivation (IMD)
remains higher than the Leeds average and the true impact may be masked by the overall geography
of the city.

                      Figure 3: Index of Multiple Deprivation 2019 and total Covid-19 cases in England

                                                Source: Indices of Multiple Deprivation (2019) and Leeds City Council (2021)

Covid-19 poses increased risk to individuals based on their ethnicity too. In England the highest
diagnosis rates per 100,000 population were in Black ethnic groups (486 per 100,000 in females and
649 per 100,000 in males) and the lowest were in White ethnic groups (220 per 100,000 in females
and 224 per 100,000 in males). In these cases the increased risk is not specifically related to a genetic
vulnerability in minority communities, but instead is likely to be the outcome of structural and cultural
economic and societal issues which shape where people live and the jobs they do, resulting in
increased exposure and elevated risk for some Black, Asian and ethnic minority communities.
Proportionally more people from these communities have also been significantly ill with Covid-19,
perhaps exacerbated by the additional issue of higher rates of long-term underlying conditions than
in the population as a whole.

3   Disparities in the risk and outcomes of Covid-19 (Public Health England, August 2020)

                                                                                                                          8
DRAFT

                Figure 4: Cumulative Covid-19 cases in Leeds by ethnicity, March 2020 – August 2021

                                                                  Source: Leeds Public Health Intelligence, August 2021

Looking at Leeds specifically, the city has also experienced significantly higher case numbers in Black
and Asian ethnic groups compared to White ethnic groups. Black African, Other Black, Pakistani and
Other Asian ethic groups have been most affected, and while the Indian population has seen a rate
lower than the Leeds average it has still been notably higher than for White ethnic groups. The Chinese
population in Leeds has experienced very low case rates, perhaps supported by different established
cultural norms including regular mask wearing.

More detailed analysis of the ongoing impacts of Covid-19 across all aspects of life in Leeds is
contained within the main chapters of this report. We have sought to explore the differential impacts
of the disease on the health and economic prospects of people and communities throughout, in
addition to presenting analysis about the way the pandemic has affected the behaviours and
experiences of the city’s population over the last 18 months.

While Covid-19 has undoubtedly had a huge impact on the health and wellbeing of people in Leeds,
and aspects of this will continue for some time to come, it is important the JSA does not become solely
focused on this. Analysis of the pandemic’s impact is contextualised as we consider a wide range of
longer-term trends and prominent issues the city faces in the years ahead.

How to use the JSA

This summary report provides an overview of the key issues and implications identified in the latest
data and analysis available. It provides a snapshot in time of the headline challenges and opportunities
for Leeds, and provides signposts to more detailed data, analysis, themed reports and geographic
profiles.

In producing the JSA we recognise the complexity of a city like Leeds. Where localised geographic
analysis is included to help understand the issues encountered in different localities and communities,
we adopt the most appropriate boundary for the data cited rather than enforcing a single geography
across all topics. For example, this might include locally defined geographies such as school clusters

                                                                                                                     9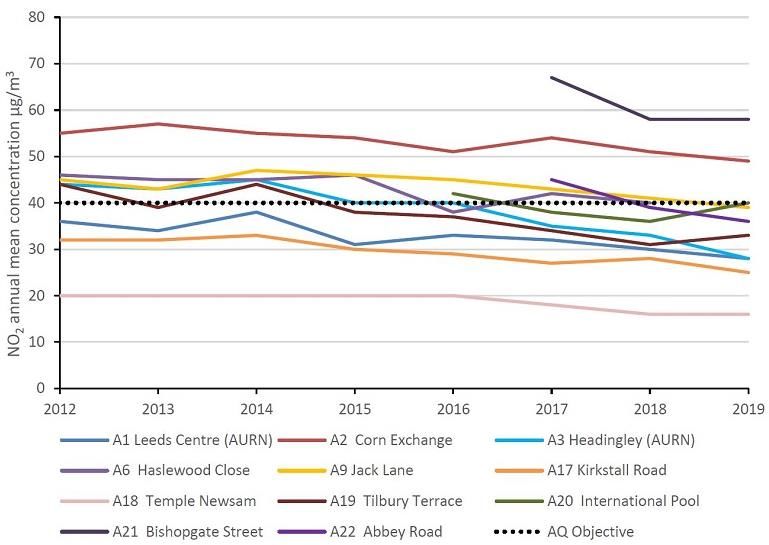
DRAFT

and local care partnerships in addition to ward boundaries, middle super output areas (MSOAs)4 and
lower super output areas (LSOAs)5.
Structure

The JSA examines health and wellbeing issues, including the wider determinants of health, for the
Leeds population at all ages. This summary report therefore groups the analysis into chapters
structured primarily around life course stages under the following headings:

        1.       Population
        2.       Starting Well – Child-Friendly Leeds
        3A.      Living Well – Health and Wellbeing
        3B.      Living Well – Thriving Communities
        3C.      Living Well – Climate Change
        4.       Working Well – Inclusive Growth
        5.       Ageing Well – Age-Friendly Leeds
        6.       Implications of the Analysis

Deprived Leeds terminology

Part of Section 2: Child-Friendly Leeds and Section 3A: Health and Wellbeing draw specifically on the
latest health and wellbeing indicators tracked by the Public Health Intelligence team. This analysis
provides an overview of the progress in the city, and where possible separates out city-wide progress
and that of those parts of the city most likely to experience multiple factors of deprivation, i.e. those
communities identified as 10% most deprived in Index of Multiple Deprivation 2019. In these sections
and in this specific context, those communities are identified as ‘deprived Leeds’.

Accessibility

The JSA is an evolving product hosted on the Leeds Observatory (observatory.leeds.gov.uk) where you
will find further supporting reports alongside a wealth of detailed data and analysis which could not
be included in this summary report.

The Leeds Observatory’s self-serve capability allows data to be mapped using a range of
‘administrative’ boundaries. The building blocks for the analysis are usually comprised of the statistical
geographies of either LSOAs or MSOAs depending on the availability of data.

This summary report is best read on screen. If you have any queries or require further support
accessing the JSA please contact us at leedsobservatory@leeds.gov.uk.

Updates

The JSA is currently undertaken every three years and a summary report produced. Increasingly
commissioners, policy makers and providers want access to real-time intelligence about the city which
can help them to respond more quickly to changing needs and circumstances at a community level.

Moving forward the JSA will aim to provide this insight in a useful, interactive way through further
development of the Leeds Observatory’s functionality, with more frequent updates as new
4 MSOAs are built up from 3-7 individual LSOAs. The average number of people living in an MSOA is 7,000.
There are 107 MSOAs in Leeds.
5 LSOAs typically have an average 1,500 residents and 650 households. There are 482 LSOAs in Leeds.

                                                                                                           10
DRAFT
information becomes available and the inclusion of more real-time dashboards providing key data and
analysis in an easily digestible format. This online platform will also enable more effective sharing of
qualitative data, case studies and lived experience insights gathered by the council and its partners
alongside existing intelligence.
11DRAFT
Section 1: A Changing City: Population Trends
Headlines
In line with national patterns, ageing population trends continue, with the 80+ age group
growing fastest.
The population profile of children and young people is becoming more diverse and focused in
communities most likely to experience poverty.
The birth-rate ‘bulge’ of the 2010s has fallen back since 2017, though the 8 years of ‘bulge’
(10,000+) cohorts are now beginning to go through secondary school, with potentially
significant mid-term implication for post-16 support and opportunities beyond.
There are variations in the geography of population change, with growth primarily focused in
inner-city communities.
It is perhaps too early to assess any full impact of exiting the EU on patterns of immigration
and/or on some existing communities. However, the pandemic has been an additional factor
on masking any more deep-rooted changes.
Overview
According to the Office for National Statistics (ONS) mid-year estimates for 2019, there were 793,000
people living in Leeds, up by over 41,000 from the 2011 Census6. Given that the Census is now a decade
old, GP registrations can provide an additional source of insights into population trends. Data drawn
from our Public Health population model (based on GP registrations, but accounting for cross district
registrations) suggests the population might be as large as 870,0007 though care is needed with this
figure as duplicate GP registrations can result in over-counting, especially in cities like Leeds with its
large student population. That said it is unlikely the scale of the disparity can be fully explained by this
over-counting. We await the forthcoming 2021 Census with interest.
However, it is how the composition of our population has changed which is of specific interest, with
the GP registration data, birth rates and the results from the annual School Census, all pointing to a
far more diverse population.
6 ONS Population Estimates 2011 Census Population Count
7 GP ethnicity October 2020
12DRAFT
Figure 5: 2017 Mid-year population estimates for Leeds (teal) and England and Wales (orange)
Source: ONS mid-year estimate of population 2019
The comparative analysis of the city’s population highlights both the broad similarities with national
trends, but also where the city diverges. The city has an ageing population in-line with national trends.
However, it has also seen growth in the population profile of children and young people, which the
data suggests is becoming more diverse and concentrated in our inner areas.
In addition, Leeds has one of the highest student populations in the UK with over around 70,000
students attending the city’s universities, with students heavily concentrated in the city centre and
Inner West areas.8
Population growth centered in our most disadvantaged communities
ONS population estimates, the School Census and GP registrations all point to an expansion in
population in our inner-city areas, which are often our most disadvantaged communities. Intelligence
regarding the demand for services confirms these often quite rapid demographic changes, not only
driven by immigration, but also heavily influenced by the local housing tenure, Figure 6 below
illustrates these changes.
8 HESA Student Population
13DRAFT
Figure 6: Population Change by Electoral Ward 2011-2019
Source: ONS Mid-Year Estimates 2011 & 2016
A more diverse population
The city’s population has continued to become more diverse since the 2011 Census, in terms of age,
countries of origin and ethnicity.
Again drawing on GP records for insights in to how our city is increasingly diverse, the Black, Asian and
ethnic minority population represents almost a third of all those registered in 2020, whilst accounting
for 19% of the city’s population in the 2011 Census. The most notable difference is in the Other White
ethnic group, which in the 2011 Census had a population of 23,000, but in the 2020 GP registar stands
at 78,000, pointing to the growth in economic immigration primarily from the EU over the last decade.
That said most minority groups appear to have grown in population, with the exception of the
Carribean (Black and Mixed) and Irish groups which look to have reduced in size (this could be due to
identification or disclosure barriers as much as immigration). The White British group also appears to
have reduced in size.
Anyone wishing to work in the UK needs a National Insurance Number, analysis of non-British National
Insurance Number (NINo) applicants, can be also provide insights into economic migration9. The latest
data from 2019/20 confirms applications have decreased to the lowest levels since 2011, the extent
to which this is due to Covid-19 restrictions or exiting the EU and associated changes to government
9 2019-20 NINO Data Leeds –file includes further core cities and nationality charts
14DRAFT
policy is uncertain, though applications have been on a downward trend since 2016. The largest
proportion of applications in recent years have been from Romanian and Polish nationals, though
these have seen a significant decline in since exiting the EU.
Population is still ageing
The overriding backdrop to these localised pressures is the wider trend of the city’s ageing population.
As the baby-boomer generation grows older there will be a range of implications for service provision.
The over 50 population has grown by an estimated almost 30,000 between 2001 and 2019, a 12% to
17% increase in each of the 50 plus age groups, much of the city’s population growth has been
concentrated in these age groups. In terms of future projections to 2041, the 50-59 population is
projected to reduce and there will be little change for the 60-69 population, however the 70+
population is projected to substantially grow, with fastest growth amongst the 80+, which is expected
to see a 50% increase.
Figure 7: Population of Leeds by age
Source: ONS Mid-Year Population estimates 2019 & Population Projections 2018
The distribution of the city’s older population should also be considered. There are currently higher
numbers of older people living in the city’s outer areas, however this could change as the recent shifts
in the composition and spatial concentration of the population work through, resulting in a far more
ethnically diverse older population, with a greater concentration in the city’s inner areas. Figure 8
below presents the current population profile by age, against the IMD 2019 deciles. This confirms the
overall population concentration in our inner areas, which are often those which are most
disadvantaged, primarily driven by housing density. However, it also highlights that the single largest
over 65 population are also found in these areas.
15DRAFT
Figure 8: Age Profile for each Index of Multiple Deprivation 2019 decile
Source: Index of Multiple Deprivation 2019 Mid-Year Population Estimates 2019
More children and young people
The Leeds birth rate increased rapidly from the early 2000s and plateaued at around 10,000 per
annum for eight years until 2016. However, the number of births has now fallen consecutively for four
years and was 12% lower than 2016 in 2020. Latest intelligence shows that the number of births will
be lower still in 2021 (circa 8,400). However, the child population is still growing at a faster rate than
the population of Leeds as a whole, but the growth is now concentrated in Secondary school-age
groups.
Figure 9: Births within Leeds boundary between 1999 and 2020
Source: NHS Health Leeds / Wakefield / Bradford, contains data within the Leeds boundary only (2021)
16DRAFT
The latest ONS projections suggest there will be 15,000 more young people aged between 11 and 19
years old in 2029 compared to 2019. Their data also suggests that this population has been growing
faster in our communities most likely to experience deprivation.10
Data from the city’s schools show major change over the last few years. The proportion of pupils that
are Black, Asian and ethnic minority has continued to grow to 36% in 2021. And while, other than
White British, the largest broad ethnic groups are Asian, Black, Mixed and White Other; proportional
growth has been highest in White Other, mirroring the wider trends driven by economic migration.
Between 2010 and 2020, growth has been particularly high within White Eastern European and Gypsy
Roma ethnicities. The number of children and young people with English as an additional language
(EAL) has increased from 13% in 2010 to 20% in 2021. After English, the main languages spoken are
Urdu, followed by Romanian and Polish. Altogether nearly 200 languages are spoken by children
studying in Leeds schools.11 The proportion of school pupils who are eligible for, and claim, Free School
Meals has significantly increased since 2018, from 16% to 25% in 2021. Meanwhile the number of
pupils who have an Education Health and Care Plan has more than tripled from 824 in 2016 to 3,013
in 2021.
All this shows that while rapidly growing, our teenage population are also becoming more diverse, and
the indicators suggest growing more quickly in our more disadvantaged communities. With a backdrop
of the Covid-19 pandemic and pressure on resources, our teenage population potentially face
significantly growing challenges into the medium-term.
Policy implications
The city’s population has continued to become more diverse, in terms of age, countries of
origin and ethnicity. There is a more work to do in understanding and responding to the
relationship between ethnicity, deprivation, social mobility and health and wellbeing.
The city’s population is ageing, with the 80+ age group growing fastest. The older population
is also becoming more diverse, as the wider demographic trends are increasingly reflected in
our older generation. Although perhaps too early to be definitive, the socio-economic profile
of our older population may also be changing, with house-ownership less dominant, and
people working longer over a more varied career pattern. Future Age-Friendly Leeds work as
well as other service provision will need to take account of these factors.
In terms of young people, the birth-rate ‘bulge’ of the last decade has fallen back, beginning
to be reflected in a fall in demand for school reception places. However, the ‘bulge’ cohorts
are now beginning to go through secondary school, with significant mid-term implications for
post-16 education and skills support and routes of entry into the labour market. All this
against the backdrop of the economic impact of the pandemic, that has been acutely felt by
young people.
It is too soon to assess any full impact of exiting the EU on patterns of immigration and/or on
some existing communities. However, early indications suggest that economic immigration
from the EU has slowed, with some evidence of skills and labour shortages feeding through to
the local economy and potential longer-term implications for the inclusive growth agenda.
10 Census Data Intel
11 Citywide analysis of School Census 2020
17DRAFT
Section 2: Starting Well - Child-Friendly Leeds
Headlines
The pandemic has had a major impact on children and young people, with the disruption to
their education the most obvious. Covid-19 restrictions have led to concerns regarding
safeguarding and the disengagement of young people, particularly the most vulnerable.
Since 2011, the number of children looked after has reduced by 7% in Leeds compared to an
22% rise over that period across England.
Educational attainment, particularly of more disadvantaged children, is still a significant
challenge. Performance at Foundation and Key Stage Two is below regional and national
averages, especially amongst disadvantaged children. This performance recovers somewhat
by Key Stage 4, where the city’s performance (for non-disadvantaged children) is closer to the
national average.
The number of pupils who have an Education Health and Care Plan has more than tripled
between 2016 and 2021.
Child poverty is at the root of many poor outcomes for children and young people and their
families. In 2021 almost 24% of children (under 16s) were estimated to live in poverty in Leeds,
compared to 19% nationally.
The population profile of children and young people is becoming more diverse and more likely
to live in communities experiencing poverty.
The city has a long-standing aspiration to be a Child-Friendly city, where young people enjoy growing
up and achieve their potential to become successful citizens of the future. We want to make a
difference to the lives of children and young people who live in Leeds, to have a positive impact on
improving outcomes for all children, while recognising the need for outcomes to improve faster for
children from disadvantaged and vulnerable backgrounds.
Clearly Covid-19 has had a profound impact on children and young people, with the disruption to their
education perhaps most obvious. However, Covid-19 restrictions have also raised very real concerns
regarding safeguarding, including issues regarding the disengagement of young people, particularly
the most vulnerable, which potentially could manifest in the form of increased involvement in gangs
and youth crime, anti-social behaviour and radicalisation. These concerns are accompanied by a
broader set of worries regarding the social, emotional and mental health of young people. These
worries are exacerbated by the economic impact of Covid-19, where young people have often been
the most severely impacted in terms of job losses or furlough as many start their career path in those
sectors most affected by the restrictions caused by the pandemic. Although data is still relatively
scarce regarding the long-term impacts, clearly this will be a theme for further analysis as new insights
become available.
18DRAFT
Population
A more comprehensive population overview is set out in Section 1 of the JSA. The population profile
of children and young people is becoming more diverse and poorer. The number of births have now
fallen consecutively for four years, and was 12% lower than 2016 in 2020. Latest intelligence shows
that the number of births will be lower still in 2021 (circa 8,400). However, the child population is still
growing at a faster rate than the population of Leeds as a whole, but the growth is now concentrated
in Secondary school-age groups.
The latest ONS projections suggest there will be 15,000 more young people aged between 11 and 19
years old in 2029 compared to 2019. Their data also suggests that this population has been growing
faster in our more deprived communities.12
The proportion of school pupils who are eligible for, and claim, Free School Meals has significantly
increased since 2018, from 16% to 25% in 2021. Meanwhile the number of pupils who have an
Education Health and Care Plan has more than tripled from 824 in 2016 to 3,013 in 2021.
With a backdrop of the Covid-19 pandemic and pressure on resources, our teenage population
potentially face significantly growing challenges into the medium-term.
Child poverty
National child poverty data from the Households Below Average Incomes survey (HBAI) for 2019/20
estimates that there are 4.3m dependent children under 20 in Relative Poverty in the UK, after housing
costs are deducted from income. This is a rate of 31% of dependent children under 20.
This figure is not available to compare locally. Instead the DWP and HMRC produce an estimate for
children in low income families under 16 at national and local levels, before housing costs are
deducted from income. This data provides the best indication for child poverty levels across local
geographies.
Using this measure, in 2019/20 there were 2.4m children under 16 in relative poverty in the UK, before
housing costs are deducted from income. This is a rate of 19% of all children under 16 in the
population.
Figure 10 below compares child relative poverty for Leeds against other core cities, West Yorkshire
authorities and the UK as a whole.
12 Census Data Intel
19DRAFT
Figure 10: Proportion of Children in Child Poverty - March 2021
Source: Department for Education and Leeds City Council
Considering child poverty proportionally somewhat masks the true picture on the ground in Leeds,
however. Looking at West Yorkshire, rates of child poverty are significantly above the national
average. The rates of children in relative poverty before housing costs are deducted from income in
Leeds and Bradford are 24% and 38% respectively. In Leeds this equates to 36,496 children under the
age of 16 living in relative poverty. When you consider the administrative boundaries of the two cities,
both of which are wide and include notably more affluent outer areas, we can reliably assume rates
of child poverty in inner-city areas will be higher still. Bradford (48,100) has the second highest number
of children in poverty behind Birmingham, Leeds the fourth highest number and Kirklees (25,553) the
seventh most.
The Leeds child population is also growing fastest in the localities considered most deprived according
to IMD. Between 2012 and 2018 to overall Leeds population grew by 4% and the child population (age
0-17) grew by 7%. However, in the 10% IMD’s most deprived areas the child population grew by 13%,
and in the 3% most deprived it grew by 17%13.
Safeguarding
Between 2011 and 2020 (the latest nationally available data) there has been a 7% reduction in the
number of children looked after in Leeds. Across the same period, the number of children looked after
in England rose by 22%. Between March 2020 and March 2021, children looked after numbers fell
from 1,346 (80.0 per 10,000) to 1,278 (75 per 10,000). 48 of the 1,278 children looked after are
unaccompanied asylum seekers, compared to 60 at the end of March 2020. The 2020/21 national data
will be available in the autumn of 2021.
13 ONS 2012-18 estimates
20DRAFT
Figure 11: Children looked after at March 2020: Change from 2011 and Change from 2019
Source: Department for Education and Leeds City Council
Figure 12: Children looked after rates per 100k since March 2011
Source: Department for Education, March 2020
At the end of March 2021, 33 per 10,000 Leeds children were subject to a child protection plan (560
children in total). The latest nationally available data covers up to the end of March 2020 when the
England rate was 43 children per 10,000.
Health
Infant mortality
‘Infant mortality’ is the death of a live-born baby before their first birthday. Infant mortality rates have
seen a gradual downward trend over the period 2006-2019 in Leeds. The gap between deprived Leeds
and the city-average has fluctuated but data for the most recent period (2017-19) has shown an
increase. For Leeds overall infant mortality rates are close to regional and national averages. The latest
21DRAFT
analysis confirms the need to help ensure that parents are well prepared for pregnancy and that
families with complex lives are identified early and supported.
Figure 13: Infant Mortality Rate per 1000 births
Source: GP registrations and ONS mortality data
Child obesity
Analysis of healthy weight in children shows a gap between the most and least affluent communities
across the city (though ‘deprived Leeds’ and ‘least deprived Leeds’ in this data set equates to the most
and least deprived 20% according to IMD 2019, as opposed to 10% in the rest of the analysis). The gap
has slightly narrowed in recent years, although this is due to faster reduction in health weight in more
affluent communities, rather than an improvement in low income areas. The gap grows further as
children get older, although Leeds also does increasingly slightly better than regional and national
averages too.
Figure 14: Obesity % Healthy Weight in 4 to 5 year olds
Source: NHS National Child Measurement Program dataset
22DRAFT
Figure 15: Obesity % Healthy Weight in 10 to 11 year-olds
Source: NHS National Child Measurement Program dataset
Activity levels
The Active Lives survey undertaken by Sport England shows us that in 2019/20, Leeds children were
generally more active than the West Yorkshire average, with a higher proportion classed as active (av.
60+ mins of activity per day), and a lower proportion classed as less active (av. Less than 30 mins
activity per day). Using the same metrics, Leeds children are less active than the England average.
Figure 16: Children’s levels of activity – Academic year 2019-20
Source: Sport England Active Lives Survey 2019/20
Breastfeeding
Breastfeeding initiation rates in Leeds are lower than national rates but have increased since 2014;
and improvements have been observed in deprived Leeds. Breastfeeding continuation rates (6-8
weeks) are better in Leeds compared to national rates, although have dropped a little since 2013/14
and no improvement in deprived Leeds. The White population in Leeds has the lowest breastfeeding
23DRAFT
initiation and continuation rates of all ethnicities. Young mothers are also much less likely to initiate
breastfeeding.
Figure 17: Breastfeeding Initiation rates
Source: Public Health England Child and Maternal Health Profile
Vaccinations
The Leeds Measles Mumps and Rubella (MMR) immunisation level does not meet recommended
coverage (95%). However, the city is still performing better than England overall.
By age 2, 91% of Leeds children have had one dose, higher than the England average. By the age of
five, only 87% of Leeds children have received their second dose of MMR vaccination which, while not
on target, is still just higher than the England rate of 87%.
Figure 18: MMR vaccination coverage – one dose for 2 year-olds
Source: Public Health England Child and Maternal Health Profiles
24DRAFT
Oral health
Dental health is marginally worse in Leeds than England with more than a quarter (26%) of Leeds 5
year-olds having experienced dental decay compared to 24% in England.
Figure 19: Percentage of 5 year-olds with experience of visually obvious dental decay
Source: Public Health England Child and Maternal Health Profiles
Young people and alcohol
Nationally, the rate of hospital admissions of children and young people for conditions wholly
related to alcohol is decreasing and this is also the case in Leeds. The admission rate in the latest
period is similar to the England average.
Figure 20: Admission episodes for alcohol-specific conditions under 18s
Source:
Public Health England Child and Maternal Health Profiles
25DRAFT
Mental health
Nationally, the rate of young people being admitted to hospital as a result of self-harm is increasing.
This is not the case in Leeds, where there is no significant trend, although the latest admission rates
are worse than the England average. Nationally, levels of self-harm are higher among young women
than young men.
When considering mental ill-health overall, the Leeds rate of child inpatient admissions for mental
health conditions at 73.8 per 100,000 is better than the England average, although it has risen more
sharply in recent years. This data of course does not capture in full the broader mental health and
wellbeing of young people across the city.
Figure 21: Hospital admissions for mental health conditions under 18s
Source: Public Health England Child and Maternal Health Profiles
Sexual and reproductive health
There are approximately 10,000 births per year in Leeds - a third to women residing in deprived Leeds.
There has been an increase in the proportion of births to Black, Asian and ethnic minority women
since 2009, with ethnic minority groups overrepresented in deprived Leeds. There has also been an
increase in births to non-British born mothers.
In 2018, approximately 24 in every 1,000 girls aged under 18 in Leeds conceived. This is higher than
the national and regional rates; with the majority of births being to mothers in deprived Leeds.
26DRAFT
Figure 22: Under 18s conception rate
Source: Public Health England Child and Maternal Health Profiles
12% of women smoke while pregnant. Smoking in pregnancy rates are higher in Leeds than national
rates and are significantly higher amongst women who are under 18 years old at time of delivery –
with no improvement since 2014.
Education and learning
Covid-19 has had a significant impact on children and their learning, including no national assessment
prior to key stage 4 (GCSE). Young people taking GCSEs and A-Levels have received teacher-assessed
grades in place of national examinations and there has been some increase in grades. National analysis
assessing the differential impact of these changes on groups of young people suggests most previous
gaps have remained constant, although they have widened slightly for free school meal eligible
children and those from Gypsy Roma Traveller backgrounds. Further analysis assessing impacts in
Leeds will follow. As a result of these unique factors, data used for the JSA is predominantly up to
2019.
Leeds has a longstanding gap between more and less advantaged children achieving their potential,
particularly at pre-school and primary, and particularly for our most disadvantaged children. These
issues are very likely to have been exacerbated further by Covid-19. Overall, however, at the key
nationally monitored stages of 2 and 4 Leeds children as a whole make reasonable to good progress
in learning, comparable to their peers nationally at key stage 2 and above national rates in Leeds
secondary schools.
Early years
There have been some encouraging improvements in the proportion of children achieving the
expected level in the early learning goals, and the mean average total point score for the lowest
attaining 20% of learners is improving consistently and is now above national rates. In 2019, 66% of
Leeds children achieved a good level of development, up slightly from 2018. However, against this
indicator, Leeds remains behind national levels, but the gap has closed from 6.8 points in 2016 to 5.4
points in 2019.
27DRAFT
Children are measured across 17 early learning goals (ELGs) and it is determined whether their skills
are ‘emerging’, ‘expected standard’, or ‘exceeding’. In Leeds, the percentage of children ‘exceeding’
is consistently above national across all ELGs (except one, which is in line). However, there are more
pupils in Leeds than national in the ‘emerging’ category for ‘reading’, ‘writing’, ‘numbers’ and ‘shapes,
space and measures’. This indicates that, despite Leeds children having some of the highest
attainment nationally, there is also a significantly high level of low attainers.
Figure 23: Early Years Foundation Stage Profile – children achieving a good level of development (2015 to 2019)
Source: Department for Education and Leeds City Council
Key stage 2
Results at the end of Key Stage 2 focus on a child’s attainment and progress in maths, reading and
writing. Writing is based on teacher assessment, reading and maths on end of key stage tests. 62% of
Leeds year 6 children achieved the expected standard in reading, writing and maths, compared to 65%
per cent of children nationally.
There was a 6% increase between 2017 and 2018 in the proportion of disadvantaged pupils gaining
the expected standard in reading, writing and maths. However, this figure remained at 45% in 2019,
still 6% points below the national level for disadvantaged pupils. There remains a gap of 26% in
attainment between disadvantaged and non-disadvantaged pupils in Leeds, six points greater than
the national gap between these cohorts.
Key stage 4 and beyond
Headline measures at key stage 4 are based on the results of eight GCSEs or equivalent, including
English and maths. The overall achievement is known as Attainment 8. In 2019, the average
Attainment 8 score per pupil in Leeds was 45.1, which is slightly higher than in 2018 when it was 44.8.
The gap to national narrowed slightly, from 1.8 points in 2018 to 1.6 points. Disadvantaged children
in Leeds perform less well than their non-disadvantaged peers, gaining an average point score of 35.4,
compared to 49.4. This is also below the national figure for disadvantaged pupils which stands at 36.8.
42% of Leeds pupils achieved a strong pass in English and maths (grade five of higher) in 2019, very
slightly higher than in 2018. The national average for 2019 was 43%.
28You can also read