"Managers' Productivity and Recruitment in the Public Sector: The Case of School Principals" - 1303 February 2022
←
→
Page content transcription
If your browser does not render page correctly, please read the page content below

1303

                                           February 2022

“Managers’ Productivity and Recruitment in the Public
      Sector: The Case of School Principals”

              Pablo Munoz and Mounu Prem
Managers’ Productivity and Recruitment in the
        Public Sector: The Case of School Principals∗
                             Pablo Muñoz                Mounu Prem

                                               Abstract

          Governments face many constraints in attracting talented managers to the public
       sector, where high-powered incentives are often absent. In this paper, we study how a
       civil service reform in Chile changed the effectiveness of a vital group of public sector
       managers, school principals. We measure principals’ effectiveness using an extension
       of the canonical teacher value-added model and we evaluate the effect of the reform
       using a difference-in-differences approach. We find that public schools appoint more
       effective managers after increasing the competitiveness and transparency of their se-
       lection process. Our result shows that better recruitment policies can enhance service
       provision in the public sector, despite rigid wage schemes.

          Keywords: Managers, Public sector, Recruitment, School principals

   ∗
     This version: February, 2022. We are particularly indebted to David Card, Fred Finan, and Jesse
Rothstein for their advice and support at different stages of this project. We are also grateful to Ernesto
Dal-Bó, Alonso Bucarey, Christopher Campos, Dante Contreras, Alessandra Fenizia, Deon Filmer, Patrick
Kline, Mathieu Pedemonte, Miguel Purroy, Tatiana Reyes, Damian Vergara, and Christopher Walters for
great feedback; and to the participants at the UC Berkeley Labor Economics and Political Economy sem-
inars, the World Bank Research Group, the CAF Development Bank of Latin America, the 2nd Bank of
Italy Human Capital workshop, the CEA - UChile economics seminar, NEUDC, the PUC applied microe-
conomics seminar, and the U. of Edinburgh economics seminar, for their comments and suggestions. We
thank the Civil Service, the Superintendencia de Educación and the Unidad de Estadísticas del Ministerio
de Educación for their help with the data. The views expressed here are those of the authors and do not
reflect the views of these institutions. We are grateful to the Spencer Foundation and the Coordenação de
Aperfeiçoamento de Pessoal de Nível Superior - Brasil (CAPES) - Finance Code 001 for financial support.
Prem acknowledges IAST funding from the French National Research Agency (ANR) under the grant
ANR-17-EURE-0010 (Investissements d’Avenir program). José Niño and Luis Serrano provided excellent
research assistance. Pablo Muñoz, FGV EPGE Brazilian School of Economics and Finance, Brazil. Email:
pablo.munoz@fgv.br. Mounu Prem, Universidad del Rosario, Department of Economics, Colombia. Email:
francisco.munoz@urosario.edu.co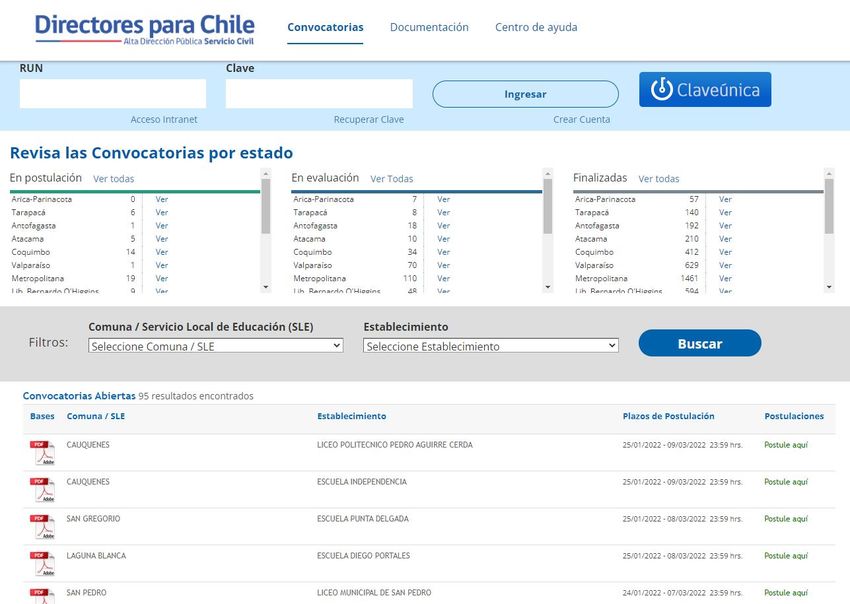
1    Introduction

Management is a key resource of both private and public enterprises (Bloom et al., 2013,
2015), but identifying and recruiting effective managers remains challenging. This problem
is especially ubiquitous in the public sector, where discretionary appointments and patron-
age can be pervasive (Xu, 2018; Colonnelli et al., 2020), and where incentive schemes are
hard to define and mostly absent (Lazear and Shaw, 2007; Finan et al., 2017). Empir-
ical progress in this area has faced at least two important hurdles. First, the dearth of
data makes it difficult to objectively measure managers’ performance in the public sector.
Second, it is hard to find quasi-experimental variation in the allocation of public sector
positions.

In this article, we overcome previous limitations by focusing on “street-level” bureaucrats
(Besley et al., 2021) and by leveraging the institutional setting and the rich administrative
data of Chile. We study the case of school principals, managers of high practical relevance
for the delivery of public services, and thus for state capacity. Studying managers in the
Chilean educational context is appealing for three main reasons. First, we can use adminis-
trative data on student performance in a “value added” framework to construct an objective
measure of principals’ effectiveness. Second, the largely publicly funded but privately run
school system in Chile (Hsieh and Urquiola, 2006; Epple et al., 2017) provides a natural
benchmark for evaluating the public system. Third, and most importantly, variation from
a civil service reform allows us to assess the impact of more competitive and transparent
personnel selection policies on the effectiveness of public schools’ managers.

Our setting offers a clear testing ground to evaluate Max Weber’s hypothesis that the
separation of bureaucracy and politics leads to a more effective public service (Weber,
1922). Since the eighties, the recruitment of public schools’ principals in Chile has been the
exclusive responsibility of the municipalities. This has given local politicians a significant
degree of discretion over the appointments of school personnel, a feature that in a similar
context has been associated with negative effects on students’ outcomes (Akhtari et al.,
2020). To reduce politicians’ discretion over the appointment of school principals, in 2011
Chile enacted a reform that modified the selection of school leaders. Under the new system

                                              1
of selection, local politicians still have a say in principals’ appointments but only after a
competitive and transparent competition has shortlisted a subset of candidates based on
their merit and suitability. These competitions are publicly advertised, led by a third-party
human resources agency, and are overseen by the Civil Service, the agency responsible for
selecting the highest-level bureaucrats of the central government.

In order to assess the impact of this reform, we first develop a novel extension of the
teacher value-added model to disentangle the effectiveness of the school principal from that
of her teaching staff and other school-related factors. We find that a one standard deviation
increase in principal effectiveness raises students’ course grades by 0.29 standard deviations.
Teachers’ surveys and event studies around the timing of arrival/departure of principals
validate our measure of effectiveness. Then, we use a difference-in-differences approach
to compare the change in principal effectiveness arising from a new appointment under
the reformed selection system to the change in principal effectiveness arising from a new
appointment at private schools. We find that, despite having rigid wage schemes, public
schools were able to attract more effective managers (a 0.06 standard deviation increase)
after changing their selection process. We find similar results when we only keep public
schools for estimation, therefore identifying the effect of the reform from variation in the
timing of adoption of the new selection system.

A key feature of our analysis is the use of rich administrative data to estimate an output-
based measure of principals’ effectiveness. Our model relates students’ academic achieve-
ment to school characteristics, and to the fixed effects of 64,770 teachers and 8,061 princi-
pals. In Chile, students do not take standardized tests every year, which prevents us from
using test scores to measure teachers’ and principals’ effectiveness. Instead, we use stu-
dents’ course grades in Mathematics and Spanish. In the Chilean setting—with a national
curriculum—course grades are both highly relevant and informative. Indeed, course grades
determine both grade retention and high school graduation, and are also an important
determinant of college admission and access to financial aid (Hastings et al., 2013).1 More-
over, course grades are strongly correlated with contemporaneous standardized test scores
(typically administered in fourth and eighth grades), supporting the view of using them
interchangeably (Borghans et al., 2016);2 and they are also known to capture non-cognitive

   1
      In 2017, course grades and contextual course grades had an average weighting of 40% in the college
admission score. As shown by Panel A of Figure A.1, a one standard deviation increase in course grades
was associated with a 0.8 standard deviation increase in college admission scores.
    2
      Panel B of Figure A.1 shows a strong relationship between test scores and course grades. In a sample
of students for whom we observe SIMCE test scores and course grades contemporaneously for Math and

                                                    2
traits that play an essential role in academic and labor market performance (Bowles and
Gintis, 1976; Bowles et al., 2001; Heckman et al., 2006; Jackson, 2018).3

Accommodating principals’ effects into the canonical teacher value-added model is chal-
lenging. On the one hand, it is necessary to distinguish principals’ effectiveness from that
of their teaching staff. On the other hand, it is necessary to disentangle the effect of the
principal from other school-level factors. To tackle the first challenge, we follow the semi-
nal work of Abowd et al. (1999), and estimate a two-way fixed effects model that leverages
teachers’ and students’ switches across principals (within the largest connected set) to sep-
arately identify principals’ and teachers’ effectiveness. To address the second problem, we
follow the seminal work of Mundlak (1978), and the more recent work of Altonji and Mans-
field (2018), and include several school-level controls in a correlated random effects fashion.
This approach allows us to obtain an estimate of effectiveness for all school principals, while
avoiding problems of weak identification that could arise if we added school fixed effects in
this setting (Jochmans and Weidner, 2019). Our estimates of principal effectiveness, ad-
justed by its “reliability” (Krueger and Summers, 1988; Aaronson et al., 2007), imply that
a one standard deviation increase in principal effectiveness raises students’ course grades
by 0.29 standard deviations.

We perform several exercises to show that our objective measure of principal effectiveness
is sensible. First, in the spirit of Chetty et al. (2014) and Angrist et al. (2017), we use
event studies of principals’ arrivals and departures, and show that student achievement
changes sharply after event time as predicted by our measure of principal effectiveness.
Second, since our model considers additive teacher and principal effects, we perform a
specification check to show that our results are consistent with the symmetry implications
of an additive two-way fixed effects model with exogenous mobility (Card et al., 2013).
Third, we leverage soft data from teachers’ surveys and show that more effective principals
are associated with a larger fraction of their teaching staff highly agreeing with positive
statements about them. Finally, we also study how principals matter. Using administra-
tive data from different sources we show that principals’ effectiveness is associated with
fewer parents’ complaints about bullying and denying enrollment, and with lower rates of
teachers’ turnover, especially among high value-added teachers.

Spanish, we find that a one standard deviation increase in course grades is associated with a 0.6 standard
deviation increase in test scores.
   3
     A concern about grades, however, is that some teachers may have an incentive to inflate their grades.
We address this issue following Peteck and Pope (2019) and relating exposure to a teacher at time t to the
change in course grades from the past year to the year ahead (i.e., GPAt+1 − GPAt−1 ).

                                                    3
After validating our measure of principal effectiveness, we focus on the labor market of
school principals. A descriptive analysis reveals that the compensation of most public-
school principals is rigid and mainly based on statutory payments, and that the association
between principals’ effectiveness and wages is weaker in public than in private schools. With
little room for rewarding performance, the public sector must rely on alternative strategies
to attract and retain effective workers (Khan et al., 2019; Bertrand et al., 2020). In this
paper, we focus on one of such strategies: personnel selection. To motivate our analysis, we
develop a two-sided selection model which highlights that higher wages might not suffice
nor be the only relevant variable if workers’ choice also depends on their idiosyncratic
preferences and the labor demand that they face.4 An important take away from the model
is that poor selection policies may cause public schools to lose talented managers who would
take a position despite a lower payment because of strong idiosyncratic preferences for the
public sector (e.g., pro-social behavior).
Although identifying and curating talent is of theoretical and practical relevance for the
public sector, evidence on this issue remains elusive. To study this empirically, we im-
plement a difference-in-differences research design that compares the change in principal
effectiveness arising from a new appointment under the reformed selection system to the
change in principal effectiveness arising from a new appointment at private schools. We
show that limiting the discretion of local politicians over the appointment of public school
managers increases principal effectiveness by 0.06 standard deviations. Reassuringly, the
dynamic version of our difference-in-differences approach provides visual support to our
identification strategy; and we further complement this using a sensitivity test for viola-
tions of the parallel trends assumption (Rambachan and Roth, 2021) and a correction for
potential bias coming from pre-treatment differential trends and pre-testing (Roth, 2021).
A plausible concern is that other changes brought about by the 2011 reform could confound
our previous estimates comparing public to private schools. Reassuringly, we find similar
results when we only keep public schools for estimation, and therefore we identify the
effect of the reform from variation in the timing of adoption; a result that is robust to the
recent developments in the literature of staggered difference-in-differences models under the
presence of heterogeneous treatment effects (De Chaisemartin and d’Haultfoeuille, 2020;
Callaway and Sant’Anna, 2020). Moreover, placebo exercises looking at principal turnover
4
As underscored by economists and sociologists in the past (Abowd and Farber, 1982; Logan, 1996),
when choice is constrained by opportunity, personnel selection can accentuate or counteract the sorting of
workers based on wages.
4at private schools during the post-reform period as well as principal turnover at public
schools during the pre-reform period fail to detect positive effects on principal effectiveness.
In like manner, an event study around the time of new appointments of school principals
shows that—before the civil service reform was enacted—principal turnover did not affect
principal effectiveness deferentially among public and private schools.
We conclude with a brief discussion on the impacts of the reform on school personnel,
students’ long-run outcomes, and equity. Our analysis suggests that the appointment of
principals elected under the new selection system increased the likelihood of firing poorly
evaluated teachers and it also increased students’ college admissions test scores. In light of
existing research documenting positive sorting induced by admission scores into enrollment
at more selective institutions (Rodríguez et al., 2016) and the positive returns associated
with more selective degrees in Chile (Hastings et al., 2013; Zimmerman, 2019), we conjecture
positive long-run effects on students’ outcomes. Finally, in terms of equity, a back-of-the-
envelope calculation suggests that the impact of the reform on principals’ effectiveness was
enough to reduce the public-private course grade gap by half in 5 years.
1.1 Related literature
Our paper contributes to different branches of economic research. First, it contributes to
the literature on state capacity and personnel economics (Lazear and Shaw, 2007; Finan
et al., 2015; Besley et al., 2021). Recent studies have shown that patronage is a common
feature in public sector appointments (Xu, 2018; Akhtari et al., 2020; Colonnelli et al., 2020;
Voth and Xu, 2020), with mixed findings regarding its effects on state capacity. Likewise,
evidence on the role of performance-based hiring is still limited (Ornaghi, 2019; Scot et al.,
2021; Moreira and Pérez, 2021). More broadly, our paper relates to research showing that
different selection policies and incentive methods can attract different types of public sector
workers (Ferraz and Finan, 2011; Dal Bó et al., 2013; Finan et al., 2017; Deserranno, 2019;
Deserranno et al., 2019; Ashraf et al., 2020). Closer to our work, Estrada (2019) studies
the effect of decreasing the share of teachers hired under discretion and finds that it has
a positive effect on school-level outcomes. We contribute to this literature by focusing on
managers and by showing that a more transparent selection system based on third-party
screening leads to the appointment of more effective workers.
Second, our work speaks to a growing literature on the importance of management and
5management practices in the private sector (Bloom and Van Reenen, 2007; Bloom et al.,
2013; Bender et al., 2018) and public sector organizations (McCormack et al., 2014; Bloom
et al., 2015; Lavy and Boiko, 2017; Rasul and Rogger, 2018). Closer to our study, Fenizia
(2021) uses an objective measure of managers’ performance and provides sound and novel
evidence on the importance of managers in the Italian bureaucracy. Like her, we construct
an objective measure of managers’ effectiveness (albeit in a different context). In contrast to
her, we are able to use quasi-experimental variation in the allocation of managers’ positions.
Third, our paper also contributes to the economics of education literature. Related re-
search on school principals has focused on the effect of principal attributes on students’
performance (Eberts and Stone, 1988; Clark et al., 2009; Béteille et al., 2012) or on the
measurement of principal value-added in isolation (Branch et al., 2012; Coelli and Green,
2012; Dhuey and Smith, 2014; Grissom et al., 2015). We add to this literature by providing
an estimation framework that accounts for key inputs in the education production function
to disentangle principal effectiveness. In this regard, our paper also adds to the literature
on value-added models (Kane and Staiger, 2008; Rothstein, 2010; Kane et al., 2013; Chetty
et al., 2014; Bacher-Hicks et al., 2014; Bacher-Hicks et al., 2014; Rothstein, 2015; Chetty
et al., 2016; Angrist et al., 2017). Finally, our work complements studies on school person-
nel (Rothstein, 2015; Biasi, 2021; Loyalka et al., 2019; Brown and Andrabi, 2020; Leaver
et al., 2021) and the labor market of school principals (Cullen et al., 2016). In contrast to
previous research in this area, we study a setting where high-powered incentives are hard
to implement, and thus our focus is on personnel selection instead of pecuniary incentives.
2 Background and Data
This section describes the main educational reforms implemented in Chile since the eighties,
with a special focus on the 2011 reform. It also describes the data used in our analysis and
presents some descriptive statistics.
2.1 Background
In 1981, under a dictatorship, Chile implemented an educational reform that privatized
and decentralized primary and secondary education. Publicly funded school vouchers were
6created with flat voucher funds following any children either to public schools or to the
private schools that agreed to accept the voucher as payment of tuition.5 These vouchers
provided full coverage of tuition fees in public schools, but not necessarily in private subsi-
dized schools, which were allowed to charge fees on top of the part covered by the voucher.
The reform was predicated upon the idea that, since parents were free to choose between
schools, market forces should lead to an increase in the quality of education through school
competition.6 The laissez faire architecture of this system is still in place today, making
the Chilean case unique for having long-term experience with nationwide school vouchers
where both governmental and private schooling sectors coexist and compete. As of 2018,
enrollment at private, subsidized private, and public schools represented 7, 53, and 40
percent, respectively.
Alongside with the privatization of the educational system, the 1981 reform also decentral-
ized it by transferring control of public schools from the central government to municipal
authorities. Administrative departments of municipal education and municipal education
corporations were created to administrate the public schools. Not surprisingly, the efficacy
and probity of these departments/corporations were strongly related to that of the local
governments (Guerra and Arcos, 2012). As a consequence of this change, many school
teachers from public schools lost their jobs and had to either reapply for them now in
the municipalities or find jobs in the private sector. Moreover, in order to free the labor
market of teachers, union contracts were revoked, giving public schools greater flexibility
in hiring and firing teachers. During the period we study, public school teachers once again
belong to a national teachers’ union and their wages are determined by a rigid formula
that is negotiated between their union and the government. Wages are subject to seniority
increments and other adjustments such as allowances for leadership responsibilities, pro-
fessional training, and for working in difficult conditions. Teachers in private schools are
also eligible for some of these allowances, but they are mainly subject to the Private Labor
Code, implying that their wages are individually negotiated with the schools.
The “Quality and Equity in Education” Reform: In 2011, the country enacted a law
aimed at improving quality and equity in education (Law N. 20.501). The law recognized
school principals as key agents to improve quality in public schools and created a new
system to appoint them. Before the reform, the appointment of public school principals
5
A reform in 2008 established a new voucher targeted to low-income students. This represented the
first major change to the voucher policy program. For an evaluation of this policy, see Neilson (2019).
6
Evidence on whether public or private schools are relatively more effective in improving students’
learning is mixed (e.g., Hsieh and Urquiola, 2006; Contreras et al., 2020).
7was the exclusive responsibility of the municipalities; this process was unsupervised by
the central government and consequently, it was prone to patronage. After the reform,
principals are elected through public, competitive, and transparent contests.
The new selection process is overseen by the Civil Service,7 but municipalities are still re-
sponsible for the processes. The contests must be disseminated on newspapers, the website
of the municipalities, and the website of the Civil Service www.directoresparachile.cl. As
shown by Appendix Figure A.2, calls are widely advertised and information on open, on-
going, and finished contests is publicly available to all potential candidates. After having
received the background information and having defined the admissibility of the applicants,
an external human resources company is hired to perform the pre-selection of candidates.
This process includes a curricular analysis and psycho-labor evaluations. The external com-
pany specialized in the selection of candidates is chosen by the Civil Service from a pool of
registered companies. Then, an independent qualifying commission, integrated by a repre-
sentative of the Civil Service, the head of education of the municipality, and an outstanding
teacher (chosen by lottery) conducts the interviews with the candidates shortlisted by the
human resources company. After these interviews, the qualifying commission defines a list
of 3 to 5 candidates; and this list is then sent to the mayor who makes the final decision.
The duration of a contest, from the announcement to the definition of the short-list of
candidates takes approximately 100 days. Each contest must comply with the principles of
i) non-discrimination: the process cannot discriminate based on sex, age, religion, politics,
sexual orientation, gender identity, civil status, disability, or others. The selection must
only consider merit, training, experience, and skills required for good job performance; ii)
confidentiality: the actors involved in the selection process must keep the identity of the
candidates confidential, and all data must be protected under legal regulations; iii) public-
private participation: external consultancies from expert companies or natural persons,
registered with the Civil Service, are part of the process.8
The adoption of the new selection system was staggered over time. The authorities estab-
lished that new appointments would be required to go through the new system once the
director who was in office (as of 2011) had completed a period of five years (Ruiz-Tagle,
7
As established by Law, the Civil Service is mandated to act as “the guarantor of the merit and
suitability of the applicants, in public, competitive, and transparent competitions to recruit professionals
with pedagogical leadership, management capacity, and strategic vision.”
8
For more details, see Silva (2014) and “Alta Dirección Pública y Reforma Educacional” (available at:
https://www.serviciocivil.cl/sistema-de-alta-direccion-publica-2/adp-educacion/).
82019). However, no clear sanctions were established in the event that this provision was not
complied with (Errázuriz et al., 2016). Moreover, the Civil Service and the municipalities
had to incur costs associated with running the contests (Silva, 2014), and not all processes
concluded with an appointment.9
The reform also established that public school principals i) would be allowed to form their
own management teams without having to call a contest for those positions, i.e., they can
choose the Deputy Director, the Inspector General, and the Chief Technician of the school;
ii) can fire up to 5% of teachers with a bad or regular teacher evaluation; and finally, iii)
they get a bonus consistent with their responsibilities, in accordance to a rule that depends
on the total number of students enrolled and the concentration of poor students in the
establishment where they work. The reform included other measures as well, such as a new
retirement plan for teachers, bonuses for teachers with good evaluations, adjustments to
the severance payments, the introduction of public contests for the position of educational
superintendent, more rights for teachers and teacher assistants, and more funding for both
public and subsidized private schools. For more details about the reform, see “Ley 20.501
Calidad Y Equidad de la Educación.”
The school system: Like many countries, Chile has a nationwide standardized curric-
ula.10 The Chilean curriculum is determined by the Ministry of Education for each grade
and subject, and it affects the school curricular offerings and the instructional resources
directly. It also works as a system of accountability (Valverde, 2004). Indeed, as exempli-
fied by Figure A.4 in the Appendix, the government not only provides teachers with the
curriculum guides and official textbooks, but also with lesson plans and exams. Curricu-
lum guidelines establish minimum content goals and fundamental objectives for education,
which ultimately determine course grades and grade retention. Students are evaluated con-
tinuously throughout the year, and, in general, each subject’s annual grade is based on
more than four evaluations. Teachers in a particular subject determine the course grade in
that subject. Grades are awarded on a scale from 1 to 7 in intervals of 0.1, with a minimum
passing grade of 4. The Ministry of Education also administers a national standardized test
called SIMCE. This test is taken annually but only by students in the 4th, 8th, and 10th
9
According to the records from the Civil Service, of the 4,305 competitions called between 2011 and
2017, 63.7% resulted in appointments, 23.4% were resolved as deserts, and 11.3 % were overridden. The
rest did not conclude with an appointment for admissibility problems or because it was not possible to
carry out the external evaluation stage (Ruiz-Tagle, 2019).
10
Countries that have a national curriculum include: France, Hungary, Ireland, Italy, Japan, Korea, the
Netherlands, New Zealand, Norway, Portugal, Singapore, Spain, and the United Kingdom. While most
states in the U.S. follow common guidelines for a core curriculum, there is no national curriculum as such.
9grades. Finally, to gain admission into higher education, most students take a standardized
college entrance exam known as PSU. Students must complete exams in mathematics and
language, and many students also take optional tests in other subjects. Entrance exam
scores, along with high-school GPA, are the primary components of the composite scores
used for post-secondary admissions, scholarships, and student loan eligibility (Hastings
et al., 2013). Students who are not admitted through the centralized admission system
enroll in non-selective technical or professional schools or in newer universities operating
outside the centralized system.
2.2 Data and descriptive statistics
We use administrative data from the Ministry of Education, the Superintendency of Edu-
cation, and the Chilean Civil Service.
To estimate principals’ effectiveness, we use a panel at the student-year-subject level. This
panel spans the period from 2011 to 2016 and has information on the academic perfor-
mance of all students, by subject and classroom, from the first through the twelfth grade.
Specifically, the students’ records contain their gender, age, subject-specific course grades,
attendance rate, and promotion status. For cohorts of students that take standardized
exams, it is also possible to link our data to their test scores in Math and Spanish.11 We
match this data set with a nationwide census of teachers containing rich information on
the specific subjects and classrooms taught by them every year, as well as their character-
istics (e.g., gender, age, type of degree, hours of contract). For a subset of these teachers,
we recover their perceptions about the school principal from survey responses collected by
the government. We also leverage data from a yearly school panel that includes several
school characteristics such as the type of administration (e.g., public, subsidized-private, or
private), an indicator if the school is located in a rural area, its total enrollment, fraction
of disadvantaged students, fraction of parents with a college degree, parents’ income level,
the identity of the school principal, and whether she or he was elected through the new
selection system. We complement this data with the characteristics of the municipalities
where the schools are located. We consider all schools to estimate principals’ and teachers’
effectiveness, except preschools, adults’ schools, and special education schools.
11
As mentioned before, the SIMCE examination is only taken by students in specific grades, usually
4th, 8th, and 10th grade, and it has not been systematically run every year in the country.
10Our analysis of the principals’ labor market uses detailed administrative data from the
Superintendency of Education. In Chile, every school that receives a voucher from the gov-
ernment must provide a detailed report of their sources of income and their expenditures.
These records allow us to observe all compensations paid to every school worker, by month,
between 2015 and 2017. We classify compensation items into three categories: minimum
wage, statutory payments, and bonuses. Minimum wage corresponds to a per-hour legal-
minimum payment for teachers, defined by the Ministry of Education. Statutory payments
include compensation components regulated by law but unrelated to performance, such as
payments for experience and for teacher certification; it also includes other payments as-
signed to those who work extra hours, in rural schools, or in schools where it is “difficult” to
teach according to the Ministry of Education. Finally, bonuses encompasses compensation
components related to workers’ performance, such as individual and collective performance
bonuses, payments from the national system of performance assessment, bonuses paid di-
rectly by the school owner in the case of subsidized private schools, and other discretionary
payments and gratifications related to transportation, food, and holidays. On average, prin-
cipals earn around 2,700 USD per month. According to the representative survey CASEN
(in 2015), the wage of school principals is placed at the 65th percentile of the wage dis-
tribution (or the 51st percentile when we only consider workers from similar cohorts and
who attained higher education). The average monthly wage of 2,739 USD corresponds to
roughly 11 times the legal minimum wage.
Table 1 presents detailed descriptive statistics of students, schools, and principals at public
and private schools. Panel A, which focuses on students’ course grades, test scores, and
grade retention, shows that students attending private schools obtain higher course grades
and test scores (0.25 and 0.5 standard deviations respectively) and are almost 4 percent
points less likely to fail a grade. In terms of school characteristics, Panel B shows that
private schools tend to serve students who obtain (on average) higher scores for college
admission. They also serve more students, have larger classrooms, have fewer teachers per
student, and have slightly better attendance. Some of these differences are likely related
to the fact that only 21% of private schools are in rural areas versus 63% of public schools.
In terms of school finance, public schools receive a larger subsidy but they also serve more
disadvantaged students. The share of students considered poor, and who are therefore
eligible for special subsidies, is 57% in public schools and 32% in private schools. Finally,
Panel C of Table 1 presents the descriptive statistics of principals’ demographics and wages.
Compared to private schools, public schools pay lower wages to the principals and their
compensation relies more on statutory payments and less on bonuses. In public schools,
1135% of the wage corresponds to the base, 56% to statutory payments, and only 11% to
bonuses, while in private schools these figures correspond to 51, 26, and 24 percent. In
terms of demographic characteristics, public school principals have more tenure and most
of them are male; this is in contrast to private schools, where 61% are female.
3 Estimation of Principals’ Effectiveness
In this section, we present the model used to measure principals’ effectiveness and we
document the importance of school principals for students’ outcomes. We also perform
several exercises to validate our model, and study what principals do within schools.
We consider a specification that relates academic achievement to student characteristics,
school characteristics, and to the teachers and school principal, as follows:
Yit+1 = γt + ρg(i,t) + β0 f (Yit−1 , Ȳit−1 , ρg(i,t) ) + β1 Xit +
µj(i,t) + θp(i,t) + φ0 Xs(i,t)t + φ1 X̄s(i,t) + eit+1 , (1)
| {z } | {z } | {z }
teacher FE principal FE ψs : school CRE
where Yit+1 is the course grade obtained by student i in year t + 1, γt and ρg stand for year
and grade fixed effects, and f (Yit−1 , Ȳit−1 , ρg(i,t) ) is a standard third degree polynomial at
the student and classroom level in the lagged dependent variable interacted with students’
grade level (Kane and Staiger, 2008; Chetty et al., 2014). Importantly, we focus on future,
instead of contemporaneous, course grades while restricting the sample to students for
whom the teacher, in a given subject, changed between t and t + 1. We do so, to remove
systematic bias from teachers evaluating their own students (Peteck and Pope, 2019).12
We also control by students’ age, principal’s tenure Xit , and a set of time-varying and
across-time averages of school-level characteristics Xs(i,t)t and X̄s(i,t)t .
Since we only observe a subset of principals switching between schools, we do not include
school fixed effects. Instead, we use correlated random effects (Mundlak, 1978; Cham-
berlain, 1980) to account for school heterogeneity. Specifically, we include a combination
time-varying and across-time averaged characteristics of each school s (i.e., Xs(i,t) and
12
Intuitively, our specification gives credit to a math teacher if her students improved their math course
grade after having her as a teacher, controlling by the students’ past achievement. This avoids confounding
easy-graders with high value-added teachers.
12X̄s(i,t) ). Time-variant school characteristics include total enrollment, the fraction of dis-
advantaged students, the share of low-income and high-income parents, and the share of
parents with a college degree. Fixed school characteristics include the across-time average
of the previous list of time-variant characteristics plus indicators for whether the school is
public, subsidized private, or private, and for whether it is located in a rural area. Follow-
ing Wooldridge (2010), we also add the across-time average of year fixed effects dummies
to account for our unbalanced panel. As in Altonji and Mansfield (2018), this approach
attempts to absorb the across-schools variation in unobservable school characteristics by
controlling for the school averages of its observed characteristics.
To estimate our model, we leverage a panel at the student-subject-year level from 2011
to 2016, and we focus on the performance of the student in the two subjects for which
we observe course grades every year: Math and Spanish. We exclude preschools, adults’
schools, and special education schools from our analysis. We also exclude classes that
had more than one teacher per year and eliminate the bottom and top one percent of
classroom size outliers. By taking teacher effects into account directly, our empirical model
disentangles the effectiveness of the school principal from the effectiveness of the teaching
staff. Since the teacher µj(i,t) and principal θp(i,t) fixed effects in (1) are identified by movers
and can only be compared within connected sets (Abowd et al., 1999), we estimate our
model within the largest connected set of teachers and principals. Our final estimation
sample includes 7,735,683 student-subject-year observations, corresponding to 1,977,231
students, 64,770 teachers, and 8,061 principals. Reassuringly, as shown by Table A.1 in the
Appendix, we do not find strong evidence of selective sample attrition in terms of grades,
subject, attendance, student performance, or teachers’ characteristics.
The empirical distributions of our principals’ and teachers’ fixed effects estimates are plotted
in Appendix Figure A.3. The standard deviation of our principal fixed effects is 0.39; in
other words, one standard deviation in principals’ effectiveness is associated with a 0.39
standard deviations increase in students’ course grades. Likewise, the standard deviation
of teacher fixed effects is 0.41. Although for each principal p = (1, ..., P ), her estimated
effectiveness θ̂p(i,t) is an unbiased estimate of her true effect on students’ achievement,
the standard deviation of θ̂p(i,t) , which summarizes the overall variability in principals’
effectiveness, is an upwardly biased estimate of the standard deviation of θp(i,t) . This
occurs because θ̂p(i,t) equals θp(i,t) + ˆp , where ˆp is a least squares sampling error. This
bias can be more serious for quadratic forms of teachers’ fixed effects because of the small
populations of students used to identify their value-added. Moreover, in our two-way fixed
13effects setting, quadratic forms might also be biased due to “bottlenecks” in the connected
set (Jochmans and Weidner, 2019; Kline et al., 2020).
To account for this issue—and since our focus is on school principals—we compute the
adjusted standard deviation of θ̂p(i,t) using the formula proposed in Krueger and Summers
(1988): v
u
XP
SD(θp ) ≈ var(θp ) − ˆ
u
t σ̂ 2 /P , p
p=1
where σ̂p2 is the standard error of θ̂p(i,t) . Consistent with the prevalence of bias in vari-
ance components, the adjusted standard deviation of principal effectiveness corresponds to
0.29.13 We leverage the previous estimate of the true variation in principal effects and the
estimation error to rescale our measure of principal effectiveness by its “reliability”. Fol-
lowing the teacher value-added literature (Aaronson et al., 2007), we shrink our estimates
of principal effectiveness to obtain an adjusted measure θp∗ , as follows:
σp2
θp∗ = θ̂p × , (2)
σp2 + σ̂2
where θ̂p is our OLS estimate of the value added by principal p, σp2 is our estimate of the
“true” variation in principal effectiveness (calculated as described above), and σ̂2 is the
noise associated with the estimate of principal p’s effect, namely, the estimation error for
θ̂p . To alleviate concerns related to measurement error, we use this adjusted measure of
principal effectiveness θp∗ through the paper.
Finally, in Appendix Table A.2, we document how estimated principal effectiveness cor-
relates with observable characteristics. To do so, we regress the estimated principal fixed
effects from (1) on age, age squared, gender, and indicators for holding a college degree
and for their experience in previous “schooling type” of positions. Female principals appear
to be on average more productive than their male counterparts. Principal effectiveness is
also strongly correlated with experience and depicts a concave profile at public schools.
While interesting, these correlations could be explained by differential selection patterns
into schools and managerial career. Thus, they should not be interpreted causally.
13
It is worth noticing that this adjustment neglects the covariances among the p , slightly underesti-
mating the standard deviation of θp(i,t) .
143.1 On the validity of our estimates
Identification assumptions: In our setting, principal fixed effects would identify the
causal effect of principals on students under a strict exogeneity or selection on observables
assumption, i.e., conditional on observable characteristics and teacher fixed effects, the
correlation between the assignment of students to principals and other determinants of
students achievement is innocuous. Although this identification assumption is ultimately
untestable —what Holland (1986) called “the fundamental problem of causal inference”—
we can leverage the panel structure of our data to implement some of the validation exercises
proposed in this literature (Rothstein, 2010; Chetty et al., 2014). We begin by presenting
quasi-experimental evidence from an analog to the ideal experiment of random principal
assignment to schools. In the spirit of Chetty et al. (2014) and the omnibus test in Angrist
et al. (2017), our design exploits principal turnover for identification.
This quasi-experimental design rests on the identification assumption that principal turnover
within a school is uncorrelated with student and school characteristics.14 We begin with
event studies looking at the evolution of course grades around the events of entry and exit
of low and high value added principals (Figure 1). Naturally, for this exercise, we restrict
the sample to the subset of principals who switched schools between 2011 and 2016 (the
period for which course grade data is available), and who belong to the top or bottom of
the principal effectiveness distribution. Let year 0 denote the school year that a principal
enters or exits a school and define all other school years relative to that year (e.g., if the
principal enters in 2013, year 2011 is -2 and year 2015 is +2). We define an entry event
as the arrival of a principal whose effectiveness is either in the top or bottom 20% of the
distribution of principal effectiveness, and we define exit events analogously.
Figure 1, panel A, plots the impact of the exit of a low value-added principal on mean course
grades. The series plots school-year means of standardized course grades in the two years
before and after a low value-added principal exits the school. We do not condition on any
other covariates in this figure: each point simply shows average course grades for different
years within a school. The change in mean course grade gains in the school in which the
low value-added principal exits are 0.07 SD from year -1 to 1. The null hypothesis that this
change is 0 is rejected with p < 0.001. More importantly, the magnitude of the increase in
mean course grade gains is very similar to the change in mean principal effectiveness, which
14
Although untestable, this assumption is plausible insofar as teachers and students are unlikely to
immediately switch to a different school because the principal changed.
15is 0.09. Consistent with the idea that our estimates of principal effectiveness are forecast
unbiased, the null hypothesis that the observed impact on mean gains equals the increase
in mean value-added cannot be rejected (p = 0.35). The remaining panels of Figure 1
repeat the event study in Panel A for other types of arrivals and departures. In all but
the last panel, the change in course grade gains is significantly different from 0 with p <
0.05 and is not significantly different from what one would forecast based on the change in
mean principal effectiveness. These event studies show that student achievement changes
sharply across time as predicted by the change in principal effectiveness, when high or low
value-added principals enter or exit a school.
To complement the previous exercise, we also implement a falsification test similar to that
in Rothstein (2010). We focus on a subset of students who switched schools and who were
consequently exposed to more than one principal. The intuition of the test is simple: if the
effectiveness of the principal in the school of destination impacts students’ learning in the
school of origin, that would be evidence of model misspecification. To better approximate
the ideal experiment that assigns students to different principals, we focus on students
attending schools that do not offer secondary education at the time of their transition to
high school. We find 11,542 such events. For this test, we compute “jackknife” estimates
of principal effectiveness and consider both a model of gains and a model with lagged
dependent variable. As shown by Appendix Table A.3, we do not find much evidence of a
positive correlation between the standardized course grade gains of the students (the pre-
assignment variable) and the effectiveness of their future principal (the treatment variable).
It is worth noticing that failing to reject the null hypothesis that future principals have an
impact on current achievement does not guarantee that there is no sorting. Thus, we take
this evidence only as suggestive.
Two-way fixed effects specifications are simple and tractable. Nevertheless, when used
for estimating worker and firm fixed effects, these specifications are prone to be criticized
(see Card et al., 2018 for a discussion).15 Since our model also considers additive teacher
and principal effects, one might be worried about the bias in our measure of principal
effectiveness. We address this issue in the spirit of Card et al. (2013) and plot the mean
course grades of the students taught by teacher j before and after the teacher started
working under a new principal p. For this, we first residualize course grades using all controls
15
This is because OLS estimates of worker and firm effects will be biased unless worker mobility is
uncorrelated with the time-varying residual components of wages, a strong assumption on workers’ mobility
if one considered some specific models of wage determination (e.g., Gibbons et al., 2005).
16in our main specification (including lagged course grades), but excluding teachers’ and
principals’ fixed effects. Figure 2 presents these profiles. We see that teachers who moved
from working under a principal with students in the lowest (1st) quartile of course grades
to working under a principal with students in the highest (4th) quartile experienced a large
average gain in their students’ course grade, while those who moved in the opposite direction
experienced large loses. Moving within a quartile group, by comparison, is associated
with relatively small changes in residualized course grades. Moreover, although we do not
condition on holding teacher-principal relationships for at least 2 years, the trends prior
and after moving are very similar across groups, and the mean change in course grades for
teachers who move in opposite directions between quartile groups (e.g, from quartile 1 to
quartile 2, versus from quartile 2 to quartile 1) are of similar magnitude and uniformly of
opposite sign. While not perfect, this figure is consistent with the symmetry implications
of the additive two-way fixed effects model with exogenous mobility.
Finally, to address concerns related to politically motivated appointment of school princi-
pals (Colonnelli et al., 2020; Akhtari et al., 2020), we estimate our model again but now
including party turnover, vote margin, and a measure of the concentration of vote shares
(Herfindhal-Hirschman Index) as municipal level controls. Reassuringly, the correlation be-
tween our main measure of principal effectiveness and the one obtained from this alternative
model is 0.997.
Teachers’ perceptions: To assess how sensible is our measure of principal effectiveness,
we contrast it against the perceptions of teachers. We examine a set of surveys that ask
teachers about their level of agreement with different statements, such as the principal does
a good job and the principal promotes a good work climate. Every teacher must provide an
answer within a range from 1 to 4 (or from 1 to 5 in some years), where 1 represents high
disagreement with the statement and 4 (or 5) represents a high level of agreement. We use
their responses—which are publicly available for the years 2010, 2011, 2014, and 2015—
to create a dummy variable at the survey-respondent level that equals one if the teacher
“highly agrees” with a given statement about the school principal, i.e., her response is at
the top of the specific scale for that question. Then, we take the average across respondents
at the school-year level and assign this to the corresponding school principal. Using this
principal-level data set, we estimate a simple regression of the fraction of teachers highly
agreeing with a given statement about the school principal on our estimated measure of
principal effectiveness. Figure 3 presents the effect size and confidence intervals based on
bootstrapped standard errors.
17We find that effective principals are associated with a larger fraction of their teachers highly
agreeing with positive statements about their management. Ordered by effect size, we find
that one standard deviation increase in principal effectiveness increases agreement with
the statements principal engages teachers, principal knows teacher needs, principal engages
parents, and principal knows students needs by around 6%; principal makes good decisions,
principal includes teachers, principal is effective, and principal does a good job by around
5%; and principal promotes a good work climate, principal is good at communicating, and
principal can be trusted by around 3 to 4%. Table 2 in the Appendix presents our point
estimates and shows the robustness of these results to accounting for multiple hypothesis
testing using the step-down procedure proposed in Romano and Wolf (2005), and also to a
permutation exercise where we randomly reshuffle the principal fixed effects 1,000 times and
then calculate the proportion of sampled permutations where the value of the coefficients
obtained using the reshuffled fixed effect was greater than or equal to our β̂ estimate (to
gauge how likely would it be to obtain our results just by chance). We consider this result
as prima facie evidence that our estimates of principal effectiveness are sensible.
3.2 What do school principals do?
Before concluding this section, we study the relationship between our measure of principals’
effectiveness and different outcomes related to management practices (Bloom et al., 2015;
Di Liberto et al., 2015; Lemos et al., 2021). We leverage data from different sources to
evaluate whether more effective principals: i) rely more on the sorting of students across
classrooms, ii) receive fewer complaints from parents, and iii) are associated with lower
levels of teachers’ turnover.
Students’ Tracking: School principals can impact schools’ outcomes through different
margins, one of them is the sorting of students with different achievement levels to different
classroom (Duflo et al., 2011; Card and Giuliano, 2016). To assess the extent of tracking
in Chile, and to explore how principal’s effectiveness is related to it, we construct a sorting
index at the school-year level à la Kremer and Maskin (1996).16 Intuitively, perfect sorting
is a case in which all variation in classrooms’ average course grades comes from variation
between instead of within classrooms.
16
We measure how students sort across classrooms by estimating: ȳcg = αg + τst yi(c,g) + εcg , where ȳcg
stands for the average course grade of classroom c of grade g, and yi(c,g) represents the course grade of
student i. We estimate this specification by school and year, including grade fixed effects. The school-year
sorting index is thus given by: τst .
18Figure 4, Panel A, plots a bin scatter with the relationship between the average sorting
index (aggregated at the principal level) and principal effectiveness. We cannot reject the
null of no association between principal effectiveness and tracking at conventional levels.
This may not be surprising in light of the low prevalence of sorting in Chilean schools.
According to our index, sorting is 0.05 on average. To benchmark this number, we rank
students within a school-grade and sort them across all classrooms (in a given grade) to
obtain an average upper bound of 0.7. Thus, sorting based on course grades represents
only a 7% of our empirical upper bound (0.05/0.7).
Parents’ Complaints: We explore how principal effectiveness relates to the number of
parents’ complaints. To do so, we leverage administrative data used to monitor that schools
comply with the laws, regulations, and instructions issued by the Superintendency of Ed-
ucation. Using these data, we calculate the number of complaints (per 100 students) filed
against the schools in which each principal works. Our data includes complaints related
to: bullying/discrimination, denial of enrollment, poor infrastructure, teacher absenteeism,
and school accidents.
Figure 4, Panel B, plots a bin scatter with the relationship between a Z-score of the num-
ber of different complaints (per 100 students) and principal effectiveness. As shown by
Appendix Table A.4, we find that—including year and municipality fixed effects—a one
standard deviation increase in principal effectiveness is associated with a 0.024 decrease
in the Z-score. Principal effectiveness has a more salient impact on complaints related to
“Denied Enrollment” and “Bullying or Discrimination”. A one standard deviation increase
in principal effectiveness is associated with a 6.1% decrease relative to the sample mean in
complaints related to the former cause and a 5.6% decrease in complaints related to the
latter.
Teachers’ Turnover: We now study the relationship between principal effectiveness and
the turnover rate of teachers working for them.17 More specifically, we define our outcome
variable as the share of teachers that leave the school run by principal p, either because of
a job-to-job or a job-to-unemployment transition.
Figure 4, Panel C, plots a bin scatter with the relationship between teachers’ turnover
and principal effectiveness. To further explore this dimension, in Panel D, we plot the
17
Teacher shortages and high turnover rates have recently received considerable attention from policy-
makers, as they impose financial costs on schools and may affect students outcomes (Ronfeldt et al., 2013;
Hanushek et al., 2016).
19You can also read