Mental State of the World 2020 - A publication of the Mental Health Million Project - Sapien Labs
←
→
Page content transcription
If your browser does not render page correctly, please read the page content below
Mental
State of
the World
2020

A publication of
the Mental Health
Million Project
Dear Reader,
Mental wellbeing extends beyond our feelings of happiness or life satisfaction to encompass the
breadth of our emotional, cognitive and social function and capabilities. Understanding where we
stand collectively on the spectrum of mental wellbeing serves as an important barometer of the health
of our society.
The Mental Health Million project was conceived and developed at Sapien Labs as a public interest
project to enable a comprehensive view of the evolving mental wellbeing of our world so that we can
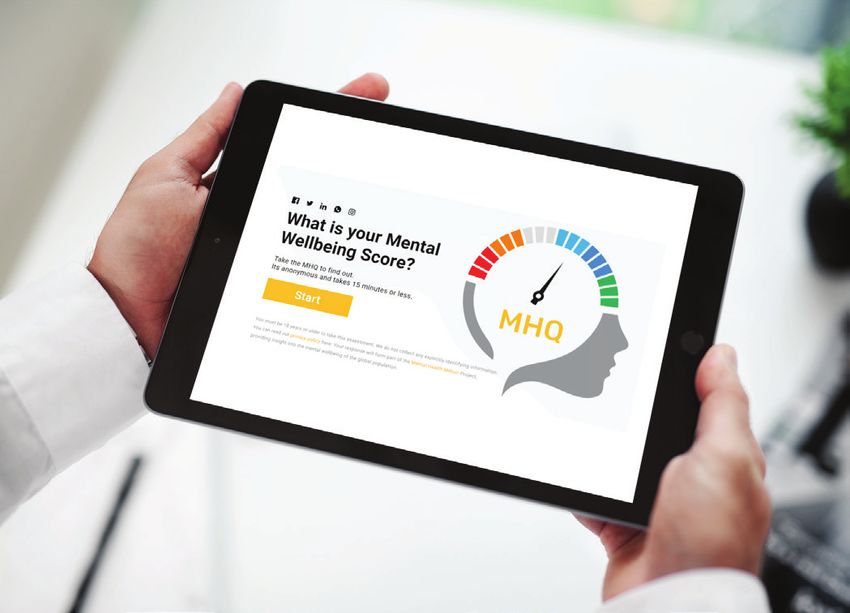
better manage it both individually and collectively. The project utilizes a uniquely designed online
assessment called the Mental Health Quotient, or MHQ. The MHQ scores mental wellbeing based on
a comprehensive list of capabilities or assets as well as challenges that encompass symptoms across
ten major mental health disorders, to reflect the spectrum of mental wellbeing across the general
population. Furthermore, by incorporating demographic and life experience elements it can be used to
gain deep insights into what drives our mental wellbeing status.
In this first year since launch of the project in English we have captured ~49,000 responses, primarily
across 8 English speaking countries enabling a profile of these countries. Over the next few years
its reach will expand to many more languages and countries. This report provides comparisons
of aggregate mental wellbeing and its six functional dimensions by countries, age groups and
gender, with a particular focus this year on the impact of major lifestyle factors and Covid-19 related
adversities and traumas. While the data represented in this report was collected beginning in April
2020 following the start of the Covid-19 lockdowns, a few thousand people were surveyed in 2019
offering an approximate point of comparison. While it is clear that Covid-19 has had, and continues
to have, a significant impact on our mental wellbeing, the data tells a story of more long-term global
challenges, only exacerbated by the ongoing pandemic.
Achieving our objective of generating a truly global representation of our collective mental wellbeing
depends on public support including partnerships to spread the word as well as financial contributions.
As an individual you can contribute your own state of mind to our collective understanding of mental
wellbeing across the globe by taking the MHQ at sapienlabs.org/mhq.
Success of the Mental Health Million project ultimately lies in the utilization of insights arising from
this project at various levels from governments, institutions and companies through to families and
individuals to better manage our collective mental wellbeing across all sectors of our society. We look
forward to engaging in these conversations.
Tara Thiagarajan, Ph.D. Jennifer Newson, Ph.D.
Founder and Chief Scientist Lead Scientist, Cognitive and Mental Health
2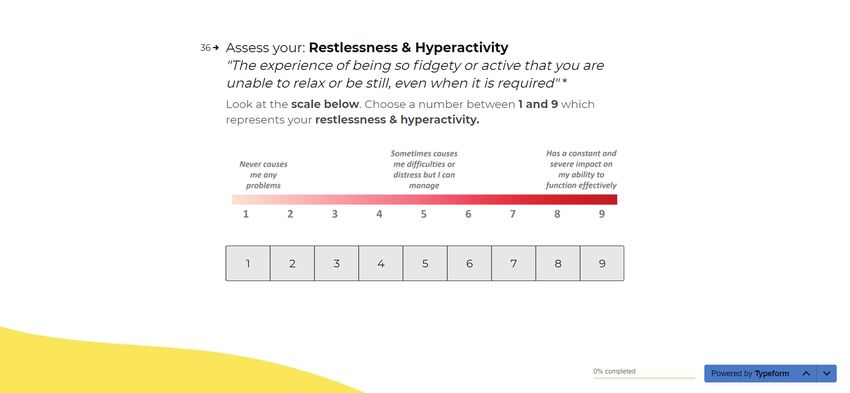
A report of the Mental Health Million project
    sapienlabs.org/mental-health-million-project

    Advisory Committee
    Dr. Jennifer Newson, Lead Scientist, Cognitive and Mental Health,
    Sapien Labs, USA (Project Lead)
    Dr. Helen Christenson, Director and Chief Scientist, Black Dog Institute, Sydney, Australia
    Dr. Pim Cuijpers, Full Professor, Faculty of Behavioural and Movement Sciences,
    Clinical Psychology, VU University Amsterdam, Netherlands
    Dr. Eiko Fried, Assistant Professor of Clinical Psychology, Leiden University, Netherlands
    Dr. Brandon Kohrt, Associate Professor of Psychiatry and Behavioral Sciences,
    George Washington University, USA
    Dr. Robert Latzman, Associate Professor, Department of Psychology,
    Georgia State University, USA
    Dr. Vikram Patel, Professor, Department of Global Health and Population, Harvard University,
    USA and Adjunct Professor and Joint Director, Centre for Chronic Conditions and Injuries,
    Public Health Foundation of India, India
    Dr. Josh Seidman, Managing Director, Avalere Health, Washington DC, USA

    Take part at sapienlabs.org/mhq

    Cite this report as:
    Newson JJ, Pastukh V, Sukhoi O, Taylor J and Thiagarajan TC, Mental State of the World 2020, Mental
    Health Million Project, Sapien Labs, March 15th, 2021, doi:10.5281/zenodo.4603620

    © Sapien Labs 2021
    sapienlabs.org
3
Executive Summary 6
Introduction 8
Our collective mental wellbeing in 2020 8
Beyond happiness and disorders 8
From silos to holistic understanding 9
The challenge of measurement 9
The Mental Health Million project 10
What’s in this report 11
1. The Mental State of the (English Speaking) World 12
An aggregate view 12
Functional dimensions of mental wellbeing 13
2. The Mental Wellbeing of Countries 15
Aggregate mental wellbeing of countries 15
Country scores along functional dimensions 16
The distinct assets and problems of countries 17
Big cities fare better 18
The clinical burden of countries 18
Psychiatry resources and outcomes 19
3. Age and Mental Wellbeing 20
Mental wellbeing is diminished in younger adults 20
Dimensions of mental wellbeing across age groups 21
Explaining the generational gap in mental wellbeing 23
4. Gender and Mental Wellbeing 24
The male-female gender gap 24
A gender gap that diminishes with age 25
The enormous challenge for nonbinary/third gender 26
5. Lifestyle Factors that Impact Mental Wellbeing 27
The magnitude of influence of lifestyle factors 27
Everything is worse without sleep, socializing and exercise 28
Lifestyle factors by country 29
Lifestyle factors by age and gender demographics 30
Untangling cause and effect 31
46. The Mental Cost of the Covid-19 Pandemic 32
What hit us the hardest in 2020? 32
Covid-19 related impact across countries 33
Differential impact of circumstances on different age groups 34
The long term impact of trauma and adversity 35
7. Conclusions & Recommendations 36
A population-based approach to mental wellbeing 36
Tackling the youth mental wellbeing crisis 37
Tackling the nonbinary/third gender crisis 37
Cracking sleep and self care 38
Looking Ahead 39
Expanding our reach 39
Expanded research and insights 39
Donations and partnership support 39
Appendix 1: Understanding the MHQ 40
About the MHQ 40
Rationale behind the MHQ 40
Development of the MHQ 41
Coded questions 41
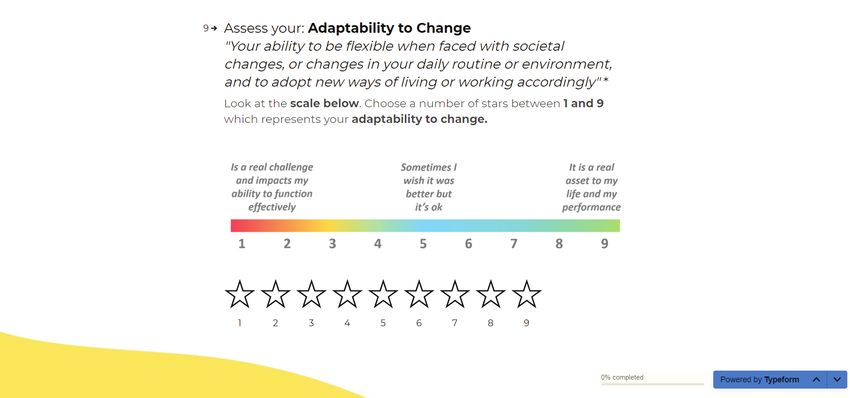
Use of a life impact rating scale 41
Demographic, experiential, and momentary questions 41
The MHQ scale 42
Computation of MHQ Subscores 42
Appendix 2: Data Collection & Analysis Methods 44
Recruitment of respondents 44
Data distribution 45
Exclusion and adjustments 45
Data analysis 46
Computing average MHQ scores 46
Weighting of MHQ data when comparing cities 47
Calculation of sleep, exercise and socializing scores 47
Computing score differences 48
Statistical analysis 48
Challenges of sampling and interpretation 48
References 49
5Executive Summary
This represents the first annual report of the Mental Health Million project, an ongoing effort
to measure and track the mental wellbeing of our global population, with the goal of providing
deep insights into its drivers that can be used to guide the development of effective policy and
intervention. Mental wellbeing, as measured by the Mental Health Quotient or MHQ, a free and
anonymous online assessment tool, encompasses a comprehensive view of our emotional, social
and cognitive function and capability. In its first year, the Mental Health Million project obtained
data from ~49,000 people across 8 English speaking countries: United States, Canada, United
Kingdom, Australia, New Zealand and the substantial English speaking populations of South Africa,
India and Singapore. This report provides a descriptive view of this data with the caveat that the
samples may not be fully representative of a country.
Aggregate mental wellbeing shows a profound drop from 2019. In the aggregate, the overall
mental wellbeing score for 2020 was 66 relative to a score of 90 obtained in 2019 from a different
and relatively smaller sample of 2000 people from the same countries, representing an 8% shift
down the MHQ scale (which ranges from -100 to 200). The percentage of respondents with
clinical level risk increased from 14% in 2019 to 26% in 2020. The drop relative to 2019 was most
pronounced for young adults aged 18-24.
The mental wellbeing of countries: United Kingdom struggling. The average mental wellbeing score
was highest for respondents from Singapore and the United States and lowest for those from the
United Kingdom and South Africa overall, and across multiple dimensions. Respondents from India,
while in the middle overall, varied the most across dimensions of mental wellbeing. Furthermore,
respondents across countries differed in the individual elements of strength and challenge while
those living in big cities fared better than countries overall.
A crisis in young adults. MHQ scores were 86 points lower in young adults aged 18-24 compared
to older adults (65+), representing a shift of 27% along the MHQ scale, with mental wellbeing
decreasing systematically with each younger generation. With 44% of young adult respondents
reporting clinical level risk (compared to 6% of 65+) this adds to the growing alarm of a profound
societal mental health crisis. In particular, young adults had significantly compromised self-worth
and confidence as well as focus and concentration and struggled with feelings of sadness and
distress and unwanted and obsessive thoughts.
A country specific gender gap that diminishes with age. Mental wellbeing was statistically higher
in males than females across all countries combined, though the differences were small. However,
this aggregate number reflected a larger gender gap in young adults that reduced with increasing
age and reversed in favor of females after age 65. Overall, the gender gap was largest in Singapore.
6Male and female groups also differed in their relative strengths and problem areas.
Nonbinary/Third Gender at highest risk for suicide. Nonbinary/third gender adults had significantly
compromised mental wellbeing with over 50% in the category of clinical level risk, and average
MHQ scores ~47 points lower than males and females combined (17% lower along the MHQ scale).
Particularly, they reported substantial suicidal thoughts and intentions relative to other groups.
The importance of sleep, social interaction and exercise: an unexpected magnitude. MHQ scores
were shifted 82 points (27% lower along the MHQ scale) in those who rarely had a good night’s
sleep relative to those who always did; 66 points lower on the MHQ scale in those who (before the
pandemic) rarely or never engaged in face-to-face social interactions with friends and family at least
three times a week compared to those who rarely or never did; and 46 points lower on the MHQ
scale in those who never exercised compared to those who exercised at least 30 minutes a day.
The impacts for all three – sleep, socializing and exercise - were present across all facets of mental
wellbeing although specific elements of mental wellbeing that were most impacted across sleep,
socializing and exercise, differed.
The mental cost of the Covid-19 pandemic on mental wellbeing. 3.9% of respondents reported
having had a Covid-19 infection of which 0.7% reported a severe case, roughly in line with the global
infection rate in 2020. On the other hand, a full 57% of people experienced a range of negative
health, financial or social consequences. Particularly, the 2% of respondents who were unable to
get critical care for other existing health conditions due the pandemic reported the worst mental
wellbeing that was 61 points or 20% lower along the MHQ scale than those who experienced none
of the negative consequences. The 1.4% of people who struggled to make ends meet for basic
necessities had the second worst mental wellbeing at 18% lower along the full extent of the MHQ
scale. Having reduced household income was also associated with a shift of 4% down the MHQ
scale but impacted a full 17% of people. Social isolation shifted MHQ scores ~20 points down the
scale for all age groups. However, this same shift represented a 65% drop relative to the scores of
young adults aged 18-24 with no Covid-19 related adversities on average but only ~17% for those
65+. We also note that greater incidence of lifetime traumas and adversities was systematically
associated with lower mental wellbeing scores, pointing to the potential long-term impact of these
Covid-19 related changes.
Conclusions and recommendations Altogether we advocate for embedding a population-based
approach to mental wellbeing into social and economic policy. We also join a growing call for greater
research investment into understanding the drivers of the mental health crisis of young adults
and nonbinary/third gender adults, and in understanding the factors that impact people’s lifestyle
habits relating to exercising, socializing and sleep. Finally, we encourage a greater role for schools,
universities and companies in actively enabling the mental wellbeing of their students and workforce.
7Introduction
Our collective mental wellbeing in 2020
2020 was a year unlike any other in our life experience. The arrival of the Covid-19 pandemic touched
all corners of the globe, causing illness, distress and uncertainty along with an economic fallout that is
unrivalled in recent history. The tremendous toll it has taken on our collective mental health has been
highlighted repeatedly in the media and scientific literature (Holmes et al., 2020; Pierce et al., 2020;
Serafini et al., 2020) and also reminds us that mental health and wellbeing isn’t just about clinical
diagnoses. Our lives come naturally with adversity, and although not every mental challenge or moment
of sadness warrants labelling as a clinical disorder, our mental wellbeing can still feel compromised at
times.
Beyond happiness and disorders
Although there are different perspectives and definitions of mental wellbeing,
here we use the term to represent the spectrum of our emotional, social and
cognitive function and capability. In this regard, our mental wellbeing score is a “Mental health
reflection of how well-equipped we feel to handle life’s challenges, rebound from is a state of well-
adversities and capitalize on opportunities to contribute productively to society. being in which an
individual realizes
Our mental wellbeing measure therefore spans a spectrum from Clinical to his or her own
Thriving and encompasses a host of emotional, social, cognitive, and physical abilities, can cope
functions that need to operate in line with, or beyond, the demands of any with the normal
situation. These broadly span the dimensions of Mood & Outlook, Drive & stresses of life, can
Motivation, our Social Self, our Core and Complex Cognition and our Mind-body work productively
Connection. Importantly, therefore, mental wellbeing, although related, is not and is able to make
the same as happiness or life satisfaction. a contribution
to his or her
While the extreme impairment of one or more functions are considered community."
mental health disorders, focusing on these clinical disorders alone hinders our - WHO
understanding of the spectrum of mental wellbeing in the general population.
Only by considering this diversity will we be able to make progress that
improves the lives of everyone.
8Mental wellbeing, as measured by the MHQ, represents the spectrum of our
emotional, social and cognitive function and capability, a reflection of how
well-equipped we feel to handle both life’s adversities and opportunities.
From silos to holistic understanding
Understanding the status of mental wellbeing across populations and identifying the factors that impact
mental wellbeing systemically is of paramount importance for effective policy making and appropriate
provision of mental health resources (Patel et al., 2018). As a global population, we exhibit a huge
diversity in our state of mental health and wellbeing. Although there is some data on the prevalence of
individual disorders like depression, anxiety, and addiction (Kessler et al., 2009; Steel et al., 2014; James
et al., 2018; Ritchie and Roser, 2018; World Health Organization, 2018) that provide an indication of how
many people are suffering from serious challenges to their mental health, there is currently no big picture
understanding of our collective mental wellbeing on the spectrum from Clinical to Thriving and along
major functional dimensions.
Although pockets of data exist within current mental health surveillance systems, and information
sources are more readily available in some countries, there are still many gaps that need to be filled.
Special Initiatives on mental health from the World Health Organization (WHO, 2019b) and the inclusion
of Good Health and Wellbeing as one of the United Nations’ Sustainable Development Goals (UN, 2020)
highlights the importance of plugging these gaps to facilitate the allocation of resources and support to
individuals and populations who are most at risk.
The challenge of measurement
One challenge to achieving this goal is of measurement. The assessment of mental health is fraught
with several challenges from a bias towards capturing clinical disorder rather than overall wellbeing, to
poor standardization across assessment tools such that the same disorder
may be diagnosed differently with different tools (Newson et al., 2020). The
Mental Health Million project uses a unique scientifically developed tool called
the Mental Health Quotient, or MHQ, (Newson and Thiagarajan, 2020), designed
We can’t manage
to overcome the various limitations of measurement tools today. Based on a
our collective
systematic coding of 10,000 questions across 126 DSM-based assessment
mental wellbeing
effectively if we
tools and inclusion of additional criteria from the Research Domain Criteria
don’t measure it.
(RDoC) put forth by the National Institute of Mental Health in the United States
(Insel et al., 2010), the MHQ captures the full breadth of symptoms across ten
9different disorders as well as positive mental attributes on a life impact scale to position individuals
on the spectrum from Clinical to Thriving, in the aggregate, and across six functional dimensions (see
Appendix 1 for more details on how the MHQ was developed).
The MHQ and mental wellbeing
The MHQ is a unique tool that measures problems that map to symptom profiles across ten
common mental health disorders as well as positive mental attributes to position people on a
spectrum of mental wellbeing from Clinical to Thriving.
Clinical At Risk Enduring Managing Succeeding Thriving
-100 -50 0 50 100 150 200
The Mental Health Million project
The objective of the Mental Health Million project is to provide an evolving global map of mental
wellbeing and enable deep insights into its drivers that can be used for more effective management
of population mental wellbeing through evidence-based social policy and interventions. This project
utilizes the MHQ delivered as an open online anonymous survey that takes approximately 15 minutes
to complete and returns overall wellbeing scores as
well as a comprehensive report with tailored lifestyle
recommendations via email, encouraging honest responses.
Launched in April of 2020 in English, this first year has
focused on adults 18 and older in eight English speaking
countries that include the United States, Canada, United
Kingdom, Australia, New Zealand, and India’s, South Africa’s
and Singapore’s considerable English-speaking populations.
While the Mental Health Million project will launch in
multiple languages in 2021 and beyond, here we present
insights into the mental wellbeing of the English-speaking
Available for everyone at sapienlabs.org/mhq world in 2020. This includes data obtained from ~49,000
people across these countries, recruited through Internet
search and social media which, while similarly recruited, may not be a fully representative sample of any
10country. While this report provides a top-line description of this data, much more can be mined from it.
The Mental Health Million project is therefore structured as an open data project where researchers can
access the data on request. Information on how this data was obtained can be found in Appendix 2.
What’s in this report.
In this report we show a comparison of mental wellbeing profiles of eight countries, as well as highlight
differences across age and gender groups based on this data. We also report on key lifestyle factors that
are revealing themselves as important drivers of mental wellbeing and discuss the impact of adversities
and traumas associated with the Covid-19 pandemic.
CANADA
UNITED
KINGDOM
UNITED
STATES
SINGAPORE
AUSTRALIA
INDIA
SOUTH AFRICA NEW
ZEALAND
11The Mental State
1. of the (English Speaking) World
An aggregate view
The average mental wellbeing score across 8 English speaking countries in 2020 was 66, a decline of
24 points relative to a smaller sample from 2019 that represents an 8% downward shift on the MHQ
scale. The percentage of people at risk for, or with clinical disorders was 26%, 12% higher compared to
2019. MHQ estimates of clinical burden in 2019 are broadly in line with estimates of annual prevalence
rates of mental health disorders reported from other sources such as the surveys from the World Health
Organization and the Global Burden of Disease Study which have made estimates in the range of 9.8-
19.1% (Kessler et al., 2009; Steel et al., 2014; James et al., 2018) while 2020 estimates are aligned with
the finding of increased prevalence of mental health challenges in 2020 (e.g. Pierce et al., 2020; Serafini et
al., 2020).
Figure 1.1: Distribution of MHQ scores in 2020 across the
English speaking population and changes relative to 2019* Change from 2019*
25% Average MHQ score
20% 2019 2020
15%
90 -24
66
10%
5% Clinical or at Risk
0% 2019 2020
Clinical At Risk Enduring Managing Succeeding Thriving
14% +12%
26%
-100 -50 0 50 100 150 200
* 2019 had a small sample size
of 2000 people across mainly
Average MHQ score 66 Managing US/India/UK. Numbers can be
considered directional
12The Six Dimensions
of Mental Wellbeing
in The MHQ
These overall scores are based on averages for respondents from each country
weighted by their relative adult populations. For each country, average scores were first
obtained for each age and gender group and then weighted by their proportion of the
population (for more details on analysis methods, see Appendix 2). Note that 2019 data
included 2000 people primarily across United States, India and the United Kingdom. Mood & Outlook
The ability to manage and
regulate your emotions
effectively and to have a
Functional dimensions of mental wellbeing constructive or optimistic
outlook for the future.
Within this aggregate view of mental wellbeing, what did distinct functional
dimensions of mental wellbeing look like?
Social Self
Respondents felt most positive about their Complex Cognition overall with less than How you interact with,
relate to and see yourself
15% experiencing serious risks and 50% Succeeding or Thriving on this dimension. with respect to others.
They were similarly confident in their Drive & Motivation and Core Cognition where
about half were Succeeding or Thriving and 20% or less of the population struggled
on each of these dimensions.
Drive & Motivation
The ability to work towards
achieving your desired goals
Respondents felt most positive about their Complex and to initiate, persevere and
complete activities in your
Cognition overall with less than 15% experiencing serious daily life.
risks and 50% Succeeding or Thriving on this dimension.
Core Cognition
On the other hand, people struggled most in their Social Self. Over 30% of The health of your basic
cognitive skills which allow
respondents had significant risks and challenges in their Social Self, the way they you to function effectively
relate to, and see themselves with respect to others in the world, with only 40% and independently on a
moment to moment basis.
Succeeding or Thriving. Similarly, nearly a third of respondents struggled with
serious challenges to their Mood & Outlook, the ability to regulate their emotions
and see the world optimistically. These scores were most different from 2019
decreasing 11 and 12 points for Social Self and Mood & Outlook (a downward shift Complex Cognition
of 7-8% on these dimension subscales) respectively while Drive & Motivation and The ability to synthesize
and make sense of complex
Complex Cognition declined relatively less (both 8 points or 5% on the subscale). sets of events and situations
and display a longer-term
perspective in your thoughts
and behavior.
Over 30% of respondents had significant risks and
challenges in their Social Self; the way they relate to, and
see themselves with respect to others in the world. Mind-Body Connection
The regulation of the
balance between your
mind and body.
13Figure 1.2: MHQ score distributions across the six functional
dimensions of mental wellbeing and changes relative to 2019*
Average Dimension Score
Social
Self
50
Mood &
Outlook
Change from
Drive & 2019*
Motivation
Core Complex Cognition 8
Cognition
Complex Drive & Motivation 8
Cognition Core Cognition 10
40
Mind Body
Connection
0% 20% 40% 60% 80% 100%
Clinical At Risk Enduring Managing Succeeding Thriving Mind Body Connection 9
Mood & Outlook 12
-50 -25 0 25 50 75 100 Social Self 11
Dimension Score Subscale 30
* 2019 had a small sample size of 2000 people across mainly
US/India/UK. Numbers can be considered directional
14The Mental Wellbeing
2. of Countries
In this first year we have focused on English speaking people from 8 countries: United States, Canada,
United Kingdom, Australia, New Zealand, Singapore, India and South Africa. How did mental wellbeing
look across these countries overall and across different dimensions in 2020?
Figure 2.1: Average MHQ Score by Country for 2020 and change from 2019 Aggregate mental
wellbeing of countries
Change from 2019
Altogether respondents from
Singapore 4* Singapore had the highest mental
United States 14 wellbeing score with an average MHQ
Canada 31* of 94 followed by the United States
India 51* with an MHQ of 72. Those from
Australia 34* United Kingdom and South Africa
New Zealand 13* had the poorest mental wellbeing
South Africa 23* with scores of 54 and 56 respectively,
United Kingdom 16 a 13% range on the MHQ scale. We
0 20 40 60 80 100 120 note that our results reflect weighted
* 2019 samples of average responses by age and
Average MHQ Score nCountry scores along functional dimensions
Within this data, Singapore had higher scores on all dimensions, while the United Kingdom had the lowest
for four out of six dimensions, and second lowest on the other two. Singapore, United States, Canada,
Australia and New Zealand maintained their relative positions to one another across all dimensions while
India and South Africa had the greatest variability. India was relatively higher on Drive & Motivation and
Mind-Body Connection and lower on Core Cognition and Complex Cognition respectively. Similarly, South
Africa was relatively higher on Drive & Motivation and Complex Cognition.
Figure 2.3: Countries by functional dimensions of mental wellbeing
60 Social Self 60 Mood & Outlook
Singapore Singapore
United States United States
Average Dimension Score
Average Dimension Score
50 50
Canada Canada
India India
40 40
Australia New Zealand
New Zealand Australia
30 United Kingdom 30 United Kingdom
South Africa South Africa
0 20 40 60 0 20 40 60
20 20
Average Dimension Score Average Dimension Score
60 Drive & Motivation 60 Core Cognition
Singapore Singapore
50 India 50 United States
Average Dimension Score
Average Dimension Score
United States Canada
Canada New Zealand
40 40
South Africa Australia
Australia South Africa
30 New Zealand 30 India
United Kingdom United Kingdom
20 0 20 40 60 20 0 20 40 60
Average Dimension Score Average Dimension Score
60 Complex Cognition 60 Mind Body Connection
Singapore Singapore
50 United States 50 India
Average Dimension Score
Average Dimension Score
South Africa United States
Canada Canada
40 40
New Zealand Australia
India New Zealand
30 Australia 30 South Africa
United Kingdom United Kingdom
0 20 40 60 0 20 40 60
20 20
Average Dimension Score Average Dimension Score
16 Note that the scale for subcategory scores extends from -50 to 100 (see Figure 1.2) Error bars represent 95% CI of the mean.We note that differences in the average score may or may not be statistically significant depending on
relative sample sizes. All statistics are provided in a supplementary download.
The distinct assets and problems of countries
Countries with similar overall MHQ scores still differed in their specific profile of mental wellbeing. Here we
looked at the top three assets that differed for each country relative to the United States, in both negative and
positive directions and the top three problem areas that differed in either the positive or negative direction.
For instance, the biggest differences between respondents from Singapore and the United States
were that those from Singapore had better Appetite regulation, Self-image and Sleep quality but also
experienced less Pain, had less Physical health issues and Feelings of sadness, distress or hopelessness.
Indian respondents similarly had better Sleep quality, Self-image and Energy levels relative to the United
States. On the other hand they had worse problems with Unwanted, strange or obsessive thoughts,
Aggression towards others and a Sense of being detached from reality.
Those from United Kingdom had poorer Ability to Learn, Self image and Self worth and confidence relative to the
United States and also struggled more with Mood swings, Sense of being detached from reality and Feelings of
sadness, distress or hopelessness. All comparisons are in Figures 2.4 (Left: Assets; Right: Problems).
Figure 2.4:
Top three differences in mental assets relative Top three differences in problem areas relative
to the USA, either negative or positive to the USA, either negative or positive
Greater asset in USA Greater asset in Country Greater problem in USA Greater problem in Country
Feelings of Sadness, Distress,
Appetite Regulation or Hopelessness
Self Image SINGAPORE Physical Health Issues SINGAPORE
Sleep Quality Experience of Pain
Self Control & Impulsivity Sense of being detached from reality
Emotional Control SOUTH AFRICA Aggression Towards Others
SOUTH
Stability & Calmness Unwanted, Strange or Obsessive Thoughts AFRICA
Emotional Control Suicidal Thoughts or Intentions
Ability to Learn NEW ZEALAND Addictions NEW
Physical Intimacy Sense of being detached from reality ZEALAND
Sleep Quality Unwanted, Strange or Obsessive Thoughts
Self-Image INDIA Aggression Towards Others INDIA
Energy Level Sense of being detached from reality
Emotional Control Physical Health Issues
Drive & Motivation CANADA Mood Swings CANADA
Ability to Learn Experience of Pain
Ability to Learn Send of being detached from reality
Self Worth & Confidence AUSTRALIA Mood Swings AUSTRALIA
Emotional Control Suicidal Thoughts or Intentions
Ability to Learn Mood Swings
Self Image UNITED KINGDOM Sense of being detached from reality UNITED
Self Worth & Confidence Feelings of Sadness, Distress, or Hopelessness KINGDOM
-1 -0.8 -0.6 -0.4 -0.2 0 0.2 0.4 0.6 0.8 1 -1 -0.8 -0.6 -0.4 -0.2 0 0.2 0.4 0.6 0.8 1
Score difference between USA and other Country Score difference between USA and other Country
17Big cities fare better
Figure 2.5: Cities relative to rest of country Big cities are a distinct ecosystem with
(more positive = city has higher mental wellbeing)
higher density and faster pace. Does this
make mental wellbeing better or worse?
New York vs rest of US
Respondents from five major cities - New
London vs rest of UK
York, Los Angeles, London, Sydney, and
Los Angeles vs rest US
Mumbai had MHQ scores higher relative
Mumbia vs rest of India
to the rest of their respective countries.
Sydney vs rest of Australia
Particularly, these city folks felt greater
0 2 4 6 8 10 12 14 Drive & Motivation and Core and Complex
Difference in average MHQ Score Cognition compared to the rest of their
respective countries. While Singapore,
which is a city-state, still had the highest MHQ, the gap between Singapore and New York City was less
than half the gap with the United States overall.
The clinical burden of countries
Overall, 26% of respondents were at risk for clinical-level challenges (5% Clinical and 21% At Risk)
representing a considerable clinical burden. This burden was highest in South Africa at 8% followed by
United Kingdom, India and New Zealand ranging from 6 to 6.5% and lowest in Singapore at 2%. On the
other hand, when including those at risk of clinical-level challenges the burden was highest in the United
Kingdom at 31.5% followed by New Zealand at 30% and substantially lower in Singapore at 12.4%.
Country groups also differed substantially in the percentage of the adult population with clinical-level
challenges seeking professional help. Respondents from Canada were the highest at 65.2% followed by
Australia at 58.6%. In contrast, a very low 14.5% of those with clinical-level challenges from India sought
professional help followed by Singapore at 27.3%.
Figure 2.6: Clinical burden of countries Figure 2.7: Percentage of people with clinical MHQ
Scores seeking professional or medical help
% with Clinical % with At Risk
MHQ Scores MHQ Scores
United Kingdom Canada
New Zealand Australia
South Africa New Zealand
Australia United Kingdom
India United States
Canada South Africa
United States Singapore
Singapore India
0 5 10 15 20 25 30 35 0 10 20 30 40 50 60 70
18 Percentage of respondents (%) Percentage of respondents (%)Psychiatry resources and outcomes
How does the mental health resource ecosystem correlate with
Figure 2.8: Psychiatrists per 10,000 correlates
the percentage seeking help? Across this group of countries, the with percentage seeking help across countries
number of psychiatrists working in the mental health sector per
100,000 people are lowest for India and South Africa at 0.3 and 80
1.5 respectively where the percentage seeking help is very low 70 Canada
compared to 14.7 in Canada and 13.5 in Australia respectively 60 Australia
% Seeking Help
where it is high (WHO, 2019a). Overall, there was a generally linear 50 New
South United Zealand
relationship between the percentage seeking help and the number Africa United
Kingdom
40 States
of psychiatrists, suggesting that the availability of mental health
30
support is a critical factor in help seeking. However, there are likely Singapore
20
to be other factors which also play a role.
10 India
For example, cultural reasons may create hesitancy in seeking 0
0 5 10 15 20 25 30
help for fear of stigma or discrimination. Financial constraints in
countries without free healthcare systems is also likely to be a Psychiatrists per 10,000
factor.
On the other hand, is it the case that having more
Figure 2.9: Clinical burden of countries was
unrelated to psychiatry resources psychiatrists results in a lower clinical burden? A
comparison of the clinical and total risk burden versus
9 South
Africa the number of psychiatrists per 100,000 suggests
8 that this is not the case. Clinical burden was unrelated
United
Kingdom
7 to the availability of psychiatrists. There are likely
Clinical Burden (%)
India
6 numerous reasons for this. Among them may be the
Australia New
5 Zealand
current lack of effective treatments and tools available
4 United for mental disorders.
States
3
Canada
2
Singapore
1
0
0 5 10 15 20 25 30
Psychiatrists per 10,000
193. Age and Mental Wellbeing
Mental wellbeing is diminished in younger adults
Within this dataset the average MHQ score for adults aged 65 and over was 115 and decreased with each
successive generation. Respondents 18-24 years old had an average score of 29, 29% lower on the MHQ
scale than those 65+. Correspondingly, the proportion of respondents in the Clinical and At risk categories
was only ~6% among the 65+ but 44% in the 18-24 group. Conversely, 70% of those aged 65+ were
in the categories Succeeding or Thriving compared to only 17% of 18-24 year olds. This is a profound
difference. Along with other studies that suggest that mental health challenges are disproportionally
affecting younger people with increasing prevalence (Twenge et al., 2019), the magnitude of difference
along such an aggregate measure must sound a loud alarm.
A full 44% of respondents aged 18-24 years were Clinical or At risk of
a clinical disorder compared to only 6% of those 65 and older. Such a
profound difference in mental wellbeing must sound a loud alarm.
Figure 3.1: Mental wellbeing is progressively worse for each younger
generation. Covid-19 also had a more dramatic impact on younger adults
Distribution of MHQ Scores Average MHQ
Score
18-24
160
25-34
Age Bracket Change
(years)
from 2019*
Succeeding
140
Age Bracket (years)
35-44 85+
45-54 120 75-84 12
65-74
55-64
100
65-74 55-64
Managing
75-84
80
28
45-54
85+ 60 35-44
27
0% 20% 40% 60% 80% 100% 25-34
40
Enduring
Clinical At Risk Enduring Managing Succeeding Thriving
18-24 44
20
* 2019 had a small sample size
20 -100 -50 0 50 100 150 200 0 of 2000 people across mainly
US/India/UK. Numbers can
MHQ Score Range be considered directionalThis generational decline in mental wellbeing is a global phenomenon present in all 8 countries. While
the magnitude of this gap was large everywhere, it was greatest for respondents living in Singapore, and
smallest for those living in Canada (67 and 50 MHQ point difference between adults under age 45 and
over 45 respectively).
Notably this difference between younger and older adults has been substantially exacerbated in 2020
by the Covid-19 pandemic. Mental wellbeing decreased most dramatically in 2020 (relative to 2019) for
those aged 18-24, with a decrease of 44 MHQ points (a 15% shift along the MHQ scale). For those aged
25-64, there were also decreases of smaller magnitude (27 or 28 MHQ score points), while surprisingly,
those 65 and above actually fared better in 2020, possibly reflecting a bias in this sample of older adults
with the health and faculties to complete a mental health assessment online. This finding tracks with
other reports that the consequences of the pandemic are having a disproportionate impact on the young
(Varma et al., 2020), even though this group is at least risk of severe illness or death from Covid-19.
Dimensions of mental wellbeing across age groups
Are these differences between age groups specific to certain dimensions? Remarkably, the same trend
is present across the 6 dimensions of wellbeing although it is particularly amplified in the dimensions of
Social Self and Mood & Outlook.
Figure 3.2: Mental wellbeing was worse in younger adults
across all dimensions of mental wellbeing
Social Mood & Drive & Core Complex Mind
Self Outlook Motivation cognition cognition Body
Thriving 80
Age Bracket
(years)
Succeeding 60
65+
40
Managing 45-64
25-44
18-24
20
Enduring
0
Note subcategory scores range from -50 to +100.
With respect to specific elements of mental wellbeing, positive aspects that increased the most
substantially with age included Self-image, Self-worth and Confidence, Focus and Concentration and
Emotional resilience. Conversely young adults struggled substantially more with Feelings of sadness,
distress or hopelessness, Unwanted, strange or obsessive thoughts, Mood swings and Guilt and blame,
compared to those aged 65+. In contrast, the more prominent challenges for those aged above 24
21and into middle age were Fear and anxiety and Avoidance and withdrawal while those older still (65+)
increasingly struggled with Physical health issues. As in this data, for those over 65, studies have shown
that lower mental wellbeing scores are more likely to be driven by physical health issues (Fiske et al.,
2009; Doherty and Gaughran, 2014).
Figure 3.3:
Key differences between age groups 18-24 and 65+ Top problems for each age group
Key assets in the elderly (65+) relative to 18-24
Self Image
Age 18-24
Self-worth & Confidence Feelings of Sadness, Distress or Hopelessness 41.0%
Focus & Concentration
Unwanted, Strange or Obsessive Thoughts 39.4%
Emotional Resilience Age 25-44
Fear & Anxiety 31.0%
0 0.5 1 1.5 2 2.5 3
Avoidance & Withdrawal 28.6%
Difference in rating from 18-24 to 65+
Age 45-64
Biggest problems in the young (18-24) relative to 65+
Fear & Anxiety 19.2%
Feeling of Sadness,
Distress or Hopelessness Avoidance & Withdrawal 17.9%
Unwanted, Strange
or Obsessive Thoughts
Age 65+
Guilt & Blame
Physical Health Issues 11.1%
Mood Swings Fear & Anxiety 8.8%
0 0.5 1 1.5 2 2.5 3
Difference in rating between age 18-24 and 65+
The major challenges reported by the 18-24 year old group in this 2020 dataset are similar to those
reported in our smaller 2019 sample, although the relative ranking of these challenges has changed
slightly. For 18-24 year olds, poor Self-image, Unwanted, strange or obsessive thoughts and Mood
swings dominated in 2019. While almost all elements of wellbeing deteriorated in 2020 for this younger
age group relative to 2019, the biggest changes (although not the most prevalent challenges) were in
deteriorating Relationships with others, Suicidal thoughts and intentions, Fear and anxiety, Confused and
slow thinking and Repetitive and compulsive actions.
22Explaining the generational gap in mental wellbeing
What accounts for this profound difference across generations among the English speaking Internet
enabled? Is it that we become increasingly better equipped to cope with life as we age? Or is it that the
changing forces of the world have had a disproportionate impact on the younger groups? Learning the
answers to these questions is exceedingly important for us to understand the future of society.
Arguing in favor of the former is that the reductions in mental wellbeing in young adults are across the
board from Social Self to Core Cognition. This suggests that young adults may not be well equipped to
calibrate their expectations or self-perceptions relative to society as a whole. The higher self-confidence
and emotional resilience with age may also suggest a natural maturing and perspective as we age.
Indeed, despite declining abilities, older adults have more favorable perceptions of their mental status
(Reed and Carstensen, 2012). Some aspects of the difference may also relate to a shadow effect, where
major issues such as Feelings of sadness, distress or hopelessness cast a shadow on how the individual
views other aspects of their functioning.
What does the future look like for a society that is profoundly compromised
in its focus and concentration, and consumed with strange and unwanted
thoughts and feelings of distress and hopelessness? The consequences of
these differences across age groups cannot be taken lightly.
On the other hand, the vastly greater presence of strange and unwanted thoughts, substantial challenges
in focus and concentration, and feelings of hopelessness in the 18-24 age group are warning signs
of more worrying forces at play. What if these challenges persist as they transition to middle age
and beyond? What are the consequences of a society that lacks focus and concentration and where
unwanted, strange and obsessive thoughts run amok? Studies suggests that 75% of adults with a mental
health disorder have experienced its onset by the age of 24 (Kessler et al., 2005; Kessler et al., 2007).
Furthermore, recent research shows that mental health struggles in early life can lead to poorer physical
health in middle-age and advanced aging (Richmond-Rakerd et al., 2021; Wertz et al., 2021). With 44%
of young adults having or at risk for clinical-level issues, what does this mean for the future of society?
18-24 year olds are the first generation to grow up immersed fully in an internet-connected world. Are
the major societal shifts brought about by the Internet to blame? It is imperative that we invest fully as
a society to understand the drivers of this considerable generation shift in mental wellbeing and address
them at their root causes.
The Mental Health Million project will be able to look longitudinally to see how this year’s 18-24 year olds
fare in their next decade, providing increasingly deeper insight that can help drive mitigating strategies
and track their success.
23Gender and
4. Mental Wellbeing
The male-female gender gap
The prevalence of disorders such as depression, post-traumatic stress disorder (PTSD) and generalized
anxiety disorder, has typically been found to be higher for women compared to men (Kessler et al., 1993;
Van de Velde et al., 2010; McLean et al., 2011; Ditlevsen and Elklit, 2012; Salk et al., 2017). In contrast,
suicide rates are often higher in men compared to women (Freeman et al., 2017; Naghavi, 2019), and
men are often more reticent to speak out about mental health challenges (Galdas et al., 2005). Here we
provide insight into the difference between genders across the spectrum of mental wellbeing.
Overall, in 2020 our data shows that female respondents had a slightly lower MHQ scores overall relative
to male respondents. However, they also fared better in 2020 relative to a smaller 2019 sample with a
lower drop of 19 MHQ points compared to 28 in men.
Figure 4.1: There was a small difference between males and females overall while
nonbinary/third gender had substantially poorer mental wellbeing
Distribution of MHQ Scores Change
Average MHQ Score from 2019*
Male 80
Male 28
Female
Female
Managing
60
19
Nonbinary/
40
Third Gender
0% 50% 100% Enduring Nonbinary/
20 Third Gender 51
Clinical At Risk Enduring Managing Succeeding Thriving
0
-100 -50 0 50 100 150 200
* 2019 had a small sample size of 2000 people across mainly
US/India/UK. Numbers can be considered directional
MHQ Score Range
24This difference between men and
Figure 4.2: MHQ scores for each gender group
across each functional dimension women predominantly reflected
differences along the dimension of
Social Mood & Drive & Core Complex Mind
Self Outlook Motivation Cognition Cognition Body Mind-Body Connection followed by
60
Mood & Outlook (a 3-5% difference
Managing
40
along these dimension scales).
Relative to men, women had greater
20
Enduring Experience of pain and Fear and anxiety.
0
Conversely men had greater issues with
Male Female Nonbinary/Third Gender Addictions and Empathy than women.
Note that dimension scales range from -50 to +100.
A gender gap that diminishes with age
Interestingly, this gender gap between men and Figure 4.3: Male-female gender gap by age
women diminished with age. For young adults, there (more positive = males have higher mental wellbeing)
was a sizable gender gap of 17 MHQ score points
65+
Age Bracket (years)
(6% of the MHQ scale) with men reporting higher
45-64
mental wellbeing compared to women. The gap was
progressively lower for older generations, reversing in 25-44
direction for those aged 65+. Notably, at all ages, the 18-24
difference between males and females were many fold -5 0 5 10 15 20
smaller than the generational gaps reported above. Difference in Average MHQ Score
Figure 4.4: Male-female gender gap across
The gender gap also varied across respondents
respondents living in different countries living in different countries with most
(more positive = males have higher mental wellbeing) populations reporting slightly higher mental
wellbeing for men compared to women. It is
Singapore
considerably larger for respondents living in
India
Singapore (+16 MHQ points or 5% of the MHQ
South Africa scale) compared to other countries. On the
Australia other hand, respondents living in the United
Canada Kingdom had gender parity overall, and the gap
United States was reversed for respondents living in New
United Kingdom Zealand where women were higher overall.
New Zealand
In these countries, higher MHQ scores for
men persisted in the 18-24 range but quickly
-5 0 5 10 15 20
reached parity thereafter and reversed in favor
Difference in Average MHQ Score
of women after age 55.
25The enormous challenge for nonbinary/third gender
While the differences between males and females were hardly a few MHQ points overall, those
respondents who were nonbinary/third gender had strikingly lower mental wellbeing compared to either
males or females. On average, MHQ scores were 50 MHQ points lower for nonbinary/third gender
respondents (average MHQ of 22) compared to male respondents (average MHQ of 71). This is in line
with other studies that have highlighted the specific challenges faced by this population (Cochran et al.,
2003; Meyer, 2003; Russell and Fish, 2016). Sadly, those who responded as nonbinary/third gender had
consistently poorer mental wellbeing across all 6 dimensions, but in particular for the dimensions of
Social Self and Drive & Motivation. Particularly, relative to males or females, this group had substantially
greater troubles with Suicidal thoughts or intentions and a Sense of being detached from reality.
26Lifestyle Factors That
5. Impact Mental Wellbeing
We know that sleep, exercise and social contact are key influencers of our mental wellbeing. For
example, research has shown that poor sleep quality leads to impaired cognitive performance (McCoy
and Strecker, 2011; Lowe et al., 2017; Dzierzewski et al., 2018), increases stress reactivity (Meerlo et al.,
2008) and is both a trigger and a consequence of poor mental and cognitive health (Krystal, 2012; Hvolby,
2015; Meerlo et al., 2015). Similarly, research is finding that exercise is essential for our mental wellbeing
(Di Lorito et al., 2020; Hu et al., 2020) and that without regular contact with friends and family, people
experience social isolation and loneliness (Hawkley and Cacioppo, 2010; Lim et al., 2018; Wang et al.,
2018), leading to increased stress levels (Brown et al., 2018) and poorer mental and physical health.
Here we show how lifestyle behaviors vary across different groups and highlight the surprisingly large
magnitude of their impact on mental wellbeing overall, as well as on its individual elements. We note that
data on social interaction shown here was captured to reflect people’s typical behavior when not in lockdown,
while social isolation due to Covid-19 was separately assessed and highlighted in the section on Covid.
The magnitude of influence of lifestyle factors
The biggest surprise was the magnitude of difference in MHQ points along the scales of sleep, socializing
and exercise. Those respondents who always got a good night’s sleep had overall mental wellbeing
scores that were 82 points higher than those who hardly ever did (a shift of 27% along the MHQ scale).
Similarly, those who typically socialized with friends and family several days a week had mental wellbeing
scores 66 points higher than those who rarely or never did, and those who exercised at least 30 minutes
everyday had mental wellbeing scores 46 points higher than those who rarely or never exercised. Clinical
risk too had proportionate disparities.
Over 50% of those who rarely or never got a good night’s sleep had clinical level challenges or risks; 44%
of those who rarely or never socialized had clinical level challenges or risks; and 39% of those who rarely
or never exercised had clinical level challenges or risks. These are not small numbers and are a profound
testament to the foundational importance of these elements to human mental function. Yet, almost half
of respondents struggled on each of these factors.
27Figure 5.1: MHQ scores and prevalence in the population for different categories of sleep, socializing and exercise
Good Night's Sleep Frequency of Socializing Frequency of Physical Exercise
120 Prevalence 120 Prevalence 120 Prevalence
100 All of the time 11% 100
Several days a week 29%
100
Most of the time
43% 23%
Every day
50%
16% of MHQ Scale
23% of MHQ scale
Few days a week
27% of MHQ scale
80 80 Once a week 80
60 60
1-3 times a month 25% 60
Once a week
Less than once a week 24%
Some of the time 31%
40 40 40 Rarely/Never 26%
20 20
Rarely/Never 23% 20
Hardly Ever 15%
0 0 0
Note that dimension scales range from -50 to +100.
Everything is worse without sleep, socializing and exercise
Studies on sleep, exercise and social interaction have typically focused on their impact on a single
disorder or mental function. When we look across the full spectrum of mental function, however, which
dimensions are most likely to be impacted by each of these factors? Surprisingly, each factor appears to
impact not just every functional domain but virtually every element within them. In all three cases, every
asset of mental function was diminished between the lowest and highest groups on each dimension,
and every problem area was magnified. Most prominently affected by inadequate sleep, were Self-image,
Appetite regulation and Outlook and optimism as well a greater Experience of pain, Guilt and blame;
and Feelings of sadness, distress or hopelessness. Those with a lack of social interaction were most
prominently compromised in their Relationships with others, Outlook and optimism and Self-image as well
as reporting challenges with Avoidance and withdrawal, Guilt and blame; and Feelings of sadness, distress
or hopelessness, while those who rarely exercised were most prominently compromised in their Appetite
regulation, Energy levels and Drive and motivation, in addition to reporting more Physical health issues,
Feelings of sadness, distress or hopelessness and Avoidance and withdrawal. Only a few aspects such as
Sensory acuity or problems with Hallucinations were unchanged.
Sleep, social interaction and exercise substantially impact all facets of
mental function. Those who regularly got adequate sleep, social interaction
and physical exercise had MHQ scores 27% , 23% and 16% higher along the
MHQ scale respectively than those who rarely or never did.
28Figure 5.2: MHQ dimension scores by frequency of sleep, socializing and exercise
Good Night's Sleep Frequency of Socializing Frequency of Physical Exercise
60
55
50
MHQ Dimension Scores
40
30
Complex Cognition
22
20 Drive & Motivation
Core Cognition
Mind Body
10
Mood & Outlook
Social Self
Hardly Some of Most of All of Rarely/ 1-3 Times Once a Several Days Rarely/ Less Than Once a Few Days Every
Ever the Time the Time the Time Never a Month Week a Week Never Once a Week Week a Week Day
Lifestyle factors by country
The differences across respondents from each country along these lifestyle dimensions were not
dramatic. However, what does stand out is that those living in India and Singapore had the best Sleep
and Socializing scores while those living in Australia and New Zealand were highest on Exercise.
Notably respondents living in South Africa were significantly lower than all other countries with respect
to Socializing and Exercise scores while those in the United Kingdom had the poorest sleep. Scores
represent an estimate of days per week (see Appendix 2).
Figure 5.3: Average frequency of sleep, socializing and exercise by country
Good Night's Sleep Frequency of Socializing Frequency of Physical Exercise
India Singapore Australia
Singapore India New Zealand
Canada United States United Kingdom
United States Canada India
Australia Australia Singapore
South Africa United Kingdom Canada
New Zealand New Zealand United States
United Kingdom South Africa South Africa
0 1 2 3 4 0 1 2 0 1 2 3 4
Average Sleep score* Average Socializing score* Average Exercise score*
* Scores calculated by transforming answer labels to numerical values Error bars represent 95% CI of the mean
29We note that other surveys of sleep (e.g. Tozer, 2018) focusing on different aspects such as time in bed
showed different rankings between countries with Singapore having fewer hours in bed relative to most
other countries on this list. However, both hours in bed and sleep quality may vary based on numerous
factors from diet to stress levels such that hours in bed is not directly comparable to one’s sense of
having had a good night’s sleep.
Lifestyle factors by age and gender demographics
Can differences in these factors explain the differences between genders and age groups? There were no
dramatic or statistically significant differences between any of the gender groups in sleep, socializing and
exercise, although the nonbinary/third gender group had slightly poorer sleep scores and lower exercise
scores than either males or females.
Figure 5.4: Average frequency of good sleep, socializing and exercise by gender groups
Good Night's Sleep Frequency of Socializing Frequency of Physical Exercise
Nonbinary/Third Gender
Female
Male
0 1 2 3 4 5 0 1 2 0 1 2 3 4
Average Sleep score* Average Socializing score* Average Exercise score*
* Scores calculated by transforming answer labels to numerical values Error bars represent 95% CI of the mean
On the other hand, age differences were more apparent. Those 65 and above slept well, exercised and
socialized most regularly. Both sleep and exercise frequency were progressively worse for each younger
age group, although not significantly so. On the other hand, respondents aged 18-24 had as much social
interaction as those aged 65 and older while those aged 25-64 socialized substantially less.
Figure 5.5: Average frequency of good sleep, socializing and exercise by age groups
Good Night's Sleep Frequency of Socializing Frequency of Physical Exercise
65+
45-64
25-44
18-24
0 2 4 0 1 2 0 1 2 3 4
Average Sleep score* Average Socializing score* Average Exercise score*
* Scores calculated by transforming answer labels to numerical values Error bars represent 95% CI of the mean
30You can also read