Mining and Validating Social Media Data for COVID-19-Related Human Behaviors Between January and July 2020: Infodemiology Study
←
→
Page content transcription
If your browser does not render page correctly, please read the page content below
JOURNAL OF MEDICAL INTERNET RESEARCH                                                                                                  Daughton et al

     Original Paper

     Mining and Validating Social Media Data for COVID-19–Related
     Human Behaviors Between January and July 2020: Infodemiology
     Study

     Ashlynn R Daughton1, MPH, PhD; Courtney D Shelley1, PhD; Martha Barnard1, BA; Dax Gerts1, MS; Chrysm Watson
     Ross1,2, MA, MS; Isabel Crooker1; Gopal Nadiga1; Nilesh Mukundan1; Nidia Yadira Vaquera Chavez1,2, MS; Nidhi
     Parikh1, PhD; Travis Pitts1, MA; Geoffrey Fairchild1, PhD
     1
      Analytics, Intelligence, and Technology, Los Alamos National Laboratory, Los Alamos, NM, United States
     2
      Computer Science, University of New Mexico, Albuquerque, NM, United States

     Corresponding Author:
     Ashlynn R Daughton, MPH, PhD
     Analytics, Intelligence, and Technology
     Los Alamos National Laboratory
     P.O. Box 1663
     Los Alamos, NM, 87545
     United States
     Phone: 1 505 664 0062
     Email: adaughton@lanl.gov

     Abstract
     Background: Health authorities can minimize the impact of an emergent infectious disease outbreak through effective and
     timely risk communication, which can build trust and adherence to subsequent behavioral messaging. Monitoring the psychological
     impacts of an outbreak, as well as public adherence to such messaging, is also important for minimizing long-term effects of an
     outbreak.
     Objective: We used social media data from Twitter to identify human behaviors relevant to COVID-19 transmission, as well
     as the perceived impacts of COVID-19 on individuals, as a first step toward real-time monitoring of public perceptions to inform
     public health communications.
     Methods: We developed a coding schema for 6 categories and 11 subcategories, which included both a wide number of behaviors
     as well codes focused on the impacts of the pandemic (eg, economic and mental health impacts). We used this to develop training
     data and develop supervised learning classifiers for classes with sufficient labels. Classifiers that performed adequately were
     applied to our remaining corpus, and temporal and geospatial trends were assessed. We compared the classified patterns to ground
     truth mobility data and actual COVID-19 confirmed cases to assess the signal achieved here.
     Results: We applied our labeling schema to approximately 7200 tweets. The worst-performing classifiers had F1 scores of only
     0.18 to 0.28 when trying to identify tweets about monitoring symptoms and testing. Classifiers about social distancing, however,
     were much stronger, with F1 scores of 0.64 to 0.66. We applied the social distancing classifiers to over 228 million tweets. We
     showed temporal patterns consistent with real-world events, and we showed correlations of up to –0.5 between social distancing
     signals on Twitter and ground truth mobility throughout the United States.
     Conclusions: Behaviors discussed on Twitter are exceptionally varied. Twitter can provide useful information for parameterizing
     models that incorporate human behavior, as well as for informing public health communication strategies by describing awareness
     of and compliance with suggested behaviors.

     (J Med Internet Res 2021;23(5):e27059) doi: 10.2196/27059

     KEYWORDS
     Twitter; social media; human behavior; infectious disease; COVID-19; coronavirus; infodemiology; infoveillance; social distancing;
     shelter-in-place; mobility; COVID-19 intervention

     https://www.jmir.org/2021/5/e27059                                                                 J Med Internet Res 2021 | vol. 23 | iss. 5 | e27059 | p. 1
                                                                                                                      (page number not for citation purposes)
XSL• FO
RenderX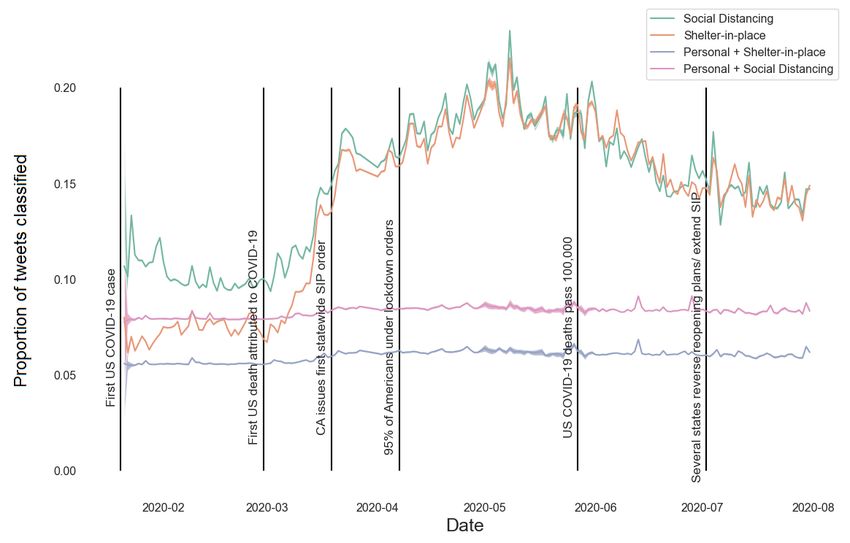
JOURNAL OF MEDICAL INTERNET RESEARCH                                                                                             Daughton et al

                                                                          1.   Research Question 1: What behaviors related to COVID-19
     Introduction                                                              are discussed on social media websites, specifically Twitter?
     Health authorities can minimize the impact of an emergent                 Using content analysis techniques similar to other social
     infectious disease through effective and timely risk                      media studies (eg, Ramanadhan et al [16] and Carrotte et
     communication, vaccines and antiviral therapies, and the                  al [17]), we identified behaviors discussed on Twitter that
     promotion of health behaviors, such as social distancing and              could be relevant to disease transmission or the downstream
     personal hygiene practices [1-4]. Of these, official                      impacts of COVID-19. At the outset, we were particularly
     communication is the earliest available strategy, and its                 interested in social distancing, hygiene, and personal
     effectiveness will build trust and adherence to the remaining             protective equipment practices, but we were also interested
     measures [1]. During the H1N1 influenza pandemic in 2009,                 in identifying the breadth of behaviors that might be
     most countries focused on the promotion of health behaviors               discussed.
                                                                          2.   Research Question 2: How do patterns in behaviors change
     [2] such as mask-wearing, avoidance of crowds, and increased
     disinfection after observing that such protocols contributed              geospatially and temporally in the United States? Using
     substantially to reduced transmission and ultimate control of             labeled data from Research Question 1, we built
     disease during the SARS outbreak in 2003 [5]. Health authorities          classification models to identify behaviors in the larger
     have paid less attention to the psychological factors associated          Twitter corpus. We were interested in temporal and
     with a pandemic [3,4], though such factors play a vital role in           geospatial trends in these classified data with the goal of
     subsequent adherence to health behaviors and vaccine uptake               observing regional patterns and temporal changes that
     [1]. During the emergence of the Zika virus in 2016, public               occurred in conjunction with real-world events. Prior work
     health guidelines focused on preventing sexual transmission by            has used similar methods to observe patterns during Zika
     using condoms, avoiding travel to locations with active Zika              emergence in 2016 [15].
                                                                          3.   Research Question 3: How do these trends compare to other
     transmission, and mosquito control [6], with varying levels of
     compliance [7,8].                                                         data streams, like mobility data sets? Prior work has shown
                                                                               that social media data are biased in multiple ways [18,19].
     Research into the use of social media and internet data for health        One way to validate our findings is to compare results using
     surveillance is a growing field. Individuals discuss a wide               social media data to other data sources that have been useful
     variety of health concerns and health behaviors online, from              to measure human behavior during the COVID-19
     symptom searching [9] and personal experiences with infectious            pandemic. In particular, several studies have shown that
     diseases [2] to dieting [10] and electronic cigarette use [11].           mobility data sets that rely on mobile devices (eg,
     These data have been used to identify prominent points of                 smartphones) have been useful at accurately gauging
     discussion in relation to health topics [12-14], which can point          reduced mobility [20,21].
     toward more effective health policies and interventions. In
     addition, social media and internet data reflect temporal and        Methods
     spatial patterns in health behavior [9-12,15]. The association
     between internet data and health behavior, topics, and attitudes     Data
     relevant to the public provides insight into the manner in which     For this work, we used a data set of tweets provided by Chen
     individuals receive health information and how that information      et al [22]. Data collection started on January 28, 2020, and used
     may translate into behavioral change. Specifically for disease       Twitter’s search application programming interface (API) to
     outbreaks, internet and social media data provide opportunities      get historical tweets as early as January 21, 2020. They started
     for public health officials to monitor prevalent attitudes and       with 14 keywords related to the novel coronavirus, and later
     behaviors at a given time to target further interventions and        expanded both keywords and individual accounts tracked over
     policies.                                                            time. The data relied on Twitter’s streaming API, and are thus
     In this work, we used social media data to better understand         a 1% sample of tweets that include the keywords. The original
     human behaviors relevant to COVID-19 transmission and the            repository contained about 270 million tweets as of mid-July
     perceived impacts of COVID-19 on individuals. We developed           2020 [22]. Of these, we were able to collect 84%
     a coding schema for 6 categories and 11 subcategories, which         (N=228,030,309).
     included both a wide number of behaviors as well as codes
                                                                          Schema Development
     focused on the impacts of the pandemic (eg, economic and
     mental health impacts). We applied this schema to                    The coding schema was developed by three of the authors (AD,
     approximately 7200 tweets and developed supervised learning          DG, and CS) through iterative analysis of random samples of
     classifiers for classes with sufficient labels. We then applied      tweets from our corpus. We started initially with categories of
     these classifiers to an extensive Twitter data set and showed        interest (eg, social distancing and personal protective equipment)
     patterns in human behaviors temporally and spatially across the      and added both categories and subcategories as they were
     United States.                                                       identified in tweets, similar to prior work [16,17]. The final
                                                                          schema is hierarchical, where annotators can label categories
     We specifically focused on the following research questions:         and, if applicable, subcategories within the category of interest
                                                                          (Figure 1).

     https://www.jmir.org/2021/5/e27059                                                            J Med Internet Res 2021 | vol. 23 | iss. 5 | e27059 | p. 2
                                                                                                                 (page number not for citation purposes)
XSL• FO
RenderX
JOURNAL OF MEDICAL INTERNET RESEARCH Daughton et al
Figure 1. Decision tree for labeling.
Personal and impersonal viewpoints were labeled separately Annotator Agreement
from the tweet category. Here, a personal viewpoint is a tweet Annotator agreement varied. Personal and impersonal labels
that describes a direct observation of the behavior, meaning the had agreements of 0.41, 0.44, and 0.41 between the three pairs
individual tweeting talks about their own behavior, or a person of annotators. Category-level labels had agreements of 0.77,
or event that the user can directly observe. For example, the 0.82, and 0.82, and subcategory-level labels had agreements of
tweet “I am wearing a mask when I go out” is a personal 0.61, 0.65, and 0.66. Distinguishing between personal and
mention of personal protective equipment, specifically impersonal tweets was the hardest classification task because
mask-wearing. An impersonal viewpoint, in contrast, includes it is inherently difficult to correctly identify voice in the span
actions like sharing articles, retweeting, or expressing an opinion of 280 characters, especially without additional context. Prior
without providing evidence that the user themself engages in work has relied on the use of personal pronouns (eg, “I,” “we,”
the behavior (eg, “Ugh, I wish more people wore masks”). This and “our”) to identify personal tweets [15], but it is clear that
definition is the same as prior work [15]. Of note, tweets were this method has a high false negative rate because of linguistic
only labeled as personal or impersonal if they were already patterns like pronoun-drop (eg, the tweet “Went to the store
labeled with a category. Tweets that were outside the labels of today and nobody was wearing masks” drops the pronoun “I”
interest were not labeled for viewpoint. and leaves it implied) [23]. Thus, despite the difficulty in
Training Data labeling these tweets, we believe it is preferable to automated
methods.
Training Annotators and Annotation
Classification Algorithms
To create our training data set, 7278 tweets were selected at
random from the English tweets we collected between January Tweet Preprocessing
and May 2020, as labeling commenced in May. Using the above Tweet URLs and usernames (@-mentions) were replaced with
schema, we then trained three additional annotators. Annotators the tokens “URL” and “USERNAME,” respectively.
were trained using the following steps. First, a member of the Consecutive characters were truncated (eg, “greaaaaaat” was
team (AD) met with each individual prospective annotator and truncated to “great”) and punctuation was removed. Of the
thoroughly described the schema. The prospective annotator training data, 15% were reserved as the test set. Tweets were
and AD first labeled 16 example tweets together using tweets split using stratified sampling based on the category labels to
already labeled during schema development. The annotator then preserve label proportions. Because of the small number of
individually coded 160 additional tweets previously labeled by labels in several categories (Table 1), we only attempted to
the authors. If agreement was sufficiently high (>0.6), the make classifiers for the following: personal or impersonal, social
annotator was then given their own section of training data to distancing (category), shelter-in-place (subcategory), monitoring
code. Each tweet in our training data set was coded by two such (category), hygiene (category), and personal protective
annotators. All annotators met weekly to discuss questions about equipment (category).
labels. All tweets with disagreements were resolved by a third
annotator or via group discussion. The workflow to label tweets Because personal and impersonal labels were only assigned to
is given in Figure 1. Tweets can be labeled with more than one tweets if they fell into a category, the training data for this
label, as applicable. classifier were only those tweets with an initial label. In contrast,
all other classifiers used binary classification and included all
tweets that did not include the label of interest, including tweets
https://www.jmir.org/2021/5/e27059 J Med Internet Res 2021 | vol. 23 | iss. 5 | e27059 | p. 3
(page number not for citation purposes)
XSL• FO
RenderXJOURNAL OF MEDICAL INTERNET RESEARCH Daughton et al
with no labels. As such, all classification models were built Geospatial Analysis and Comparison to Mobility and
using extremely disproportionate label distributions. COVID-19 Data
Logistic Regression We compared the results of our classifiers to mobility data from
Logistic regression models were implemented in Python, version Descartes Labs—available at Descartes Labs [26] and described
3.7.7 (Python Software Foundation), using scikit-learn [24] and in Warren and Skillman [27]—to provide a ground truth
the elastic net penalty. Features included all unigrams, bigrams, measurement of social distancing, and to the number of
and trigrams of tweet text. To optimize models, grid search was confirmed COVID-19 cases in each state, as tracked by The
used with all possible combinations of the following parameters: New York Times [28]. The mobility data used geolocation
the elastic net penalty varied the L1 ratio from 0 (equivalent to services from mobile devices (eg, smartphones) to generate
only “L2” penalty) to 1 (equivalent to only “L1” penalty), aggregate estimates about mobility within specific geographic
regularization strength varied in order of magnitude from 0.001 areas. Descartes Labs provides data at admin level 1 (state)
to 1000, and chi-square feature selection was varied from 10% mobility and admin level 2 (county) mobility [26]. For this work,
to 100% of the features (ie, no feature selection), in steps of we only consider state mobility. Descartes Labs uses a
10%, to explore the impact of feature reduction on model normalized value of the median maximum distance traveled
performance. each day: the m50 index. Here, data are normalized using the
median mobility per state between February 27 and March 7
Random Forest (ie, a pre–COVID-19 window). For this work, we looked at the
Random forest models were implemented using scikit-learn’s percent change in mobility (m50 index – 100) [27], which can
random forest classifier [24]. As in logistic regression, features be interpreted as the percent change in mobility relative to the
included all unigrams, bigrams, and trigrams of tweet text. baseline period.
Again, grid search was used to optimize models. The minimum We used these data as a ground truth data set to validate social
number of samples per leaf node was varied from 2 to 11 (in media tweets about social distancing and sheltering-in-place.
steps of 3), the minimum number of samples required to split For these comparisons, we restricted our data to those with
an internal node ranged from 2 to 52 (in steps of 10), and the geolocation services enabled (ie, those that used the tweet
number of trees per forest was either 50 or 100. Last, we “place” to determine location), which we then aggregated by
additionally varied the number of features. Because of the larger state. Here, data were aggregated to weekly data, and any weeks
number of parameters tested here, we tried feature selections with fewer than 50 tweets were removed. States with fewer than
of 25%, 50%, 75%, or 100% of features (ie, no feature 10 data points were excluded from visualization.
selection).
Classification and Bias Adjustments Results
Both types of models performed poorly for classifying Content Analysis and Labels
monitoring, personal protective equipment, and hygiene. As
In total, 7278 tweets were read and labeled. Of these, 2202
such, we did not use these models for downstream analysis.
tweets fell into the categories shown in Table 1. For each
Rather, we focus on the personal or impersonal model, the social
category and subcategory, the definition and an example
distancing classifier, and the shelter-in-place classifier.
anonymized tweet is shown. The most prevalent category by
Though random forest models sometimes produced slightly far was tweets about social distancing. Of these tweets, the vast
higher F1 scores, we used the logistic regression models for majority were about sheltering-in-place, writ broadly, including
overall classification and downstream analysis because of the tweets about adjusting to life at home (eg, work or school from
slightly higher precision values. Said another way, in this home); tweets about entertainment, including hobbies and
context, we preferred fewer false positives to slightly more false recipes; tweets about plans that were canceled (parties,
negatives because we were trying to identify a particular weddings, etc); and a few tweets about a supposed
behavior and wanted as few erroneous predictions included in “coronaboomer” phenomenon, where some suggested that the
the classifier as possible. additional time spent at home would lead to an increase in babies
born in 2021. In addition, we identified 53 tweets related to the
To combat the bias inherent in our classifiers, as it is clear that
mental health impacts of social distancing, including tweets
misclassification will occur, we used the method suggested by
about tactics to maintain positive mental health, as well as tweets
Daughton and Paul [25] to create confidence intervals that
describing the mental health difficulties associated with social
account for classifier error. The basic principle is to use
distancing.
bootstrapping to generate many samples and to subsequently
weight individual classifications by the positive predictive value In other categories, we again saw a wide variety of health topics
or negative predictive value of the classifier. The bootstrapped discussed. This included tweets about monitoring, of which
samples are then used to generate a 95% confidence interval roughly a third were about access to or experiences with
around the point estimate (see Daughton and Paul [25] for full COVID-19 testing; hygiene, including handwashing and
details). This method has been successfully applied in similar cleaning protocols; and a few tweets (n=49) weighing in on
work focused on identifying travel change behaviors in response COVID-19 vaccine development. Last, we also saw instances
to Zika [15]. For this work, we used 100 bootstrapped samples of tweets about the economic impacts of COVID-19, including
to generate daily confidence intervals. on the supply chain and in terms of unemployment.
https://www.jmir.org/2021/5/e27059 J Med Internet Res 2021 | vol. 23 | iss. 5 | e27059 | p. 4
(page number not for citation purposes)
XSL• FO
RenderXJOURNAL OF MEDICAL INTERNET RESEARCH Daughton et al
Table 1. Tweet content and relative proportion.
Category and subcate- Definition Example tweet (anonymized) Tweets
gories (N=7278), n (%)
Social distancing
All subcategories Discusses social distancing in either a positive or a negative “COVID-19 SUCKS! I can’t see my 1494 (20.5)
way (eg, not physically seeing friends and family, not going to family and I really miss them.”
work, or discussing reasons why lockdowns are unnecessary)
Shelter-in-place Discusses any aspects of shelter-in-place or stay-at-home poli- “State going into lockdown tomor- 1117 (15.3)
cies; includes school or daycare (or homeschool), remote work, row. I can work from home but I’m
things to do to keep busy while staying home (eg, hobbies and also going to catch up on my back-
recipes), canceled plans, delivery services (to avoid going out log Steam library!”
in public), and the supposed phenomenon that birth rates would
increase after the pandemic (“coronaboomers”)
Mental health Discussions about mental health; includes suggestions of activ- “I’m so stressed I’m going to cry. I 53 (0.7)
ities to maintain mental health while sheltering-in-place and don’t want to be where I am now, I
documents about the mental health difficulties associated with just want to be alone for quaran-
COVID-19 and social distancing tine.”
Voting Decisions around voting by mail (eg, for COVID-19–related “Record high cases in the past few 12 (0.2)
safety reasons or the opposite opinion) days. It’s been two weeks since the
election.”
Hoarding Storing things like food, medicines, and disaster supplies “Got a bunch of masks and gloves 31 (0.4)
in case the coronavirus becomes a
big deal here.”
Public events Descriptions of going to public places and choosing to not so- “Airport security was super fast -- 53 (0.7)
cially distance no lines at bag check.”
Monitoring
All subcategories Behavior monitoring for illness; includes monitoring friends or “I keep coming across people with 315 (4.3)
family that have the disease sore throats and cold symptoms to-
day. Hope it’s not COVID!”
Testing Ability or inability to get tested for COVID-19 infection; in- “The complete failure in testing 116 (1.6)
cludes tweets expressing desires for improvements and increases ramp up is really disappointing.”
in testing and novel testing strategies (eg, drive-through testing
centers), or in combination with other tactics like contact tracing
Remedies Unproven treatments, advice, and/or ways to “prevent” or “cure” “Anti Neo Plastons is the natural 84 (1.2)
the disease using natural methods (eg, vitamin D) cure for Coronavirus and your body
makes them naturally!”
Hygiene: all subcategories Trying to prevent sickness by using good hygiene, including “Just saw a kid about to use the wa- 94 (1.3)
handwashing, cleaning and sanitation, and other cleanliness- ter fountain. Their parent grabbed
related behaviors them and said ‘NOOOOOOOO…
there could be COVID!’”
Personal protective equip- Using personal protective equipment to prevent illness; includes “1.) Wear your mask 2.) Social dis- 164 (2.3)
ment: all subcategories masks and gloves tance 3.) Wash your hands! We can
do this!”
Vaccine
Provaccine Tweets that are positive and supportive of vaccine efforts “The work on the COVID vaccine 31 (0.4)
is amazing. I can’t wait to get it!”
Antivaccine Tweets that use vaccine-averse rhetoric to describe why a vac- “I hope you’re not in favor of the 18 (0.2)
cine will be unsafe or ill-advised Gates vaccine. I’m not going to be
tracked by a microchip!”
Economic
Supply chain Information or commentary about supply chain–related issues; “Can we trust the food supply 33 (0.5)
includes information about “price gouging” chain? Should we start growing our
own fruits and vegetables?”
Unemployment Includes descriptions of applying for unemployment benefits “I’m a driver for Uber, but I was put 53 (0.7)
or commentary on the process; includes stimulus checks or on medical leave after COVID-19
commentary about unemployment or underemployment due to exposure & haven’t made any mon-
COVID-19 ey since.”
https://www.jmir.org/2021/5/e27059 J Med Internet Res 2021 | vol. 23 | iss. 5 | e27059 | p. 5
(page number not for citation purposes)
XSL• FO
RenderXJOURNAL OF MEDICAL INTERNET RESEARCH Daughton et al
A breakdown of categories by personal and impersonal labels suggestions that do not describe a personal behavior). This is
is shown in Figure 2 (a), and subcategories are shown in Figure consistent with prior work, which has found that personal
2 (b). Overall, a small fraction of tweets were personal mentions; mentions of health-related behavior on social media are rare
the majority of tweets were impersonal mentions related to each [19].
category (eg, mentions of articles or general opinions and
Figure 2. Category distribution. Tweets are broken down by frequency of personal and impersonal labels (a) and by subcategory grouped by category
(b). Categories without subcategories are not shown in (b). Only categories with at least 80 labels, and subcategories with at least 50 labels, are shown.
PPE: personal protective equipment.
Because there were so few tweets in most categories, it was not was in the personal protective category, where the logistic
feasible to build robust classifiers for most categories or regression model substantially outperformed the random forest.
subcategories. For this work, we selected for classification only
For subsequent analysis, we focused on categories that achieved
the personal and impersonal classification task; the categories
an F1 of at least 0.6: personal or impersonal, social distancing,
of social distancing, monitoring, hygiene, and personal
and the shelter-in-place classifiers. We then applied the logistic
protective equipment; and the subcategory shelter-in-place. In
regression models to the remaining data in our corpus of over
general, we found similar performances between random forest
228 million tweets through July 2020.
and logistic regression (Table 2). The exception to this trend
https://www.jmir.org/2021/5/e27059 J Med Internet Res 2021 | vol. 23 | iss. 5 | e27059 | p. 6
(page number not for citation purposes)
XSL• FO
RenderXJOURNAL OF MEDICAL INTERNET RESEARCH Daughton et al
Table 2. Tweet classification results.
Classifier Logistic regression Random forest
Precision Recall F1 score Precision Recall F1 score
Personal or impersonal 0.76 0.50 0.60 0.72 0.57 0.64
Social distancing classifiers
Social distancing (category) 0.73 0.59 0.66 0.71 0.61 0.66
Shelter-in-place (subcategory) 0.69 0.60 0.64 0.65 0.65 0.65
Monitoring classifiers 0.72 0.17 0.28 0.32 0.13 0.18
Hygiene classifiers 0.50 0.29 0.36 0.33 0.21 0.26
Personal protective equipment (eg, masks and gloves) classifiers 0.59 0.52 0.55 0.40 0.24 0.30
March 2020 [29]—the number of tweets about social distancing
Temporal Patterns and sheltering-in-place doubled. Tweets in this category stayed
Using the full classified corpus, we compared temporal patterns high throughout the summer, as a large number of Americans
in social distancing tweets, shelter-in-place tweets, and the were under shelter-in-place orders [29]. In early April 2020,
subsets of those groupings which were also classified as personal estimates of the number of Americans told to stay at home were
mentions, to important real-world events that occurred during around 95%, despite widespread variation in how stay-at-home
the outbreak (Figure 3). Importantly, the proportion of tweets orders were implemented [30]. As expected, the number of
classified as social distancing and shelter-in-place tweets personal tweets was a small fraction of the social distancing
followed a predictable pattern with respect to real-world events and shelter-in-place tweets more broadly. There was little
occurring during the outbreak. Social distancing tweets occurred variation in the temporal patterns of personal tweets; all signals
soon after the initial US COVID-19 case as people started to came from the broader set of both personal and impersonal
discuss initial reactions to the new disease. As states began to tweets.
institute shelter-in-place orders—with California leading in late
Figure 3. Temporal patterns in social distancing and shelter-in-place tweets. The proportion of tweets classified as general social distancing,
shelter-in-place, personal shelter-in-place, and personal social distancing are shown by date. Relevant events in the outbreak are shown as vertical lines.
As states increased shelter-in-place and lockdown orders, the number of tweets about social distancing and sheltering-in-place dramatically increased.
Shading shows the 95% CI calculated using classifier-adjusted bootstrapped sampling while the median is a solid line. CIs are extremely small at several
time points. CA: California; SIP: shelter-in-place.
https://www.jmir.org/2021/5/e27059 J Med Internet Res 2021 | vol. 23 | iss. 5 | e27059 | p. 7
(page number not for citation purposes)
XSL• FO
RenderXJOURNAL OF MEDICAL INTERNET RESEARCH Daughton et al
State Patterns: Comparisons to Mobility Data general, most states observed these dates within ±20 days of
To evaluate temporal patterns more closely, we considered each other, with the majority of states observing the day of
patterns in individual states and compared them to mobility data minimum mobility before the day with the most tweets about
derived from mobile phone devices (Figures 4-6) and the actual social distancing, as seen in Figure 5 (c). Further, there is a
number of confirmed COVID-19 cases (Figure 6). At a high strong negative correlation between the mobility data and the
level, it is clear that there is an inverse relationship between the classified Twitter data (Figure 6). Though patterns vary by state,
proportion of tweets about social distancing and the actual the average correlation is –0.42. Some states show a notably
movement of individuals (Figure 4), indicating that social weaker signal (eg, Arkansas, New Mexico, and Rhode Island),
distancing conversations on Twitter may actually be reflective which could be caused in part by the relative lack of data in
of real-world behavior. However, we can also see interesting these states. Taken together, these suggest a reasonably strong
regional patterns among states. For example, some of the relationship between our classified Twitter data set and the
earliest-hit states (eg, California, Washington, and New York) ground truth mobility data. These patterns are not as clearly
showed peaks in the number of tweets about social distancing reflected in the relationship to confirmed COVID-19 cases. The
in late March 2020 compared to states that saw comparatively average correlation between the proportion of tweets about
few cases early on (eg, Florida and Georgia, which had peaks social distancing and the number of confirmed COVID-19 cases
in the number of social distancing tweets in late April 2020). is –0.08, though the strongest, which comes from Alabama, is
–0.53. This suggests that, while social distancing discussions
Most states observed the lowest mobility in April 2020, as seen on social media are reflective of actual social distancing
in Figure 5 (a). The day with the highest fraction of social practices as measured by mobility data, the link to COVID-19
distancing tweets was most often in March 2020, though many transmission is likely more complicated.
states observed this in April as well, as seen in Figure 5 (b). In
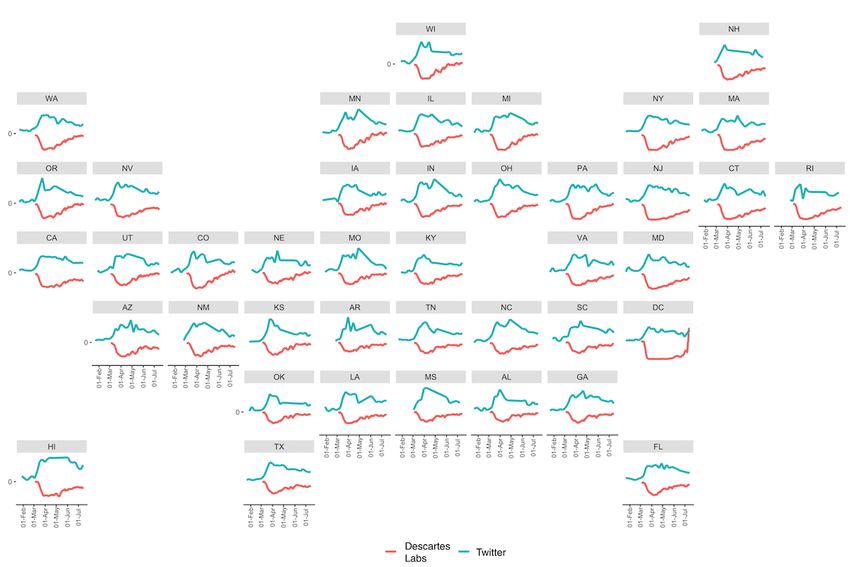
Figure 4. US state patterns in mobility compared to social distancing tweets from January to July 2020. Descartes Lab data showing a rolling 7-day
average of percent change in mobility (divided by 5, to improve visualization) is plotted alongside the proportion of social distancing tweets per week.
Both temporal and regional patterns are clear. Further, as the proportion of social distancing tweets increased, mobility measured by Descartes Labs
decreased. States without sufficient Twitter data were removed from the grid. 2-letter abbreviations are used for each state.
https://www.jmir.org/2021/5/e27059 J Med Internet Res 2021 | vol. 23 | iss. 5 | e27059 | p. 8
(page number not for citation purposes)
XSL• FO
RenderXJOURNAL OF MEDICAL INTERNET RESEARCH Daughton et al
Figure 5. Comparison of peak social distancing tweet proportions and minimum mobility. To validate our social media findings, we compared them
to mobility data provided by Descartes Labs. Dates of minimum mobility are aggregated by month (a), while dates of highest proportion of tweets about
social distancing, aggregated by month, are shown in (b). The difference, in days, between the date of minimum mobility and the date of highest
proportion of social distancing tweets (c) show that most states observed both peaks within 20 days of one another.
Figure 6. Correlation between confirmed COVID-19 cases or mobility and proportion of tweets about social distancing by US state. Most states have
a moderate negative correlation between the proportion of tweets about social distancing and mobility data (yellow), indicating good agreement in the
two signals. Some states have notably weaker negative correlations (eg, AR, NM, and RI), which could be the result of less Twitter data. Correlations
between the number of confirmed COVID-19 cases and the proportion of tweets about social distancing are weak (blue), with a few notable exceptions
(eg, AL). 2-letter abbreviations are used for each state.
What behaviors related to COVID-19 are discussed on social
Discussion media websites, like Twitter? We find that there are a wide
Principal Findings variety of behaviors discussed on social media, including
mask-wearing, hygiene (eg, handwashing), testing availability
The ongoing COVID-19 outbreak clearly illustrates the need and experiences, and social distancing practices. Prior work has
for real-time information gathering to assess evolving beliefs found evidence that mask-wearing and limited mobility were
and behaviors that directly impact disease spread. Historically, behaviors adopted to reduce disease spread during SARS [5]
such information would be gathered using survey methods and that handwashing would be commonly implemented by
[5,7,31], which are time-consuming, expensive, and typically individuals during a hypothetical pandemic influenza [47]. This
lack the ability to measure temporal and spatial variation [32]. prior work, however, has relied on surveys to obtain data about
One proposed partial solution is to use internet data (eg, search the behaviors that individuals implement. The use of social
query patterns and social media data), which have been shown media to complement such work would improve both the
to correspond to disease incidence in emergent infectious disease richness and the temporal and geographic scope of the data
outbreaks [23,33-35], individual risk perception [1,36,37], and available.
risk communication [38], and have been used to identify specific
health behaviors [15]. During the early stages of the current Some of the identified tweets show evidence of sensitive topics.
COVID-19 pandemic, social media data have been used to For example, we found 53 tweets related to individuals’ mental
monitor the top concerns of individuals [39,40], characterize health. Prior research has found that social media can be used
COVID-19 awareness [41], compare social connectedness and to identify individuals with a variety of mental health concerns,
COVID-19 hot spots [42], monitor misinformation [40,43-45], including depression [48] and suicide [14]. As there is
and rapidly disseminate information [46]. Last, social media considerable work emerging about the substantial mental health
has been used as an information gathering platform during impacts of COVID-19 (eg, increases in domestic violence [49]
periods of uncertain information. Disease emergence is a context as well as depression and anxiety [50]), this could prove to be
wherein disease risks, transmission, and treatment may be an important avenue for future work in this field.
largely unclear [46]. With this context in mind, we address our Last, we found a small number of tweets (n=49) about
findings with respect to each research question below. vaccination related to COVID-19, of which roughly a third
(n=18) showed a negative attitude. Importantly, this study was
https://www.jmir.org/2021/5/e27059 J Med Internet Res 2021 | vol. 23 | iss. 5 | e27059 | p. 9
(page number not for citation purposes)
XSL• FO
RenderXJOURNAL OF MEDICAL INTERNET RESEARCH Daughton et al
conducted prior to the authorization of any vaccines in the moment in time will be influenced by contextual information
United States. All of the tweets considered here discuss either about other aspects of their lives. For example, people that tweet
vaccine development or a hypothetical COVID-19 vaccine. in support of social distancing may have in-person jobs or be
Prior research has found similarly negative tweets during the in high-risk groups, which could motivate them to use social
emergence of Zika [51] and the H1N1 influenza pandemic [52]. media platforms to voice support for public health measures.
Future work analyzing these data could provide additional The stronger correlation with mobility outcomes is expected by
insight into specific reasons that populations may be hesitant this same argument because mobility is more directly
to receive the COVID-19 vaccine and could inform targeted representative of individual actions.
public health messaging.
Additionally, tweeting norms could be systematically different
How do patterns in behaviors change geospatially and across the country (eg, people in different states might be more
temporally in the United States? As expected, the patterns in or less likely to talk about social distancing based on the policies
tweets classified as social distancing and shelter-in-place in place and the perceived threat of COVID-19). It is also
followed extremely similar trends. These patterns corresponded possible that there are differences in which individuals use
to important real-world events during the outbreak, suggesting Twitter and have geolocation services enabled in different states.
that individuals were responding to actual events and some were In an operational context, it is hugely important to combine
describing their own personal behavior. We found, however, internet data with traditional data streams in order to provide a
that tweets classified as personal mentions represented a very more complete picture of an evolving scenario. Future work
small subset of social distancing and shelter-in-place tweets. should focus on targeted studies to better understand potential
This is not unexpected, given that prior work has shown that bias.
personal mentions of health may be extremely uncommon [20].
An additional known source of bias comes from imperfect
How do these trends compare to other data streams, like classification. Our classifiers performed similarly to other
mobility data sets, that have also shown promise in COVID-19 classifiers used to identify health behaviors [15], but were
modeling efforts? Despite the lack of a temporal signal in tweets clearly not perfect. To account for known classifier bias, we
labeled as personal and social distancing, there was a stronger used an adjusted bootstrapping method from Daughton and Paul
signal when comparing classified data to Descartes Labs’ [25], which generates accurate confidence intervals despite
mobility data. We observed meaningful regional differences classifier error.
between states and saw that, in general, the peak number of
We validated our work using mobility data from Descartes Labs.
tweets about social distancing happened within a few weeks of
However, there are a number of mobility data sources available
the actual measured minimum in mobility. This suggests that
[54]. Prior work indicates that these data have similar patterns
social media data may be used as a proxy for sensor data in
[54], but it is possible that using a different source would
appropriately data-rich contexts. Recent work using geotagged
produce slightly different validation results.
Twitter data to create social networks and analyze social
distancing in the context of policy decisions found similar Conclusions
relationships and supports this finding [53]. Behavior changes and policy decisions that occur early within
Limitations an outbreak have the largest effects on disease dynamics [55,56].
Real-time conversations about health behaviors, in addition to
There are a number of limitations to consider in this work. The
other behavioral data sources such as mobility metrics or media
first is that, as mentioned above, it is known that social media
consumption (eg, home television viewing [55]), could help
data are biased in a number of ways, including demographically,
improve overall knowledge and policy decisions in the early
and that bias differs by geographic areas [18]. Further, personal
stages of an epidemic and could better capture dynamic changes
mentions of health-related information on Twitter are rare [19].
caused by uncoordinated behavioral change. Using such data
These are known limitations of using internet data and could
has the unique capability to inform public health decisions as
potentially explain the variations in correlation we observed
an outbreak emerges, especially with respect to public health
between social distancing posts and actual mobility data.
communication. The World Health Organization suggests a
Importantly, however, it is difficult to assess this without
communication checklist to prepare for and minimize morbidity
extensive prospective surveys conducted at the same time as
and mortality in the event of a pandemic [57,58]. The checklist
tweet collection.
emphasizes building public trust through early communication,
Our observed wide range in correlations between the proportion even with incomplete information, and evaluating the impact
of social distancing tweets and actual COVID-19 cases in of communication programs to assess whether recommendations
individual states is an example of the ecological fallacy. are being followed. The use of social media streams as a
State-level COVID-19 cases represent an aggregate measure of simultaneous real-time measure of public sentiment toward
a state’s behavior, while tweets represent individual actions and messaging and a dynamic evaluation tool of communication
observations. The available data do not allow us to probe the effectiveness could be invaluable in minimizing effects from a
reasons for the variation, but a number of possible factors could future disease outbreak.
be at play. Individuals’ social distancing thoughts at a specific
https://www.jmir.org/2021/5/e27059 J Med Internet Res 2021 | vol. 23 | iss. 5 | e27059 | p. 10
(page number not for citation purposes)
XSL• FO
RenderXJOURNAL OF MEDICAL INTERNET RESEARCH Daughton et al
Acknowledgments
ARD, CDS, and DG created the labeling schema. DG, NP, TP, ARD, CWR, GF, and NYVC collected and analyzed the Twitter
data. ARD, CDS, DG, IC, GN, and NM labeled the tweets. ARD and CWR built the supervised learning models, and ARD
implemented the classifier-adjusted bootstrapped sampling. MB collected the mobility data and created several figures. ARD,
CDS, and MB wrote the initial paper. All authors provided critical revisions to the paper. ARD led the project. Research support
was provided by the Laboratory Directed Research and Development program of Los Alamos National Laboratory (project No.
20200721ER) and the US Department of Energy through the Los Alamos National Laboratory. Los Alamos National Laboratory
is operated by Triad National Security, LLC, for the National Nuclear Security Administration of the US Department of Energy
(Contract No. 89233218CNA000001). The Los Alamos National Laboratory Review & Approval System reporting number is
LA-UR-21-20074.
Conflicts of Interest
None declared.
References
1. Taylor S. The Psychology of Pandemics: Preparing for the Next Global Outbreak of Infectious Disease. Newcastle upon
Tyne, UK: Cambridge Scholars Publishing; 2019.
2. Bults M, Beaujean DJ, Richardus JH, Voeten HA. Perceptions and behavioral responses of the general public during the
2009 influenza A (H1N1) pandemic: A systematic review. Disaster Med Public Health Prep 2015 Apr;9(2):207-219. [doi:
10.1017/dmp.2014.160] [Medline: 25882127]
3. Douglas PK, Douglas DB, Harrigan DC, Douglas KM. Preparing for pandemic influenza and its aftermath: Mental health
issues considered. Int J Emerg Ment Health 2009;11(3):137-144. [Medline: 20437844]
4. Shultz JM, Espinel Z, Flynn BW, Hoffman Y, Cohen RE. Deep Prep: All-Hazards Disaster Behavioral Health Training.
Miami, FL: Miller School of Medicine, University of Miami; 2008.
5. Lau JTF, Yang X, Pang E, Tsui HY, Wong E, Wing YK. SARS-related perceptions in Hong Kong. Emerg Infect Dis 2005
Mar;11(3):417-424 [FREE Full text] [doi: 10.3201/eid1103.040675] [Medline: 15757557]
6. MacDonald PDM, Holden EW. Zika and public health: Understanding the epidemiology and information environment.
Pediatrics 2018 Feb 01;141(Supplement 2):S137-S145. [doi: 10.1542/peds.2017-2038b]
7. Darrow W, Bhatt C, Rene C, Thomas L. Zika virus awareness and prevention practices among university students in Miami:
Fall 2016. Health Educ Behav 2018 Dec;45(6):967-976. [doi: 10.1177/1090198118760687] [Medline: 29534620]
8. Mendoza C, Jaramillo G, Ant TH, Power GM, Jones RT, Quintero J, et al. An investigation into the knowledge, perceptions
and role of personal protective technologies in Zika prevention in Colombia. PLoS Negl Trop Dis 2020 Jan;14(1):e0007970
[FREE Full text] [doi: 10.1371/journal.pntd.0007970] [Medline: 31961867]
9. White RW, Horvitz E. From health search to healthcare: Explorations of intention and utilization via query logs and user
surveys. J Am Med Inform Assoc 2014;21(1):49-55 [FREE Full text] [doi: 10.1136/amiajnl-2012-001473] [Medline:
23666794]
10. Coogan S, Sui Z, Raubenheimer D. Gluttony and guilt: Monthly trends in internet search query data are comparable with
national-level energy intake and dieting behavior. Palgrave Commun 2018 Jan 9;4(1):1-9. [doi: 10.1057/s41599-017-0055-7]
11. Ayers JW, Ribisl KM, Brownstein JS. Tracking the rise in popularity of electronic nicotine delivery systems (electronic
cigarettes) using search query surveillance. Am J Prev Med 2011 Apr;40(4):448-453. [doi: 10.1016/j.amepre.2010.12.007]
[Medline: 21406279]
12. Eichstaedt JC, Schwartz HA, Kern ML, Park G, Labarthe DR, Merchant RM, et al. Psychological language on Twitter
predicts county-level heart disease mortality. Psychol Sci 2015 Feb;26(2):159-169 [FREE Full text] [doi:
10.1177/0956797614557867] [Medline: 25605707]
13. Paul MJ, Dredze M. You are what you tweet: Analyzing Twitter for public health. In: Proceedings of the Fifth International
AAAI Conference on Weblogs and Social Media. 2011 Presented at: Fifth International AAAI Conference on Weblogs
and Social Media; July 17-21, 2011; Barcelona, Spain URL: https://ojs.aaai.org/index.php/ICWSM/article/view/14137/
13986
14. McClellan C, Ali MM, Mutter R, Kroutil L, Landwehr J. Using social media to monitor mental health discussions - Evidence
from Twitter. J Am Med Inform Assoc 2017 May 01;24(3):496-502 [FREE Full text] [doi: 10.1093/jamia/ocw133] [Medline:
27707822]
15. Daughton AR, Paul MJ. Identifying protective health behaviors on Twitter: Observational study of travel advisories and
Zika virus. J Med Internet Res 2019 May 13;21(5):e13090 [FREE Full text] [doi: 10.2196/13090] [Medline: 31094347]
16. Ramanadhan S, Mendez SR, Rao M, Viswanath K. Social media use by community-based organizations conducting health
promotion: A content analysis. BMC Public Health 2013 Dec 05;13:1129 [FREE Full text] [doi: 10.1186/1471-2458-13-1129]
[Medline: 24313999]
17. Carrotte ER, Prichard I, Lim MSC. "Fitspiration" on social media: A content analysis of gendered images. J Med Internet
Res 2017 Mar 29;19(3):e95 [FREE Full text] [doi: 10.2196/jmir.6368] [Medline: 28356239]
https://www.jmir.org/2021/5/e27059 J Med Internet Res 2021 | vol. 23 | iss. 5 | e27059 | p. 11
(page number not for citation purposes)
XSL• FO
RenderXJOURNAL OF MEDICAL INTERNET RESEARCH Daughton et al
18. Mislove A, Lehmann S, Ahn Y, Onnela J, Rosenquist J. Understanding the demographics of Twitter users. In: Proceedings
of the Fifth International AAAI Conference on Weblogs and Social Media. 2011 Presented at: Fifth International AAAI
Conference on Weblogs and Social Media; July 17-21, 2011; Barcelona, Spain URL: https://www.aaai.org/ocs/index.php/
ICWSM/ICWSM11/paper/viewFile/2816/3234
19. Daughton AR, Chunara R, Paul MJ. Comparison of social media, syndromic surveillance, and microbiologic acute respiratory
infection data: Observational study. JMIR Public Health Surveill 2020 Apr 24;6(2):e14986 [FREE Full text] [doi:
10.2196/14986] [Medline: 32329741]
20. Engle S, Stromme J, Zhou A. Staying at home: Mobility effects of COVID-19. SSRN J 2020:1-16 (forthcoming). [doi:
10.2139/ssrn.3565703]
21. Buckee CO, Balsari S, Chan J, Crosas M, Dominici F, Gasser U, et al. Aggregated mobility data could help fight COVID-19.
Science 2020 Apr 10;368(6487):145-146. [doi: 10.1126/science.abb8021] [Medline: 32205458]
22. Chen E, Lerman K, Ferrara E. Tracking social media discourse about the COVID-19 pandemic: Development of a public
coronavirus Twitter data set. JMIR Public Health Surveill 2020 May 29;6(2):e19273 [FREE Full text] [doi: 10.2196/19273]
[Medline: 32427106]
23. Lamb A, Paul MJ, Dredze M. Separating fact from fear: Tracking flu infections on Twitter. In: Proceedings of the 2013
Conference of the North American Chapter of the Association for Computational Linguistics: Human Language Technologies.
2013 Presented at: 2013 Conference of the North American Chapter of the Association for Computational Linguistics:
Human Language Technologies; June 9-14, 2013; Atlanta, GA p. 789-795.
24. Pedregosa F, Varoquaux G, Gramfort A, Michel V, Thirion B, Grisel O, et al. Scikit-learn: Machine learning in Python. J
Mach Learn Res 2011 Nov;12:2825-2830 [FREE Full text] [doi: 10.5555/1953048.2078195]
25. Daughton AR, Paul MJ. Constructing accurate confidence intervals when aggregating social media data for public health
monitoring. In: Proceedings of the International Workshop on Health Intelligence (W3PHAI 2019). 2019 Presented at:
International Workshop on Health Intelligence (W3PHAI 2019); January 27-February 1, 2019; Honolulu, HI.
26. Data for mobility changes in response to COVID-19. GitHub. Santa Fe, NM: Descartes Labs URL: https://github.com/
descarteslabs/DL-COVID-19 [accessed 2021-05-06]
27. Warren MS, Skillman SW. Mobility changes in response to COVID-19. ArXiv. Preprint posted online on March 31, 2020.
[FREE Full text]
28. Coronavirus (Covid-19) data in the United States. GitHub. New York, NY: The New York Times URL: https://github.com/
nytimes/covid-19-data [accessed 2021-05-06]
29. State “shelter-in-place” and “stay-at-home” orders. FINRA. URL: https://www.finra.org/rules-guidance/key-topics/covid-19/
shelter-in-place [accessed 2020-12-23]
30. Mervosh S, Lu D, Swales V. See which states and cities have told residents to stay at home. The New York Times. 2020
Apr 20. URL: https://www.nytimes.com/interactive/2020/us/coronavirus-stay-at-home-order.html [accessed 2021-01-05]
31. Chandrasekaran N, Marotta M, Taldone S, Curry C. Perceptions of community risk and travel during pregnancy in an area
of Zika transmission. Cureus 2017 Jul 26;9(7):e1516 [FREE Full text] [doi: 10.7759/cureus.1516] [Medline: 28959511]
32. Blaikie N. Designing Social Research: The Logic of Anticipation. 2nd edition. Cambridge, UK: Polity Press; 2009.
33. Chan EH, Sahai V, Conrad C, Brownstein JS. Using web search query data to monitor dengue epidemics: A new model
for neglected tropical disease surveillance. PLoS Negl Trop Dis 2011 May;5(5):e1206. [doi: 10.1371/journal.pntd.0001206]
[Medline: 21647308]
34. Culotta A. Towards detecting influenza epidemics by analyzing Twitter messages. In: Proceedings of the First Workshop
on Social Media Analytics (SOMA '10). 2010 Presented at: First Workshop on Social Media Analytics (SOMA '10); July
25, 2010; Washington, DC p. 155-122. [doi: 10.1145/1964858.1964874]
35. Watad A, Watad S, Mahroum N, Sharif K, Amital H, Bragazzi NL, et al. Forecasting the West Nile virus in the United
States: An extensive novel data streams-based time series analysis and structural equation modeling of related digital
searching behavior. JMIR Public Health Surveill 2019 Feb 28;5(1):e9176 [FREE Full text] [doi: 10.2196/publichealth.9176]
[Medline: 30601755]
36. Hassan MS, Halbusi HA, Najem A, Razali A, Williams KA, Mustamil NM. Impact of risk perception on trust in government
and self-efficiency during COVID-19 pandemic: Does social media content help users adopt preventative measures?
Research Square. Preprint posted online on July 16, 2020. [doi: 10.21203/rs.3.rs-43836/v1]
37. Oh SH, Lee SY, Han C. The effects of social media use on preventive behaviors during infectious disease outbreaks: The
mediating role of self-relevant emotions and public risk perception. Health Commun 2020 Feb 16:1-10. [doi:
10.1080/10410236.2020.1724639] [Medline: 32064932]
38. Ding H, Zhang J. Social media and participatory risk communication during the H1N1 flu epidemic: A comparative study
of the United States and China. China Media Res 2010;6(4):80-91 [FREE Full text]
39. Abd-Alrazaq A, Alhuwail D, Househ M, Hamdi M, Shah Z. Top concerns of tweeters during the COVID-19 pandemic:
Infoveillance study. J Med Internet Res 2020 Apr 21;22(4):e19016 [FREE Full text] [doi: 10.2196/19016] [Medline:
32287039]
40. Singh L, Bansal S, Bode L, Budakb C, Chic G, Kawintiranona K, et al. A first look at COVID-19 information and
misinformation sharing on Twitter. ArXiv. Preprint posted online on March 31, 2020. [FREE Full text]
https://www.jmir.org/2021/5/e27059 J Med Internet Res 2021 | vol. 23 | iss. 5 | e27059 | p. 12
(page number not for citation purposes)
XSL• FO
RenderXJOURNAL OF MEDICAL INTERNET RESEARCH Daughton et al
41. Saad M, Hassan M, Zaffar F. Towards characterizing COVID-19 awareness on Twitter. ArXiv. Preprint posted online on
May 21, 2020. [FREE Full text]
42. Bailey M, Cao R, Kuchler T, Stroebel J, Wong A. Social connectedness: Measurement, determinants, and effects. J Econ
Perspect 2018 Aug 01;32(3):259-280. [doi: 10.1257/jep.32.3.259]
43. Ahmed W, Vidal-Alaball J, Downing J, López Seguí F. COVID-19 and the 5G conspiracy theory: Social network analysis
of Twitter data. J Med Internet Res 2020 May 06;22(5):e19458 [FREE Full text] [doi: 10.2196/19458] [Medline: 32352383]
44. Broniatowski DA, Paul MJ, Dredze M. National and local influenza surveillance through Twitter: An analysis of the
2012-2013 influenza epidemic. PLoS One 2013;8(12):e83672 [FREE Full text] [doi: 10.1371/journal.pone.0083672]
[Medline: 24349542]
45. Gerts D, Shelley CD, Parikh N, Pitts T, Watson Ross C, Fairchild G, et al. "Thought I'd share first" and other conspiracy
theory tweets from the COVID-19 infodemic: Exploratory study. JMIR Public Health Surveill 2021 Apr 14;7(4):e26527
[FREE Full text] [doi: 10.2196/26527] [Medline: 33764882]
46. Chan AKM, Nickson CP, Rudolph JW, Lee A, Joynt GM. Social media for rapid knowledge dissemination: Early experience
from the COVID-19 pandemic. Anaesthesia 2020 Dec;75(12):1579-1582 [FREE Full text] [doi: 10.1111/anae.15057]
[Medline: 32227594]
47. Sadique MZ, Edmunds WJ, Smith RD, Meerding WJ, de Zwart O, Brug J, et al. Precautionary behavior in response to
perceived threat of pandemic influenza. Emerg Infect Dis 2007 Sep;13(9):1307-1313 [FREE Full text] [doi:
10.3201/eid1309.070372] [Medline: 18252100]
48. De Choudhury CM, Gamon M, Counts S, Horvitz S. Predicting depression via social media. In: Proceedings of the Seventh
International AAAI Conference on Weblogs and Social Media. 2013 Presented at: Seventh International AAAI Conference
on Weblogs and Social Media; July 8-11, 2013; Boston, MA URL: https://www.aaai.org/ocs/index.php/ICWSM/ICWSM13/
paper/viewFile/6124/6351
49. Kofman YB, Garfin DR. Home is not always a haven: The domestic violence crisis amid the COVID-19 pandemic. Psychol
Trauma 2020 Aug;12(S1):S199-S201 [FREE Full text] [doi: 10.1037/tra0000866] [Medline: 32478558]
50. Vindegaard N, Benros ME. COVID-19 pandemic and mental health consequences: Systematic review of the current
evidence. Brain Behav Immun 2020 Oct;89:531-542 [FREE Full text] [doi: 10.1016/j.bbi.2020.05.048] [Medline: 32485289]
51. Ghenai A, Mejova Y. Catching Zika fever: Application of crowdsourcing and machine learning for tracking health
misinformation on Twitter. In: Proceedings of the 2017 IEEE International Conference on Healthcare Informatics (ICHI).
2017 Presented at: 2017 IEEE International Conference on Healthcare Informatics (ICHI); August 23-26, 2017; Park City,
UT p. 518. [doi: 10.1109/ichi.2017.58]
52. Salathé M, Khandelwal S. Assessing vaccination sentiments with online social media: Implications for infectious disease
dynamics and control. PLoS Comput Biol 2011 Oct;7(10):e1002199 [FREE Full text] [doi: 10.1371/journal.pcbi.1002199]
[Medline: 22022249]
53. Porcher S, Renault T. Social distancing beliefs and human mobility: Evidence from Twitter. ArXiv. Preprint posted online
on August 10, 2020. [FREE Full text] [doi: 10.1371/journal.pone.0246949]
54. Huang X, Li Z, Jiang Y, Ye X, Deng C, Zhang J, et al. The characteristics of multi-source mobility datasets and how they
reveal the luxury nature of social distancing in the US during the COVID-19 pandemic. Int J Digit Earth 2021 Feb
17;14(4):424-442. [doi: 10.1080/17538947.2021.1886358]
55. Schwarzinger M, Flicoteaux R, Cortarenoda S, Obadia Y, Moatti J. Low acceptability of A/H1N1 pandemic vaccination
in French adult population: Did public health policy fuel public dissonance? PLoS One 2010 Apr 16;5(4):e10199 [FREE
Full text] [doi: 10.1371/journal.pone.0010199] [Medline: 20421908]
56. Springborn M, Chowell G, MacLachlan M, Fenichel EP. Accounting for behavioral responses during a flu epidemic using
home television viewing. BMC Infect Dis 2015 Jan 23;15:21 [FREE Full text] [doi: 10.1186/s12879-014-0691-0] [Medline:
25616673]
57. World Health Organization, Department of Communicable Disease Surveillance and Response. WHO Guidelines for
Epidemic Preparedness and Response to Measles Outbreaks. Geneva, Switzerland: World Health Organization; 1999 May.
URL: http://www.who.int/csr/resources/publications/measles/whocdscsrisr991.pdf [accessed 2016-07-27]
58. World Health Organization, Department of Communicable Disease Surveillance and Response, Global Influenza Programme.
WHO Checklist for Influenza Pandemic Preparedness Planning. Geneva, Switzerland: World Health Organization; 2005.
URL: https://www.who.int/influenza/resources/documents/FluCheck6web.pdf?ua=1 [accessed 2020-05-06]
Abbreviations
API: application programming interface
https://www.jmir.org/2021/5/e27059 J Med Internet Res 2021 | vol. 23 | iss. 5 | e27059 | p. 13
(page number not for citation purposes)
XSL• FO
RenderXYou can also read