Peter Espeut - Impacts of increased international demand on fisheries on local populations, with particular attention to local economic status and ...

Page created by Tom Goodwin
 
CONTINUE READING
Peter Espeut - Impacts of increased international demand on fisheries on local populations, with particular attention to local economic status and ...
Impacts of increased international
     demand on fisheries on local
populations, with particular attention to
   local economic status and health

       Peter Espeut
     Executive Director, Caribbean
      Coastal Area Management
              Foundation
Peter Espeut - Impacts of increased international demand on fisheries on local populations, with particular attention to local economic status and ...
INCREASED GLOBAL DEMAND FOR
     FISH AND FISH PRODUCTS

• Food (protein) for humans
• Omega fatty acids for human health
• Fish meal for aquaculture, ultimately
  as food for humans
• Pet food
Peter Espeut - Impacts of increased international demand on fisheries on local populations, with particular attention to local economic status and ...
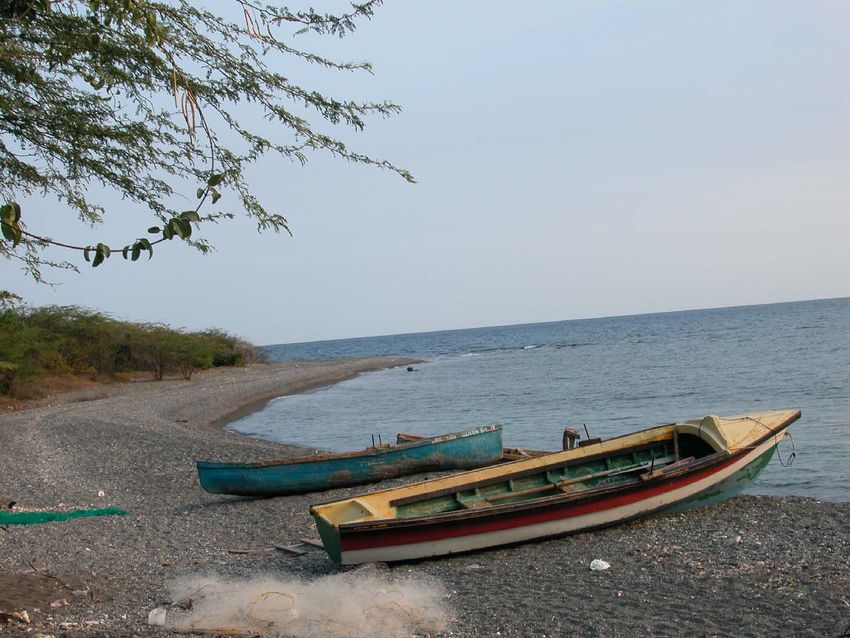
HUMANITY IS THE
 ULTIMATE TOP
  PREDATOR
HUMANITY ORGANIZES
 THE WORLD AROUND
  HUMAN WELFARE
Peter Espeut - Impacts of increased international demand on fisheries on local populations, with particular attention to local economic status and ...
ANTHROPOCENTRICISM
    We can question
whether this is the best
    or even a morally
 justifiable principle on
   which to order the
          world.
Peter Espeut - Impacts of increased international demand on fisheries on local populations, with particular attention to local economic status and ...
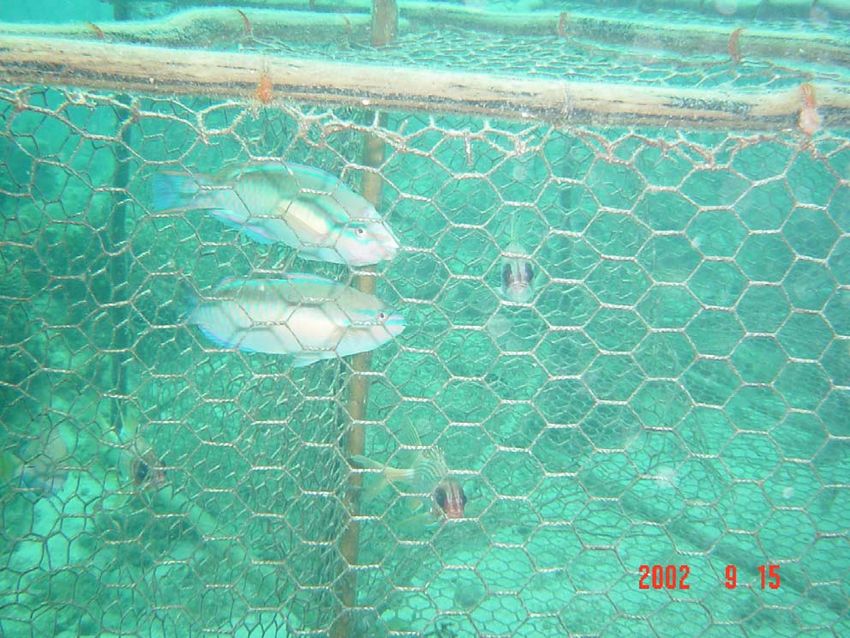
Causes of Increased Demand
• Human population increase
• Fish and fish products are healthier
  for humans than red meat
• Increasing human concerns about
  terrestrial animal welfare
Peter Espeut - Impacts of increased international demand on fisheries on local populations, with particular attention to local economic status and ...
MAIN SOURCE OF GLOBAL DATA
DELGADO, Christopher L. et al.
 Fish to 2020: Supply and
 Demand in Changing Global
 Markets. World Fish Centre &
 International Food Policy
 Research Institute.
Peter Espeut - Impacts of increased international demand on fisheries on local populations, with particular attention to local economic status and ...
Increasing Global Fish
                Consumption
• Global consumption of fish has doubled since 1973.
• 90% of this growth in the developing world.
   – Saturation of diets in developed countries, coupled with low
     rates of population and urban growth
   – In developing countries, population growth and ~75%
     increase in per capita consumption
   – Per capita consumption still higher in developed countries
• According to the FAO, fish consumption is growing
  in developing countries, but growth has tapered off
  in developed countries.
Peter Espeut - Impacts of increased international demand on fisheries on local populations, with particular attention to local economic status and ...
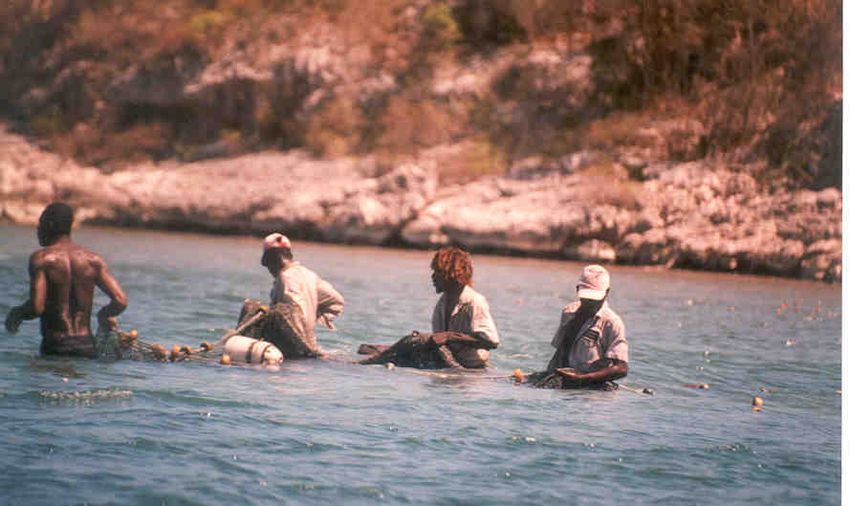
GLOBAL PER CAPITA
 DEMAND FOR FISH
Regional Differences
• Increases throughout Asia, but largest
  increase in China
• Decline in per capita consumption in Sub-
  Saharan Africa since mid-1980’s
• Jamaica more similar to SSA in
  consumption patterns
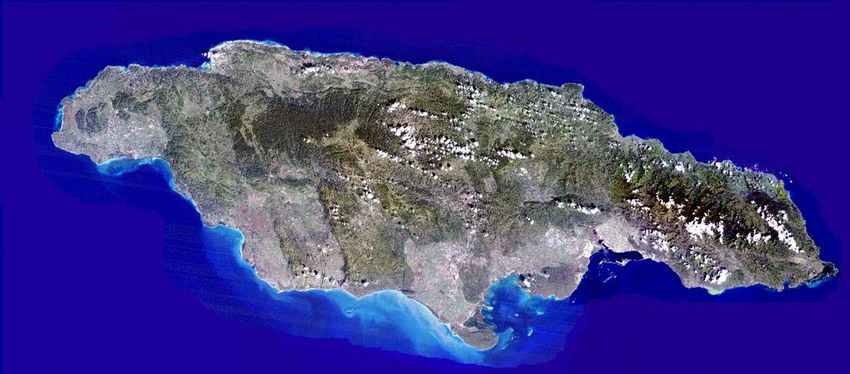
NOW ON TO JAMAICA
                            144 miles long

44 miles wide                   3rd largest
 Area:         10,990.5 km2 or 4,440 miles2
 Population:   2,641,600 (2003)
FISHERIES PROFILE
• No industrial fleet
• About 16,000 artisanal fishers
• Using mostly open fiberglass
  canoes + 40 hp outboard engine
• Some use of dugout canoes + oars
• Many spearfishers operate from the
  shore (no boats)
COMMON GEAR: FISH TRAPS
 THE ANTILLEAN
      “Z” TRAP
There is no legal
or illegal mesh
size.
From 1” to 1½ ”
Catches juveniles
COMMON GEAR: FISH TRAPS
COMMON GEAR: TRAMMEL NETS
COMMON GEAR: BEACH SEINES

• Not illegal
• Drag along the seafloor,
  uprooting coral and
  seagrass
COMMON GEAR: FREE DIVING
• Diving for fish is not illegal, even
  with SCUBA and Hooka
• The fish do not have a chance,
  especially at night
• The reef is damaged by the spears
• Sometimes divers use chisels to
  get at lobsters
ILLEGAL/COMMON GEAR:
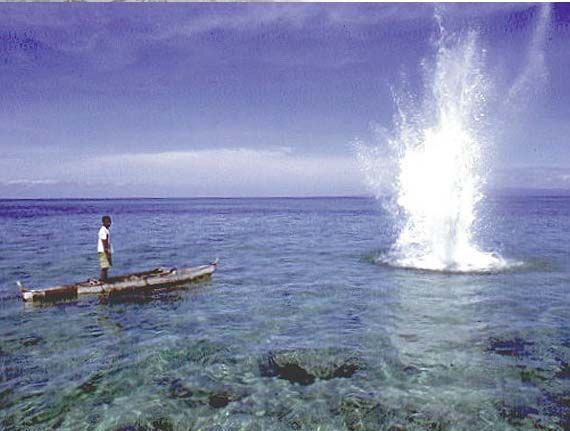
      DYNAMITE
Fishing Grounds
•   North Shelf (narrow)
•   South Shelf (wider)
•   Inshore Banks (Day trips)
•   Offshore Banks (some stay for
    months)
FISHING GROUNDS: JAMAICA

          Inshore Banks

            Offshore Banks
Clear Caribbean Waters
• Good for tourism, but
  poor in plankton
• Fisheries are relatively
  poor to begin with
Local Demand for Fish
• Local demand for fish is much greater
  than the capture fishery can supply.
• The demand and good price has led
  fishers to fish harder, and therefore to
  overfishing.
THE HISTORY OF OVERFISHING
A = Overfishing during Pre-mechanization
                                   Figure 2: FISH CATCH, JAMAICA, 1945-1981

                           30

                           25
 Millions of lbs of fish

                           20

                           15        A
                           10

                            5

                            0
                            1940         1950     1960      1970      1980    1990
THE HISTORY OF OVERFISHING
B = Yield increases during Mechanization
                                   Figure 2: FISH CATCH, JAMAICA, 1945-1981

                           30

                           25
 Millions of lbs of fish

                           20

                           15        A          B
                           10

                            5

                            0
                            1940         1950       1960    1970      1980    1990
THE HISTORY OF OVERFISHING
C = Overfishing during Mechanization
                                   Figure 2: FISH CATCH, JAMAICA, 1945-1981

                           30

                           25
 Millions of lbs of fish

                           20                              C
                           15        A          B
                           10

                            5

                            0
                            1940         1950       1960    1970      1980    1990
THE HISTORY OF OVERFISHING
D = Increase, plateau with new grounds
                                   Figure 2: FISH CATCH, JAMAICA, 1945-1981

                           30

                           25
 Millions of lbs of fish

                           20                              C
                                                B                    D
                           15        A
                           10

                            5

                            0
                            1940         1950       1960    1970      1980    1990
MORE HISTORY
                                                  CATCH by YEAR           Further grounds,
                                                                          new technology
CATCH (M etric Tonnes)

                         12000.00
                         10000.00
                          8000.00
                          6000.00
                          4000.00
                          2000.00
                             0.00
                                45

                                      55

                                            57

                                                  59

                                                        62

                                                              70

                                                                    73

                                                                          97

                                                                                99

                                                                                      01

                                                                                            03

                                                                                                  05
                              19

                                     19

                                                 19

                                                       19

                                                             19

                                                                               19

                                                                                     20

                                                                                           20
                                           19

                                                                   19

                                                                         19

                                                                                                 20
                                                                   YEAR
CARICOM COUNTRIES COMPARED
Å Yield of Fish (and therefore Fishing Income $)

                                                                                MSY
                                                                             Antigua & Barbuda
                                                        British Virgin Is.
                                                                     Only one CARICOM
                                                                     country is near MSY
                                                                                           St. Vincent & Grenadines
                                                                The most underexploited    Grenada
                                                   Bahamas      CARICOM Country is Belize,
                                                                followed by The Bahamas       Barbados
                                                   Belize                                       Dominica
                                                                and the BVI.                     St. Lucia

                                                        The most overfished country is Jamaica,
                                                        followed by the rest.
                                                        Most CARICOM countries are overfished,               Jamaica
                                                        but Jamaica is by far the worst!

                                                        Fishing Pressure (and therefore Cost of Production $) Æ
Overfishing is environmentally                  But effort E2 will also
                                                       damaging and economically                       result in yield Y.
Å Yield of Fish (and therefore Fishing Income $)

                                                       inefficient. Effort E1       MSY                E1 – E2 represents
                                                       will result in yield Y.                         the inefficiency and
                                                                                                       waste inherent in
                                                                                                       overfishing.

                                                   Y

                                                                E2                                        E1
                                                                     Å      Wasted effort and money   Æ
                                                              Fishing Pressure (and therefore Cost of Production $) Æ
THE WAY FORWARD FOR JAMAICA Æ
Å Yield of Fish (and therefore Fishing Income $)

                                                                             MSY

                                                                 The model also
                                                                 provides the remedy
                                                                 for overfishing.
                                                             To increase yields, fishing
                                                             effort must be reduced.

                                                                                                           Jamaica

                                                      Fishing Pressure (and therefore Cost of Production $) Æ
MUTUAL CAUSATION
 POVERTY CAUSES
   OVERFISHING
       and
OVERFISHING CAUSES
     POVERTY
Causes of Overfishing
• Jamaica’s weak economy – very
  few other livelihood options for
  people with little capital and
  education, and few skills
• Perverse subsidies on fuel and
  fishing gear
• Increased world demand
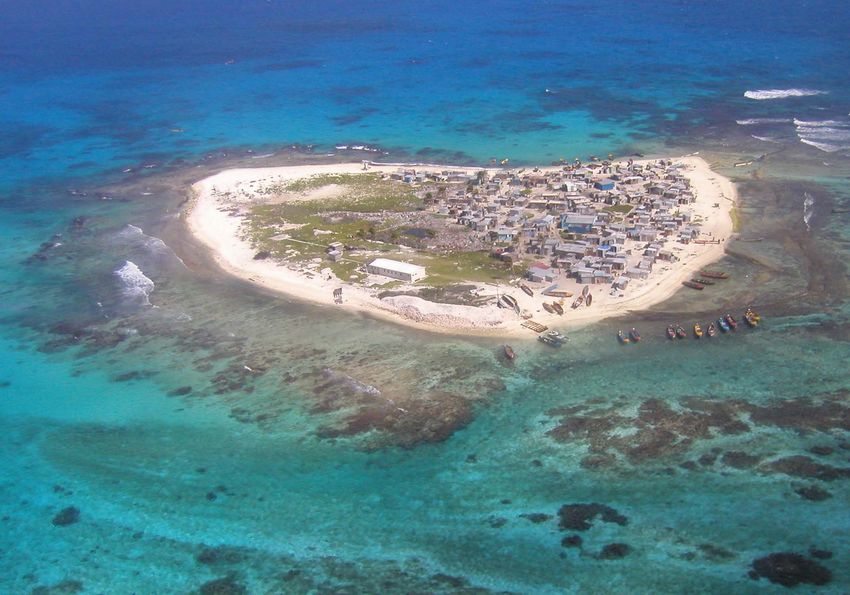
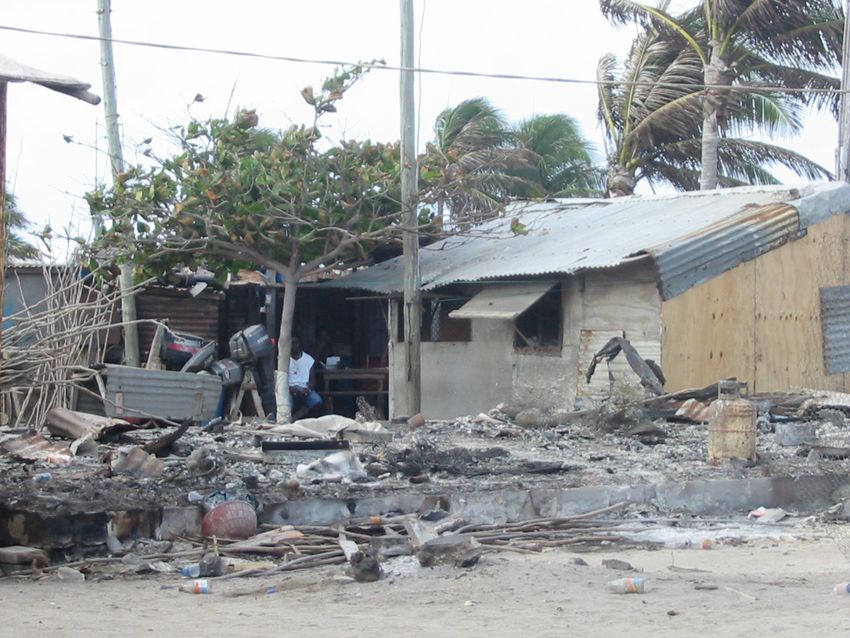
Diver Fishers
• Catching for conch and lobster export; earn more in
  one day than others earn in one month
• High risk
   – No training in SCUB or hooka diving
   – ~6 divers per year are permanently paralyzed
   – No certificatoin required by law
• And so in the name of “economic development” and
  “fisheries development” Jamaican fishers die and
  are crippled every year, just so Jamaica can earn
  foreign exchange from conch and lobster exports.
• In addition, these divers base themselves on small
  cays at the offshore banks, in quite squalid
  conditions.
Diver Fishers
• The government needs to step in to protect
  these desperately poor and mostly illiterate
  fishers from exploiting themselves, and being
  exploited by the processors and exporters.
• There is the need for the developed countries
  who purchase these products to require that
  they be harvested in conditions where the
  fishers are not exploited.
Aquaculture
• The decline in marine capture fisheries led to the
  expansion of (freshwater) aquaculture in the 1980s
  based on tilapia.
• This has used up all Jamaica’s freshwater
  resources, and has created local water shortages.
• Most of this production is exported, to earn foreign
  currency. Jamaicans have not yet developed a
  strong taste for freshwater fish.
• The sanitary waste from the tilapia is causing
  environmental water quality problems.
• Because tilapia is herbivorous no fish meal is
  required. We don’t have to catch fish to feed fish.
  However we become more dependent on imported
  grain.
FISH PRODUCTION, IMPORTS, AGGREGATE

                     45000
                     40000
M E T R IC T O N S

                     35000
                     30000                                        PRODUCTION
                     25000
                                                                  IMPORTS
                     20000
                     15000                                        AGGREGATE
                     10000
                      5000
                         0
                         86

                               88

                                     90

                                           92

                                                 94

                                                       96

                                                             98
                       19

                              19

                                    19

                                          19

                                                19

                                                      19

                                                            19

                                               YEAR
PROPORTION OF FISH CONSUMPTION THAT IS
                                  IMPORTED

                80.00%
P E RCE NTAGE

                60.00%

                40.00%

                20.00%

                0.00%
                         86
                              87
                                   88
                                        89
                                             90
                                                  91
                                                       92
                                                            93
                                                                 94
                                                                      95
                                                                           96
                                                                                97
                                                                                     98
                                                                                          99
                    19
                          19
                               19
                                    19
                                         19
                                              19
                                                   19
                                                        19
                                                             19
                                                                  19
                                                                       19
                                                                            19
                                                                                 19
                                                                                      19
                                                        YEAR
Local Demand for Fish
• Local demand for fish is twice
  the yield from the capture
  fishery and farmed fishery
  combined
• Jamaica is a net fish importer
• Thus, Jamaica is part of the
  increasing international demand
  for fish
FISH IS AN IMPORTANT SOURCE
        OF PROTEIN IN JAMAICA
                         FISH vs TOTAL ANIMAL PROTEIN

                250000
METRIC TONNES

                200000
                                                    AGGREGATE FISH
                150000

                100000                              TOTAL ANIMAL
                                                    PROTEIN
                50000

                    0
                      86

                      88

                      90

                      92

                      94

                      96

                      98
                   19

                   19

                   19

                   19

                   19

                   19

                   19

                                YEAR
P E RCE NTAGE

                 0
                     5
                         10
                              15
                                   20
                                        25
       19
            86
       19
            87
       19
            88
       19
            89
       19
            90
       19
            91
       19
            92
       19
            93

YEAR
       19
            94
       19
            95
       19
            96
       19
                                             PROPORTION OF FISH IN PROTEIN DIET

            97
       19
            98
       19
            99
SOURCES OF FISH PROTEIN
•   Fresh fish
•   Frozen fish (e.g. bangamary)
•   Dried salted fish (e.g. cod)
•   Pickled fish (e.g. herring, mackerel)
•   Tinned fish (e.g. sardines,
    mackerel, herring)
Fresh Fish Not Consumed by Poor
• Even if Jamaica could supply fresh all its fish
  protein needs, there would still be demand for
  other forms
• No refrigeration among the poor means fresh
  fish and frozen fish can not be stored
  – Tinned, salted, and pickled fish remain important
• An important strategy employed by the poor is to
  buy food in small quantities, meal by meal
  – Thus, they would not choose to store food
Conclusions
• Jamaica is integrated into the global
  market for fish and fish products, both
  as buyer and producer.
• Jamaica is affected by the increased
  global demand for fish & fish products,
  both positively and negatively.
• It is within Jamaica’s power to regulate
  her fishing industry to improve natural
  resource management as well as
  working conditions.
Conclusions
• There is political and social space
  for government, NGOs and the
  private sector to each play an
  important part.
• At the same time the international
  community can set standards
  below which no country in good
  standing would be allowed to fall.
You can also read