Presentation of the Gorenje Group - SEOnet
←
→
Page content transcription
If your browser does not render page correctly, please read the page content below
Presentation of
    the Gorenje
    Group

1   www.gorenjegroup.com
One of Leading European
             Manufacturers of Products for Home

                        CORE BUSINESS
                                                                       R&D COMPETENCE
                          Products and
                                                                           CENTRES
                        services for home
                                                                           Slovenia
                           (MDA, SDA)
                                                                        Czech Republic
                                                                            Sweden
                                                                          Netherlands

                 NUMBER OF                             Gorenje                         OWN
                 EMPLOYEES                                                        PRODUCTION
                   11,000
                                                        Group                        Slovenia
                                                                                      Serbia
                                                                                  Czech Republic
                  CONSOLIDATED
                    REVENUE
                  EUR 1.258 billion
                                                                         GLOBAL
                                            EXPORT                    PRESENCE
                                              95%                     90 Countries
                                            of sales                   Worldwide,
    MDA (major domestic appliances)
                                                                 mostly in Europe (91%),
    SDA (small domestic appliances)
                                                                 also in USA, Australia,
                                                                   Near and Far East
2            www.gorenjegroup.com
More than 65 Years of Tradition
                                                                                                      1991
                                                                                              Slovenia becomes
      1950                                         1964                      1971            independent, loss of
Founded in the                             Production in Velenje,   First sales subsidiary    the former domestic
village Gorenje                               New plant for            abroad (Munich)               market
                                           cooking appliances

                                   1961-1970
                                  Production of
                               washing machines
                 1960           and refrigerators
            Production in
            Velenje begins
                                                                         1961-1970                1991-1996
                                                                       Acquisitions of        Strong expansion
                                                                     companies bringing            abroad
                                                                     synergies to the core
                                                                    Business “Everything
                                                                         for Home“

                                1961                                    Setting-up own
                            First export                             distribution network
         1958
                            (to Western                               in Western Europe
     Manufacturing
                             Germany)
       of stoves

3                 www.gorenjegroup.com
Fast Development in the Last Decade
                                                                                                                 2015-2016
                                                                                                                   2015
                                                                                            2013           The first year of new
                                                                                         Strategic          2016-2020 Strategy
                                          2006
         1998                                                                          Alliance with          execution: key
                                   New refrigerator                 2010
    Gorenje, d.d.,                                                                       Panasonic              objectives
                                    & freezer plant            Acquisition of the
      becomes a                                                                       Listing on WSE          accomplished
                                       in Valjevo,              company ASKO,
public company, listed
                                         Serbia                    Sweden
        on the
   Ljubljana Stock
      Exchange

                                                                                                            2014
                                                                                       2012          Positive effects of
                                                                                Restructuring          restructuring
                                                                                 of production
    (…)                                                                       facilities and sales
                                                                             organization begins,
                                               2008                          disposal of furniture
                                         Acquisition of the                     manufacturing
                                          company ATAG,                             business
             2005                         the Netherlands             2010
        Acquisition of                                         IFC, a member of
      the Czech cooking                                         the World Bank,
          appliances                                          enters the ownership
   manufacturer Mora Moravia                                        structure
    4             www.gorenjegroup.com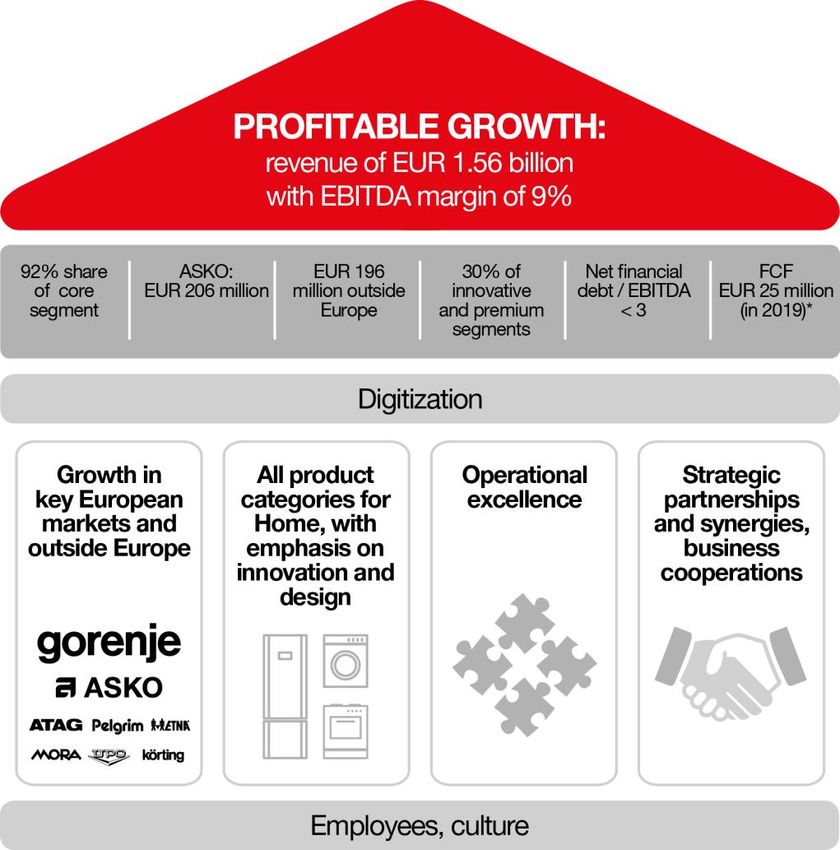
Ownership Structure
                More than 60% of foreign shareholders

Ownership structure as at 31 March 2017
                                                                                                              No. of shares
                                                                  Ten major shareholders                                      Share in %
                                       Treasury                                                               (31 Mar 2017)
              Employees                 shares                    KAPITALSKA DRUŽBA, D.D.                         3,998,653      16.37%
               2.84%                    0.50%                     INTERNATIONAL FINANCE CORPORATION               2,881,896      11.80%
Individuals                                        Kapitalska     PANASONIC CORPORATION                           2,623,664      10.74%
  11.27%                                          družba, d. d.   KDPW – Fiduciary account                        1,889,632       7.74%
                                                    16.37%        HOME PRODUCTS EUROPE B,V.                       1,221,231       5.00%
                                                                  RAIFFEISEN BANK AUSTRIA D.D. - Fiduciary
                                                                                                                  1,125,573       4.61%
                                                                  account
                                                      IFC         ZAGREBAČKA BANKA D.D. - Fiduciary account         881,667       3.61%
                                                    11.80%        BNP PARIBAS SECURITIES SERVICES S.C.A.            825,379       3.38%
    Other
  financial                                                       Alpen.SI, mixed flexible sub-fund                 713,208       2.92%
 investors                                      Panasonic         AUERBACH GRAYSON & COMPANY LLC                    647,165       2.65%
  38.74%                                          10.74%          Total major shareholders                     16,808,068        68.82%
                                           KDPW -
                                           Fiduciary              Other shareholders                             7,616,545       31.18%
                                           account
                                            7.74%                 Total                                        24,424,613         100%

 5              www.gorenjegroup.com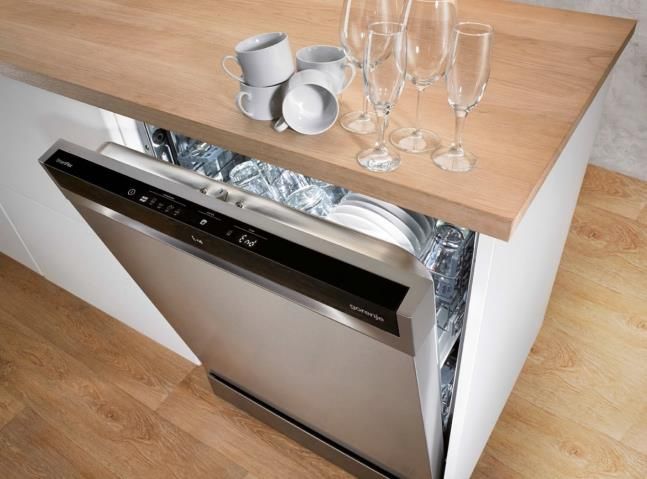
Business Activities
Revenue 2016
~87% ~13%
CORE BUSINESS NON-CORE
Products and
services for Ecology
Home: •
Tool making
•
MDA Engineering
• •
SDA Hotel and catering
•
Trade
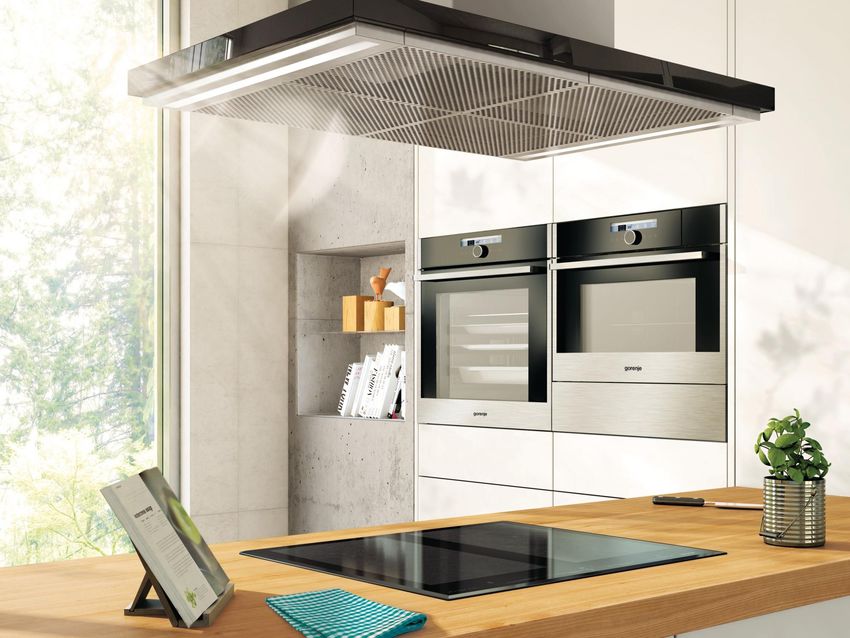
6 www.gorenjegroup.com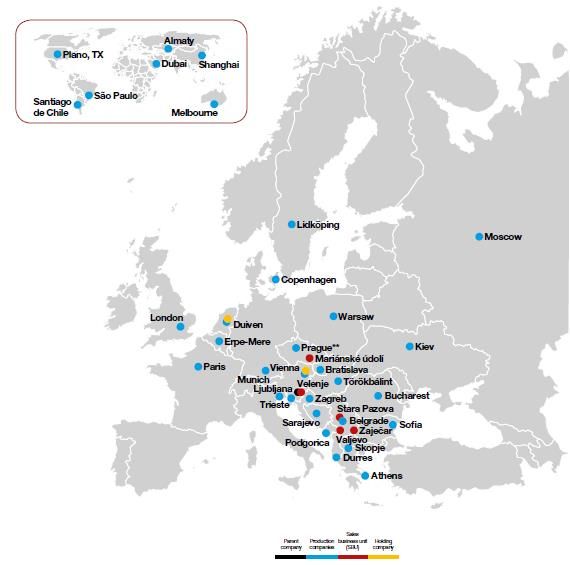
Gorenje Group Brand Portfolio

    Implementing a multi-brand strategy with attention on the upper-mid and premium
    price segment.

7         www.gorenjegroup.com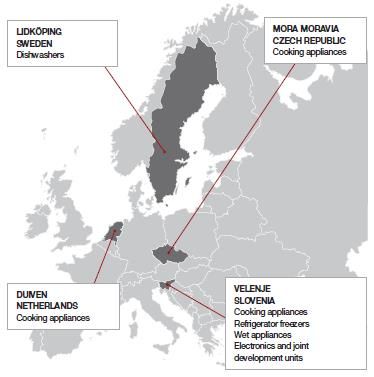
Most Important Markets:
    Germany, Russia and the Netherlands
    GERMANY
    RUSSIA
    THE NETHERLANDS
    SCANDINAVIA
    SERBIA
    CZECH REPUBLIC
    CROATIA
    SLOVENIA
    AUSTRALIJA
    USA

    BIH
    HUNGARY
    AUSTRIA
    POLAND
    BELGIUM
    RUMANIA
    SLOVAKIA
    BULGARIA
    GREAT BRITAIN
    FRANCE
    MONTENEGRO
    UKRAINE

8   www.gorenjegroup.com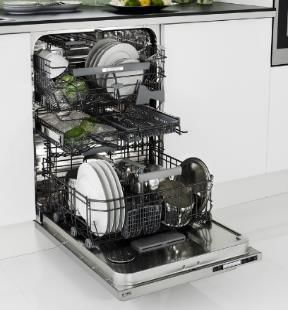
R&D Competence Centres
                                       Mariánské údolí
    Firm Foundations for
    Future Development of
    the Gorenje Group

    Cooperation with international
    institutions, knowledge and
    excellence centres.

9               www.gorenjegroup.com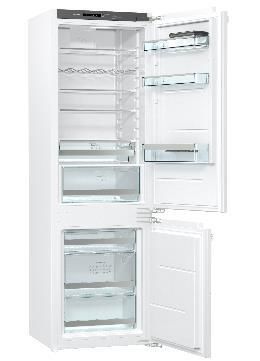
Production Facilities for MDA in 3
             Countries

Slovenia,   Velenje
High value-added products – cooking
appliances, dishwashers, and
advanced washing machines and
dryers and niche refrigerators                    12%

Czech Republic,       Mariánské údolí     61%
Freestanding cookers

Serbia, Valjevo, Stara Pazova, Zaječar
Refrigerators and freezers, water                 27%
heaters, and lower segment washing
machines and dryers

10           www.gorenjegroup.com
Gorenje Group Macro-organization and
Locations
Thoughtfully constructed sales network,
which will be expanding outside Europe.
CURRENT MACRO ORGANIZATION (HOME)*
PARENT COMPANY Gorenje, d.d.
HOLDING COMPANIES 2
SALES BUSINESS UNITS 40 (incl.representative offices)
PRODUCTION COMPANIES 6
11 www.gorenjegroup.comKey categories of the Strategic Plan 2016-2020 www.gorenjegroup.com
Strategic Pillars 2020

                                < 2.5

13       www.gorenjegroup.com
CORPORATE GOALS OF GORENJE GROUP 2020
Revenue of EUR 1.562bn by 2020; increase of revenue by over
35% (CAGR of 2020 / 2015: + 6.2%).
Corporate goal 2020: REVENUE OF EUR 1.56 BILLION
Gorenje Group net sales revenue (excluding divested Ecology) in EUR
billion
1,562
1,600 1,462
1,369
1,400 1,285
1,175 1,155 1,194
1,200
1,000
800
600
400
200
0
2014 2015 SP2016 SP2017 SP2018 SP2019 SP2020
14 www.gorenjegroup.comCORPORATE GOALS OF GORENJE GROUP 2020
Doubled revenue of EUR 196m generated outside Europe; 14% of
total Home segment sales.
Corporate goal 2020: REVENUE OF EUR 196 MILLION
GENERATED OUTSIDE EUROPE
Revenue from sales outside Europe (EUR million)
196.0
173.4
153.7
143.9
121.4
107.2 111.0
2014 2015 SP2016 SP2017 SP2018 SP2019 SP2020
15 www.gorenjegroup.comCORPORATE GOALS OF GORENJE GROUP 2020
Increase in sales of the Asko premium brand
Corporate goal 2020: ASKO REVENUE OF EUR 206 MILLION
Net revenue from Asko sales (EUR million) and share in total core
activity (Home) sales, in %
14.3%
12.9% 14%
12.1%
250 11.1% 12%
10.1% 205.6
9.0% 9.5% 10%
200 173.2
152.1 8%
150 130.9 6%
109.7
96.6 99.1
100 4%
2%
50
0%
0 -2%
2014 2015 SP2016 SP2017 SP2018 SP2019 SP2020
16 www.gorenjegroup.comGlobal premium brand
Main markets: USA, Australia, Scandinavia,
Russia, Asia (selected markets)
Short-term: extend product portfolio and
strengthen position on key markets
Mid-term: expand to new markets
www.gorenjegroup.comUnaudited Financial Statements 2016 www.gorenjegroup.com
2016 highlights
Year of revenue and profit growth
EUR 1,258.1m of revenue was generated, which is 2.7% more than in
2015. The level of Gorenje Group‘s comparable targeted revenue was
fully implemented.
The Core activity Home generated EUR 1,091.7m of revenue or 3.4%
more than in 2015 and 1.1% less than planned.
The Core activity Home records a 4.7 percent organic growth in
revenue (by eliminating the impact of currency fluctuations)
Gorenje Group recorded positive results in all quarters of 2016 and
generated profit in the amount of EUR 8.4m.
The targeted profit was exceeded by EUR 0.7m and profitability
improved by EUR 16.4m.
19 www.gorenjegroup.com2016 highlights
A year of improved sales structure
Sales growth by the Core activity Home (EUR +35.7m / +3.4%)
Favourable geographical sales structure:
CIS (+ 12.3%)
Eastern Europe (+ 4.3%)
Benelux (+ 4.0%)
Growth was recorded also on markets of Australia, America and Asia
Favourable brand structure:
Asko (+9.0%)
Atag/Pelgrim/Etna (+ 4.3%)
20 www.gorenjegroup.com2016 highlights
A year of improved product sales structure
2016 was marked by successful operations of the Core activity
Home, which is attributable to:
achieved favourable product sales structure; enhanced sales on
following segments:
premium appliances (4.3% growth in terms of quantity and
27.3% share in the revenue structure of MDA);
innovative appliances (14.5% growth in terms of quantity and
17.4% share in the revenue structure of MDA);
cooking appliances (+4.6% growth in terms of quantity);
dishwashers (+19.7% growth in terms of quantity);
small household appliances (+32.4% growth in revenue).
21 www.gorenjegroup.com2016 highlights
A year of cost efficiency and savings
Efficient management of costs of material and raw materials as a result of:
renegotiations with suppliers,
prior favourable lease of certain strategic raw materials (e.g. sheet
metal, plastics, etc.),
by optimising the usage of material in direct production,
by optimising the supply chain.
Good management of the logistics costs:
activities are directed towards optimising the logistics lines, developing
new logistics models, contractual lowering of transport prices,
costs of logistics declined by 1.5%, while revenue increased by +2.7%
Employee benefits expense:
Growth in employee benefits expense lags behind the growth in
Group‘s revenue by 1 p.p.
22 www.gorenjegroup.com2016 highlights
A year of targeted investments into
marketing and development
Sales growth is supported by larger investments in marketing and
development (EUR + 7.1m relative to 2015):
Investments in development were recorded at EUR 32.3m (2.6%
share in Group‘s revenue; higher expenses by 0.18 p.p. or EUR 3.1m).
Marketing-related investments amounted to EUR 26.4m (2.1% share
in Group‘s revenue; increase of 0.27 p.p. or EUR 4.0m).
23 www.gorenjegroup.com2016 highlights
A year of solid financial management
Gorenje Group‘s EBITDA was essentially improved
EUR 87.2m (EUR +7.1m with respect to 2015;
The impact of finance costs on Gorenje Group‘s profit was lowered:
The average costs of financing were reduced – interest expenses
declined by EUR 3.0m or by 16.5%
The result in exchange differences is significantely more favorable by
EUR 12.4m and is disclosed at EUR -0.5m.
Gorenje Group‘s relative indebtedness was reduced
The net financial debt/EBITDA ratio was improved from 4.1 in 2015 to 3.9
in 2016 (or by 0.2 over the 2015 balance).
The liquidity reserve was increased to EUR 120.4m (approved borrowings and
bank balances).
24 www.gorenjegroup.com2016 highlights
Higher sales volume in all segments
Revenue growth was recorded in all quarters of 2016 if compared to 2015
The targeted comparable level of revenue was fully achieved (comparable
budgeted revenue amounted to 1,257.7 MEUR)
2016: EUR 1,258.1m
Gorenje Group‘s revenue 2015: EUR 1,225.0m
400
350
350 357
300 317 320
290 296
285
250 268
200
150
100
50
0
Q1 Q2 Q3 Q4
25 www.gorenjegroup.com
2015 20162016 highlights
Revenue growth by Core activity Home
Revenue growth is recorded in all quarters of 2016 if compared to 2015
Revenue growth in Core activity Home 3.4% (+35,7 MEUR)
Core activity Home‘s revenue 2016: EUR 1,091.7m
350 2015: EUR 1,056.0m
300
300 309
283 283
250
249 257
243
200 224
150
100
50
0
Q1 Q2 Q3 Q4
26 www.gorenjegroup.com 2015 20162016 highlights
Stable generating of profit
The planned profit for 2016 was exceeded (P2016 =EUR 7.7m).
Improvement of EUR 16.4m relative to 2015;
Gorenje Group‘s profit 2016: EUR 8.4m
2015: EUR -8.0m
6.0
4.0
4.3
2.0
2.0
0.6 1.5 1.4
0.0
Q1 Q2 Q3 Q4
-2.1
-2.0 -2.5
-4.0 -4.8
2015 2016
27
-6.0 www.gorenjegroup.com2016: Key financial indicators
(Budget inclusive of the companies of the Ecology segment)
Plan
Plan
EURm 2015 2016 Index 2016 (incl.
track
Ecology)
Revenue 1,225.0 1,258.1 102.7 1,257.7 100.0
EBITDA 80.1 87.2 108.9 89.1 98.0
EBITDA Margin (%) 6.5% 6.9% / 7.1% /
EBIT 34.4 40.2 116.7 39.8 100.9
EBIT margin (%) 2.8% 3.2% / 3.2% /
Profit before taxes -4.0 13.2 / 11.6 114.6
Profit or loss for the period -8.0 8.4 / 7.7 110.1
ROS (%) -0.7% 0.7% / 0.6% /
The published business plan 2016 is exclusive of the companies of the Ecology segment,
which were during the preparation of the 2016 Business Plan subject to divestment
(Gorenje Surovina d. o. o., Maribor, Kemis-BH, d.o.o., BiH, Kemis Valjevo d. o. o., Serbia,
28 www.gorenjegroup.com Cleaning System S, d. o. o., Serbia, PUBLICUS, d. o. o., Ljubljana, EKOGOR, d. o. o.,
Jesenice).2016: Key financial indicators
(Budget inclusive of the companies of the Ecology segment)
Plan
EURm 2015 2016 Index 2016 (incl.
Ecology)
Gross financial debt 362.0 376.8 104.1 345.9
Net financial debt 330.4 341.6 103.4 331.2
Net financial debt / EBITDA 4.1 3.9 / 3.7
Gross debt: EUR 376.8m (EUR +14.8m).
Net financial debt: EUR 341.6m (EUR +11.2m).
Net financial debt / EBITDA ratio: 3.9 (0.2 better than last year).
29 www.gorenjegroup.com2016: Markets of the Core activity Home
By increasing the sales we improve our sales structure (increasing the share of
premium appliances, premium brands).
Favourable sales structure of brands, where we have increased primarily the sale
of brands Asko (+9.0% growth; 10.1% in sales structure (+0,5 p.p. relative to
2015).
As for sales of small household appliances, the sales recorded a 32.4 percent
growth in revenue.
Change
EURm 2015 % 2016 % (%)
Western Europe 452.7 42.9 455.8 41.8 +0.7%
Eastern Europe 492.8 46.7 524.3 48.0 +6.4%
Other 110.5 10.4 111.6 10.2 +1.0%
Total Home 1.056.0 100.0 1.091.7 100.0 +3.4%
30 www.gorenjegroup.com2016: Markets of the Core activity Home
Sales growth in Eastern Europe: the Czech Republic, Slovenia,
Hungary, Slovakia, Poland, Romania, Bulgaria, Croatia, Albania,
Montenegro and Macedonia. A significant growth was achieved also on
the markets of Russia (by 7%) and Ukraine (by more than 40%) and
thereby strengthened the market position.
Sales growth in Western Europe: Benelux, (mostly in the
Netherlands), Germany. Lower sales: Scandinavia and France (Gorenje
brand).
Increase in sales on the markets outside of Europe (+1%):
Sales was impacted by the decline in the off-take of industrial partners
(new growth is planned in 2017) and lower sales on the markets of
Near and Far East (primarily in Saudi Arabia).
Essential growth: Northern America, Caucasus, Asia, Brazil and
Australia.
Higher sales of the Asko brand products were achieved on the
markets of Scandinavia, France, America, Russia, Asia and Australia.
31 www.gorenjegroup.com2016: Working Capital
Investments in net working capital
31 Dec 31 Dec 31 Dec 31 Dec 31 Dec
EURm
2012 2013 2014 2015 2016
+ Inventories 253.7 236.4 219.8 225.9 225.9
+ Trade receivables 224.1 208.6 182.6 161.0 165.8
+ Other current assets 53.1 51.3 48.9 52.2 58.8
- Trade payables -216.3 -214.0 -202.6 -221.0 -223.7
- Other current liabilities -78.9 -74.8 -73.6 -75.8 -81.9
= Net working capital 235.7 207.5 175.1 142.3 144.9
Movement of net working capital in the 2012-2016 period (EURm)
260.0
18.3% Net current assets (EURm) 20.0%
240.0 16.6% Share of net current assets in revenue (%) 18.0%
220.0
200.0 14.0% 16.0%
14.0%
180.0
160.0
11.6% 11.5%
12.0%
140.0
10.0%
120.0
235.7
100.0 207.5 8.0%
80.0 175.1 6.0%
60.0
142.3 144.9
4.0%
40.0
2.0%
20.0
0.0 0.0%
31.12.2012 31.12.2013 31.12.2014 31.12.2015 31.12.2016
32 www.gorenjegroup.com Net working capital = inventories + trade receivables +other current assets –
trade payables – other current liabilities2016: Investment activities
• The planned CAPEX for 2016 is EUR 85.0m, and achieved CAPEX for
2016 represents 97.9% of the FY2016 plan.
90.0 10.0%
80.0 9.0%
8.0%
70.0
7.0%
60.0
6.0%
50.0
mEUR
5.0%
40.0
4.0%
30.0
3.0%
20.0
2.0%
10.0 1.0%
0.0 0.0%
Q1 Q2 Q3 Q4 Q1 Q2 Q3 Q4
2015 2016
2015 2015 2015 2015 2016 2016 2016 2016
Home 7.7 18.5 13.3 27.7 67.2 10.2 17.4 20.7 29.4 77.7
Non-core activities 1.6 2.3 1.9 2.5 8.3 1.5 1.0 1.2 1.8 5.5
CAPEX Margin, % 3.5% 7.2% 4.8% 8.6% 6.2% 4.1% 6.2% 6.9% 8.7% 6.6%
Total 9.3 20.8 15.2 30.2 75.5 11.7 18.4 21.9 31.2 83.2
33 www.gorenjegroup.com2016: Investment by types
Investment (CAPEX) of the Gorenje Group, by types:
EURm 2016
New product development 40.0
R&D investment 19.3
Improvement of competitiveness 15.7
Investment into network sales activities 2.7
Investment in non-core activities 5.5
TOTAL INVESTMENT 83.2
• Replacement investment is represented by the items investment into (new product)
development and improvement of competitiveness (investment maintenance of
tools, replacement of obsolete equipment, increased automation, acquisition of new
technological equipment for improvement of productivity (replacement CAPEX); they
amount to EUR 35 to 45 million annually.
• Investment into new product development technology is, as a rule, proportionate to the
share of production volume at a particular production plant.
34 www.gorenjegroup.com2016: Development and new Products
Pursuant to the Group's strategic
goal, we have increased
investments in product
development to 2.6% in the Group’s
revenue structure (0.18 p.p. more
than in 2015).
Key innovations:
the upgraded built-in under-
counter refrigerators (600 mm),
the 10 kg washing machine for
the strategic industrial partner,
Asko Craft premium built-in
ovens programme,
the new programme of mid-price
range dishwashers.
35 www.gorenjegroup.com2016: Financial performance
Movement of total and net financial liabilities in the 2012-2016 period (EURm), movement of the
relative borrowing rate or the net financial debt/EBIDTA ratio, and the maturity structure of
financial liabilities
500.0 4.6 5
450.0 4.2 4.1 4.5
100%
3.8 3.9
400.0 4 90%
26.5% 25.1% 26.9%
80% 36.0%
350.0
378.3 3.5
50.0%
357.9 341.6 70%
300.0
331.5 330.4 3
60%
250.0 2.5
432.9 50%
200.0
397.4 367.6 376.8
2
362.0 40%
74.9%
73.5% 73.1%
150.0 1.5
30% 64.0%
100.0 1
20%
50.0%
50.0 0.5 10%
0.0 0 0%
31.12.2012 31/12/2013 31/12/2014 31/12/2015 31/12/2016 31.12.2012 31/12/2013 31/12/2014 31/12/2015 31/12/2016
Total financial liabilities Net financial liabilities Current financial liabilities
Net financial liabilities/EBITDA Non-current financial liabilities
• Stable maturity profile of financing sources (around 3/4 of long-term sources)
• Trend in decrease of financial debt and relative deleveraging
36 www.gorenjegroup.com2016: Settlement of financial liabilities
Annual repayment of the current portion of long-term debt (as at Dec 31, 2016)
Year 2017 2018 2019 2020 2021 2022
Repayment of
long-term 93.6 78.5 90.6 40.3 39.0 21.9
liabilities
• Average maturity of Gorenje Group's financial sources is ~3 years.
• Long-term sources are hedged against a change in interest rate or. are
negotiated with a fixed interest rate (~70% of financial borrowings as at
December 31, 2016).
• Issue of 5-year bond with bullet repayment and debt refinancing activities
with commercial banks will significantly extend the average maturity of
financial sources.
• Short-term sources are currently renewed, and new lines are added in order
to increase the liquidity reserve and to optimize interest expense.
37 www.gorenjegroup.com2016: Balance Sheet
The growth in business activities, maintain the level of net working capital – Inventory
turnover is shorter by 2 days (~69 days turnover of receivables by 3 days (~47 days), turnover
of liabilities was 4 days more (~85 days).
We maintain a stable maturity structure of financial liabilities.
By investing in new product development, we increase the value of net non-current assets.
31 Dec 31 Dec 31 Dec 31 Dec
EURm EURm
2015 2016 2015 2016
Net non-current
assets
535,3 552,6 Equity 368,1 374,2
Non-current financial
Inventories 225,9 225,9 liabilities
271,0 275,6
Trade receivables 161,0 165,8 Current financial liabilities 91,0 101,2
Trade payables -221,0 -223,7 Cash and cash equivalents -31,6 -35,2
Other current assets /
liabilities
-23,6 -23,1 Net debt capital 309,5 323,3
Net working capital 142,3 144,9 Financial investments -20,9 -18,3
NET INVESTED
NET ASSETS 677,6 697,5 CAPITAL
677,6 697,5
38 www.gorenjegroup.comExecutive Summary of Gorenje Group 2017 Business Plan www.gorenjegroup.com
Business Plan 2017
     •   Key categories (EBITDA, EBIT, profit) are consistent with the
         strategic goals of the 2nd year of the 2016–2020 Strategic Plan.
     •   Further growth of sales revenue planned for:
         •      Gorenje Group (+4.5%)
         •      Home segment (+5.0%)
     •   Improvement of Gorenje Group profitability:
         •      EBITDA: EUR 97.1 million (+11.3%)
         •      EBIT: EUR 39.7 million (-1.2%)
         •      Profit: EUR 13.1 million (+54.9%)
     •   Managing procurement price risk and currency risk, and the
         improvement projects at all levels of business.
     •   Further working capital optimization and positive cash flow.
     •   Further relative deleveraging at the Group level (net financial debt to
         EBITDA ratio of 3.5).
40        www.gorenjegroup.com
Business Plan 2017
Plan
EUR million 2016 Index
2017
Consolidated revenue 1,258.1 1,315.3 104.5
EBITDA 87.2 97.1 111.3
EBITDA Margin (%) 6.9% 7.4% /
EBIT 40.2 39.7 98.8
EBIT Margin (%) 3.2% 3.0% /
Profit before taxes 13.2 19.5 147.0
Profit or loss for the period 8.4 13.1 154.9
ROS (%) 0.7% 1.0% /
Net debt / EBITDA 3.9 3.5 /
41 www.gorenjegroup.comBusiness Plan 2017
Solid sales structure by territories and
products
• Revenue growth and profitability shall be based on:
• Improved geographical structure of sales: further growth in the markets
of Benelux, Eastern Europe, and CIS;
• improved sales structure by brands: increase of sales under the Asko
and Atag brands
• Improved sales structure in terms of products: growth of sales for
products with higher value added
As a result:
• further growth of share of innovative and premium products
• higher average sales prices
• improved utilization of production capacities
• To support the growth of sales in the premium and innovative segment,
we are stepping up our investment into marketing and
development.
42 www.gorenjegroup.comBusiness Plan 2017
Own brand portfolio for all market segments
MDA structure: Own brands MDA structure: Own brands
(2017 plan; volume terms) (2017 plan; value terms)
2.5% 0.7%
2.2% 1.8% 0.4%
0.1%
5.4% 0.1%
3.0%
4.4%
4.2%
5.4% 3.5%
6.8%
12.6%
75.1%
3.8% 68.3%
Gorenje Mora Asko Etna Pelgrim Atag Upo Körting Sidex
43 www.gorenjegroup.comBusiness Plan 2017
Targeted investment into new product
Development (1/2)
New product development and launch
• Consistently with the strategic
policies, we support sales growth with
targeted investment into new
product development; 2.7% of
Gorenje Group revenue to be
allocated to investments into
development.
• New launches in all product
categories.
• Innovative functions, simplicity, user-
friendly controls.
• New platforms for high-end
appliances under the Asko brand.
44 www.gorenjegroup.comBusiness Plan 2017
Targeted investment into new product
Development (2/2)
• New premium dishwasher platform
and additional dishwasher models in
the mid-price segment.
• Development of a platform for
connectible appliances.
• New generation of free standing
cookers and gas hobs.
• New generation of built-in
refrigerators.
• New collections and products of
small domestic appliances.
45 www.gorenjegroup.comBusiness Plan 2017
Stable financial structure
• Further relative deleveraging planned
100% (net financial debt to EBITDA ratio at 3.5)
90%
80%
• We maintain a stable maturity profile of
our financial liabilities (approximately 75%
70% of long-term sources), and the average
74.9% 73.1% 74.1% maturity of our debt.
60%
50%
• Dynamics of required refinancing for
40% maturing/current portions of long-term
30%
borrowings (approximately EUR 90 million
per year) consistent with cash flow
20% generation within each year, and high
25.1% 26.9% 24.9% liquidity reserve, alleviate our refinancing
10%
risk.
0%
2015 2016 Plan 2017
• Refinancing in order to further cut average
Long-term financial liabilities
finance expenses
Short-term financial liabilities
46 www.gorenjegroup.comBusiness Plan 2017
Relative deleveraging
Relative deleveraging (net financial debt to EBITDA ratio)
• Including with better net working capital management (inventory optimization,
receivables management, reverse factoring for suppliers, extension of payment
terms).
260.0 20.0% 500 5.0
18.3% 4.6
240.0 18.0% 4.2 4.5
16.6% 4.1
3.8 3.9
220.0 16.0% 400 4.0
14.0% 3.5
200.0 14.0% 3.5
11.6% 11.5%
180.0 12.0% 300 3.0
10.4%
160.0 10.0% 2.5
235.7 432.9
140.0 8.0% 200 397.4 2.0
207.5 367.6 362 376.8 371
120.0 6.0% 1.5
175.1
100.0 142.3 144.9 137.2 4.0% 100 1.0
80.0 2.0% 0.5
60.0 0.0% 0 0.0
31.12.2012 31.12.2013 31.12.2014 31.12.2015 31.12.2016 Plan 2017
2012 2013 2014 2015 2016 Plan
2017
Net working capital (EURm)
Share of NWC in revenue (%) Total financial liabilities (EURm)
47 www.gorenjegroup.com
Net financial liabilities / EBITDAForward-looking statements
This presentation includes forward-looking information and forecasts – i.e. statements regarding the future, rather
than the past, and regarding events within the framework and in relation to the currently effective legislation on
publicly traded companies and securities and pursuant to the Rules and Regulations of the Ljubljana and Warsaw
Stock Exchange. These statements can be identified by the words such as "expected", "anticipated", "forecast",
"intended", "planned or budgeted", "probable or likely", "strive/invest effort to", "estimated", "will", "projected", or
similar expressions. These statements include, among others, financial goals and targets of the parent company
Gorenje, d.d., and the Gorenje Group for the upcoming periods, planned or budgeted operations, and financial plans.
These statements are based on current expectations and forecasts and are subject to risk and uncertainty which may
affect the actual results which may in turn differ from the information stated herein for various reasons. Various
factors, many of which are beyond reasonable control by Gorenje, affect the operations, performance, business
strategy, and results of Gorenje. As a result of these factors, actual results, performance, or achievements of Gorenje
may differ materially from the expected results, performance, or achievements as stated in these forward-looking
statements. These factors include but are not necessarily limited to following: consumer demand and market
conditions in geographical segments or regions and in industries in which the Gorenje Group is conducting its
operating activities; effects of exchange rate fluctuations; competitive downward pressure on downstream prices;
major loss of business with a major account/customer; the possibility of late payment on the part of customers;
decrease in prices as a result of persistently harsh market conditions, in an extent much higher than currently
expected by Gorenje's Management Board; success of development of new products and their implementation in the
market; development of manufacturer's liability for the product; progress of attainment of operative and strategic goals
regarding efficiency; successful identification of opportunities for growth and mergers and acquisitions, and integration
of such opportunities into the existing operations; further volatility and aggravation of circumstances in capital
markets; progress in attainment of goals regarding structural reorganization and reorganization in purchasing. If one
or more risks or uncertainties are in fact materialized or if the said assumptions are proven wrong, actual results may
deviate materially from those stated as expected, hoped for, forecast, projected, planned, probable, estimated, or
anticipated in this announcement. Gorenje allows any update or revision of these forecasts in light of development
differing from the expected events.
48 www.gorenjegroup.comYou can also read


