LA HEALTH - Los Angeles County ...
←
→
Page content transcription
If your browser does not render page correctly, please read the page content below

LA
                                                           JULY 2018

HEALTH
                       RECENT TRENDS IN ADULT USE OF MARIJUANA
Introduction
In November 2016, California voters passed Proposition                              use pose additional challenges to effectively monitoring the
64, a statewide initiative legalizing the cultivation, sale,                        population health impacts of marijuana legalization.
and use of marijuana for adults ages 21 years and above.
                           +
                                                                                       There is substantial evidence that marijuana use increases
An earlier law, the Compassionate Use Act of 1996, had                              risk of motor vehicle crashes, that marijuana use during
legalized marijuana specifically for medicinal use with the                         pregnancy is associated with lower birthweight births, and
recommendation of a licensed physician. In 2003, the                                that initiating marijuana use during adolescence is a risk
Medical Marijuana Program Act created a voluntary state                             factor for the development of cannabis use disorder (CUD),
ID card system to identify medical marijuana users. In 2017,                        characterized by cravings for and tolerance to cannabis;
the state legislature integrated the 2016 law allowing adult                        problems at work, school or home due to cannabis use;
use of marijuana with the previous medicinal use laws                               and experiencing withdrawal symptoms within days of
through the Medicinal and Adult-Use Cannabis Regulation                             discontinuing use.2,3 It has been estimated that about
and Safety Act (MAUCRSA).1 In early 2018, adult use and                             30% of current marijuana users have symptoms of CUD.4
medicinal use marijuana businesses began opening in cities                          Also, marijuana use has long been associated with the
choosing to grant local licenses required by the state as a                         use of other substances, including alcohol, tobacco, and
precondition for state licensure. Under MAUCRSA, patients                           prescription and illicit narcotics.5
with a state medical marijuana ID card are exempt from the                             There is also evidence that marijuana is effective for the
state marijuana sales tax. Complicating matters is the fact                         treatment of chronic pain in adults, for the treatment of
that marijuana use, cultivation, and sale are still illegal under                   chemotherapy-induced nausea and vomiting among cancer
Federal law.                                                                        patients, for reducing symptoms of spasticity in patients
    Tracking the health implications of marijuana legalization                      with multiple sclerosis,2 and for reducing seizures in patients
is challenging given the evidence that marijuana use has                            with two rare forms of epilepsy.
some harmful health effects while also having specific                                  To assess recent trends and establish a baseline
medicinal uses. Federal restrictions on marijuana research to                       understanding of marijuana use among adult residents in
better understand the health and therapeutic effects of its                         Los Angeles County prior to the passage of the 2016 law
+                                                                                    3. Volkow ND, Baler RD, Compton WM, and Weiss SRB. Adverse health effects
 We use the term marijuana rather than cannabis in most instances in this report,
but the two terms are used interchangeably in California legislation.                of marijuana use. N Engl J Med. 2014; 370:2219-27. https://www.nejm.org/doi/
                                                                                     full/10.1056/NEJMra1402309
1. AB-64 Cannabis: Licensure and regulation (2017-2018) https://leginfo.legisla-
ture.ca.gov/faces/billNavClient.xhtml?bill_id=201720180AB64                          4. Hasin DS, Saha TD, Kerridge BT, Goldstein RB, Chou PS, Zhang H, Jung J,
                                                                                     Pickering RP, Ruan WJ, Smith SM, Huang B, Grant BF. Prevalence of marijuana
2. National Academies of Sciences, Engineering, and Medicine. 2017. The Health       use disorders in the United States between 2001-2002 and 2012-2013. JAMA
Effects of Cannabis and Cannabinoids: Current State of Evidence and Recommen-        Psychiatry. 2015; 72 (12): 1235-1242. https://jamanetwork.com/journals/jama-
dations for Research. Washington, DC: The National Academies Press. http://na-       psychiatry/fullarticle/2464591
tionalacademies.org/hmd/Activities/PublicHealth/MarijuanaHealthEffects.aspx
                                                                                     5. National Survey on Drug Use and Health: State Estimates of Mental Health
                                                                                     and Substance Use. https://nsduhweb.rti.org/respweb/estimates.html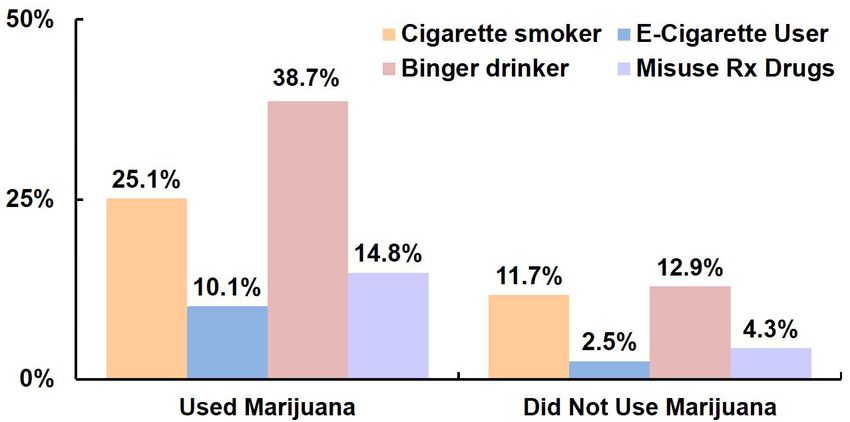
LAHEALTH

 legalizing adult use, data were analyzed from the 2005,                              • Adults ages 18-20 years (27.4%) and 21-29 years
 2011, and 2015 cycles of the Los Angeles County Health                                  (21.9%) reported using marijuana in the past year at
 Survey (LACHS). Once available, data from the 2018                                      higher rates than other age groups, while those ages
 survey will be used to assess the early impacts of the law.                             65 years and older (4.3%) reported lower use.
     In the 2011 and 2015 LACHS, respondents were                                     • Marijuana use in the past year was lower among
 asked: “In the past year, have you used any form of                                     Latinos (9.5%) and Asians (5.5%) than among whites
 marijuana, even just one time?” In the 2005 LACHS,                                      (15.2%) and African Americans (20.0%). However,
 respondents were asked: “In the past year, have you                                     these differences were influenced by country of birth, as
 smoked marijuana, even just one time?” As a point of                                    19.7% of US born Latinos and 13.2% of US born Asians
 reference, recent national and state level data consistently                            reported using marijuana in the past year (Figure 1).
 show that approximately two-thirds of past year users ages                           • Marijuana use in the past year was lower among
 18 and older have used marijuana in the past month,5 a                                  respondents in households with incomes below 100%
 widely used measure of current use. Additionally, in the                                of the federal poverty level (FPL) (8.2%) compared
 2011 and 2015 LACHS, a follow-up question was asked                                     to those in households at 100%-199% FPL (12.7%),
 of those who responded that they had used marijuana in                                  at 200%-299% FPL (10.7%) and at 300% or above
 the past year: “Do you have a medical marijuana card or a                               the FPL (13.1%). However, these findings were also
 recommendation from a doctor for medical marijuana?”                                    influenced by country of birth. For example, 19.3% of
                                                                                         US born adults in households with incomes below 100%
 Trends in Marijuana Use
                                                                                         FPL reported using marijuana in the past year, including
     • From 2005 to 2011, the percent of adults who reported
                                                                                         15.6% of Latinos, 21.9% of African Americans, and
       using marijuana in the past year remained relatively
                                                                                         23.2% of whites (data not shown).
       unchanged (8.2% and 8.5%, respectively). However,
       use increased to 11.6% in 2015 (Table 1).
     • Increases from 2011 to 2015 were found among both                               FIGURE 1: Percent  of Adults Who Reported Using
                                                                                                     Marijuana in the Past Year by Race/Ethnicity
       males and females.                                                                            and Nativity, LACHS 2015
     • From 2011 to 2015, increases were seen among all
       age groups and races/ethnicities, although some of
       these were not statistically significant# differences.
     • Also, increases were seen across all Service Planning
       Areas (SPAs).

 Characteristics of Marijuana Users
     • In 2015, 11.6% or approximately 890,000 adults
       ages 18 years and older reported using any form of
       marijuana in the past year.
     • Marijuana use in the past year was higher among                           *Data are unstable and should be interpreted with caution.
       males (15.8%) than females (7.6%).                                        Note: Data for African Americans, Native Hawaiian and other Pacific Islanders, and
                                                                                 American Indian/Alaskan Natives are suppressed due to confidentiality (cell sizes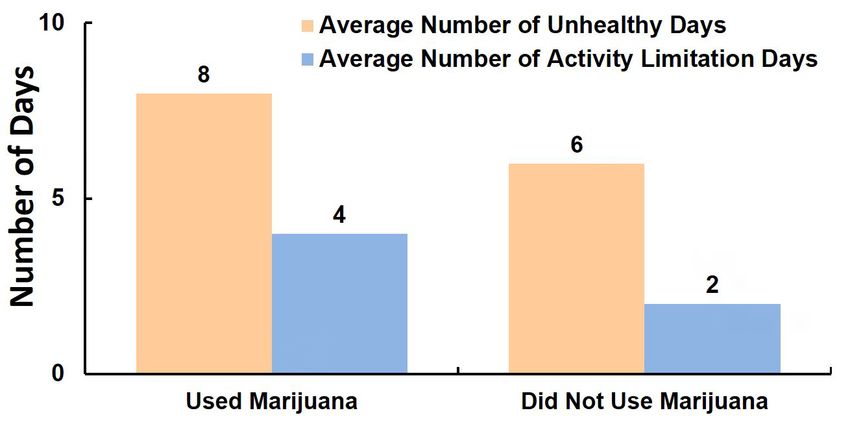
TABLE 1: Percentof Adults Who Reported Using Marijuana in the Past Year,
                 LACHS 2005-2015
                                                    2015                             2011                              2005

                                           Percent          95% CI          Percent          95% CI           Percent         95% CI

    LOS ANGELES COUNTY                          11.6% 10.5 – 12.6                  8.5%     7.6 – 9.4               8.2%      7.4 – 9.1

    GENDER

     Male                                       15.8% 14.0 – 17.5                12.3% 10.7 – 13.9                 11.7% 10.3 – 13.1

     Female                                       7.6%    6.5 – 8.6                4.9%     4.1 – 5.8               5.0%     4.0 – 5.9

    AGE GROUP

     18-20                                      27.4% 20.7 – 34.1                18.9% 13.2 – 24.6                 21.5% 15.1 – 27.9

     21-29                                      21.9% 18.4 – 25.5                14.7% 11.5 – 17.8                 14.7% 11.9 – 17.6

     30-39                                      10.2% 8.0 – 12.5                   9.4%    7.3 – 11.5               8.2% 6.5 – 10.0

     40-64                                        8.1%     7.0 – 9.3               5.9%     5.0 – 6.9               6.2%     5.3 – 7.2

     65+                                         4.3%     3.2 – 5.4                2.6%     1.5 – 3.7               1.1%*    0.3 – 1.9

    RACE/ETHNICITY◊

     Latino                                      9.5% 8.0 – 11.0                   6.9%     5.6 – 8.3               5.4%     4.4 – 6.4

     White                                      15.2% 13.3 – 17.1                 11.6% 10.0 – 13.3                11.5% 9.9 – 13.2

     African American                           20.0% 16.3 – 23.8                12.7% 9.1 – 16.2                  14.1% 10.6 – 17.7

     Asian                                       5.5%      3.2 – 7.8              4.4%*     2.4 – 6.3              4.1%*     2.0 – 6.2

    EDUCATION

     Less than high school                        5.0%    3.4 – 6.6                4.2%     2.7 – 5.6               5.3%     3.7 – 7.0

     High school                                15.8% 13.1 – 18.5                10.9% 8.4 – 13.4                   8.9%    7.0 – 10.7
     Some college or trade                      16.0% 13.7 – 18.3                  9.8%    8.1 – 11.6              10.6% 8.7 – 12.6
     school
     College or post graduate                     9.2% 8.0 – 10.5                  9.1% 7.6 – 10.6                  7.9%     6.5 – 9.2
     degree
    FEDERAL POVERTY LEVEL

     0-99% FPL                                    8.2%    6.5 – 9.8                7.2%     5.1 – 9.2               6.9%     5.2 – 8.7

     100%-199% FPL                              12.7% 10.6 – 14.8                  7.3%     5.5 – 9.1               6.9%     5.2 – 8.7

     200%-299% FPL                              10.7%     7.8 – 13.7               8.6%    6.1 – 11.0               9.0% 6.8 – 11.3

     300% or above FPL                          13.1% 11.3 – 14.8                10.0% 8.6 – 11.4                   9.4%    8.1 – 10.7

    SERVICE PLANNING AREA

     Antelope Valley                            14.2%     9.4 – 19.1               7.8% 4.4 – 11.3                  8.0% 5.8 – 10.2

     San Fernando                                11.1% 8.9 – 13.2                  9.5%    7.4 – 11.6              10.4%    8.1 – 12.6

     San Gabriel                                  7.7%    5.6 – 9.8                4.8%     3.4 – 6.2               4.5%     3.1 – 5.9

     Metro                                      15.1% 11.7 – 18.5                 11.1% 8.3 – 14.0                 12.9% 10.0 – 15.8

     West                                       15.2% 11.3 – 19.2                10.2%     7.0 – 13.3               8.6% 5.5 – 11.6

     South                                      11.9% 8.9 – 14.9                  6.9%* 3.7 – 10.0                  7.5%     5.2 – 9.9

     East                                         9.8%    7.0 – 12.7               7.1%     4.7 – 9.4               5.5%     3.6 – 7.3

     South Bay                                  13.0% 10.1 – 15.8                10.9% 8.3 – 13.6                   8.5% 6.3 – 10.7
*Data are unstable and should be interpreted with caution.
◊Data for Native Hawaiian and other Pacific Islanders and American Indian/Alaskan Natives are suppressed due to confidentiality (cell sizes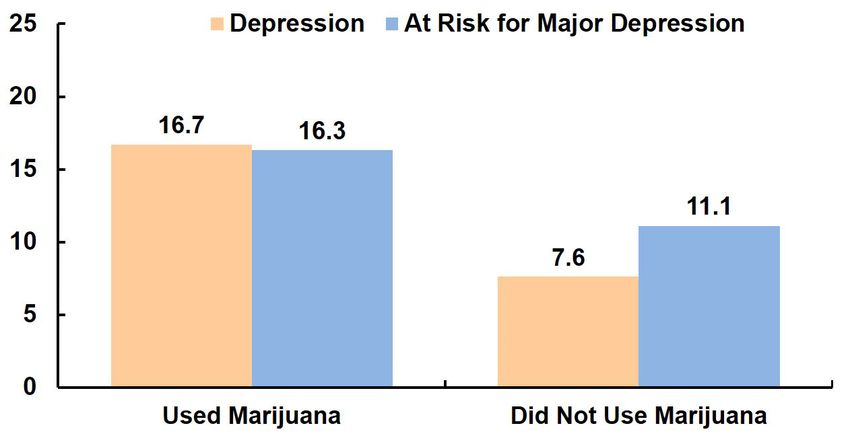
• A lower percent of respondents with less than a                             • Marijuana use in the past year among adults varied
       high school degree (5.0%) or with a college or post                           by SPA with the lowest percent in the San Gabriel SPA
       graduate degree (9.2%) reported using marijuana in                            (7.7%) and the highest percent in the Metro (15.1%) and
       the past year than respondents who were high school                           West (15.2%) SPAs.
       graduates (15.8%) or had completed some college or
       trade school (16.0%).                                                     Medical Marijuana ID Card or Doctor’s
    • The differences in marijuana use by education level                        Recommendation
       were also influenced by country of birth. For example,                      • Among adults who reported using marijuana
       among US born adults with less than a high school                             in the past year, the percent who also reported
       degree, 16.7% reported using marijuana in the past                            having a medical marijuana ID card or doctor’s
       year, including 14.3% of Latinos, 19.8%* of African                           recommendation for its use increased from 20.7% in
       Americans, and 20.5%* of whites. Those born outside                           2011 to 32.6% in 2015 (Table 2).
       the US reported much lower marijuana use across all                         • This increase was higher among males (from 18.3% to
       education levels (2.1%* among those with less than                            34.2%) than among females (from 26.1% to 29.4%).
       a high school degree, 6.2% among those who were                             • The increase was also larger among adults 65 years
       high school graduates, 6.3% among those who had                               and older than among adults in younger age groups.
       completed some college or trade school, and 4.3%                            • In 2015, among adults who reported using marijuana
       among those with a college or post graduate degree                            in the past year, the percent that also had a medical
       (data not shown).                                                             marijuana ID card or doctor’s recommendation
                                                                                     increased with age, from 23.9% among those ages
        TABLE 2: Among     Adults Who Reported Using
                   Marijuana in the Past Year, Percent Who                           18-20 years to 45.2% among those ages 65 years and
                   Reported Having a Medical Marijuana                               older.
                   ID Card or a Doctor’s Recommendation,
                   LACHS 2011 & 2015
                                                                                 Marijuana and Other Substance Use
                                    2015                          2011
                                                                                   • In 2015, adults who reported using marijuana in
                           Percent       95% CI         Percent      95% CI
                                                                                     the past year were more likely to currently smoke
    LOS ANGELES            32.6%       28.3 – 36.9       20.7%     16.3 – 25.0
    COUNTY                                                                           cigarettes (25.1%) and to have used an e-cigarette in
    GENDER                                                                           the past month (10.1%) compared to those who did
     Male                  34.2%       28.7 – 39.8       18.3%     13.2 – 23.4       not use marijuana in the past year (11.7% and 2.5%,
     Female                 29.4%      23.0 – 35.9       26.1%     18.2 – 34.0       respectively) (Figure 2).
    AGE GROUP                                                                      • Additionally, comparing those who reported using
     18-20                 23.9%        12.0 – 35.7      11.1%*     2.1 – 20.1       marijuana in the past year to those who did not,
     21-29                 26.2%        18.7 – 33.7      15.4%*     7.8 – 23.1       the former were more likely to have reported binge
     30-39                  37.2%       26.5 – 47.9      29.5%     18.4 – 40.6       drinking in the past month (38.7% vs. 12.9%) and to
     40-64                 39.2%       32.0 – 46.4       25.4%     18.2 – 32.7       have reported misusing prescription drugs in the past
     65+                   45.2%        32.8 – 57.7      15.8%*     1.2 – 30.4       year (14.8% vs. 4.3%).
  *Data are unstable and should be interpreted with caution.

*Data are unstable and should be interpreted with caution.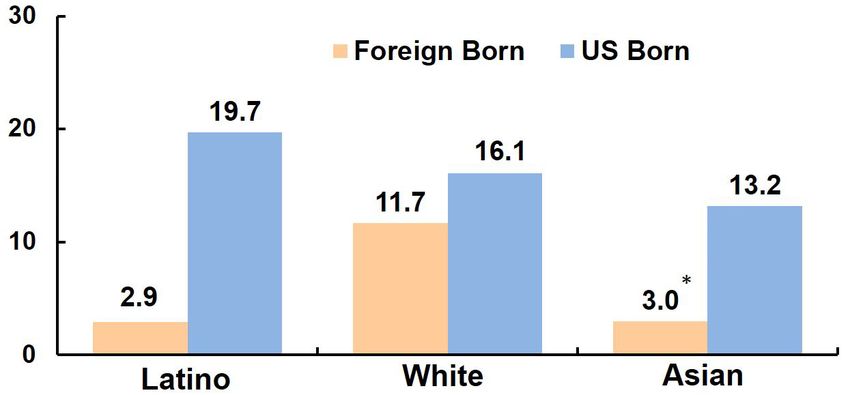
FIGURE 2: Percentof Adults Who Currently Smoke        FIGURE 3: Percent
                                                                                of Adults Who Have Depression
                  Cigarettes, Used an E-Cigarette or Binge              or Are at Risk for Major Depression,
                  Drank in the Past Month, or Misused                   by Whether or Not Reported Using
                  Prescription (Rx) Drugs in the Past Year,             Marijuana in the Past Year, LACHS 2015
                  by Whether or Not Reported Using
                  Marijuana in the Past Year, LACHS 2015

Marijuana and Health
  • Adults who reported using marijuana in the past year
    were more likely to report having depression (16.7%)
                                                               FIGURE 4: AverageNumber of Days in the Past
    and being at risk for major depression (16.3%)                       Month that Adults Reported Unhealthy
    compared to those who did not use marijuana in the                   Days and Activity Limitation Days,
                                                                         by Whether or Not Reported Using
    past year (7.6% and 11.1%, respectively) (Figure 3).
                                                                         Marijuana in the Past Year, LACHS 2015
  • Health-related quality of life was also associated with
    marijuana use as those who reported using marijuana
    in the past year also reported a higher average
    number of unhealthy days (8) and activity limitation
    days (4) in the past month compared to those who
    reported not using marijuana in the past year (6 days
    and 2 days, respectively) (Figure 4).
  • No significant differences were found between those
    with and without a medical marijuana ID card or
    doctor’s recommendation on any of these health
    conditions or health-related quality of life indicators.
Discussion
These findings indicate a recent increase in use of monitoring marijuana use in relation to the use of
of marijuana among adults in Los Angeles County, other substances. An important unanswered question is
consistent with state and national trends. Of concern is whether marijuana legalization will increase or decrease
the fact that use was highest among young adults 18 the misuse of alcohol and other substances,9 highlighting
to 20 years of age. In addition, according to the 2014- the need for continued monitoring of trends in the misuse
2015 California Healthy Kids Survey data from public of alcohol and other substances post legalization of
schools across Los Angeles County, 4.5% of 7th graders, marijuana.
12.1% of 9th graders, and 18.3% of 11th graders had Use of marijuana with a medical marijuana ID card
used marijuana in the past month.6 Not only does or a doctor’s recommendation has recently increased.
current California law prohibit the non-medicinal use of While these cross-sectional data do not allow for a
marijuana among persons under age 21, but those who determination of the cause and effect relationship
start using marijuana during adolescence are more likely between marijuana use and health indicators, marijuana
to develop CUD when they become adults. 2
use was associated with an increased prevalence of
The extremely low use of marijuana among those reported depression and a greater average number of
not born in the US is encouraging and suggests reported unhealthy and activity limitation days in the
that cultural norms may have a protective effect in past month regardless of whether users had a medical
immigrant communities. However, we cannot exclude marijuana ID card or a doctor’s recommendation.
the possibility that lower use may reflect fear of federal However, now that adult marijuana use is legal without
immigration enforcement activities, or that this fear a doctor’s recommendation, and a medical marijuana ID
may have contributed to underreporting of marijuana card simply entitles users to an exemption from the state
use among respondents born outside the US. Further marijuana sales tax, it will be important to monitor future
research is needed to gain a better understanding of the trends in both medicinal and non-medicinal marijuana use
factors contributing to the lower reported use among and their relationships with health conditions.
immigrants and to inform cannabis prevention programs This report on recent trends in adult use of marijuana
targeting the children of immigrants.7 in Los Angeles County will serve as an important baseline
Among US born adults, marijuana use was high as the Department of Public Health and others assess
among those living below the FPL, a finding that was the health implications of marijuana legalization in the
observed among Latinos, African Americans, and whites. coming years. The 2018 LACHS includes a larger set of
This is of particular concern since marijuana businesses questions related to marijuana use frequency (including
are more likely to locate in low income communities past month use and number of days in past month), types
where residents already suffer from a disproportionate of marijuana products used (e.g., edibles, vaping), use for
burden of illness and disability. 8
treatment of a medical condition, use at the same time as
The fact that marijuana use was associated with other substances, use in relation to driving, use at home,
higher rates of binge drinking, cigarette smoking, and and second-hand marijuana smoke exposure. Results are
prescription drug misuse points to the importance anticipated in 2019.
6. WestEd (2015). California Healthy Kids Survey 2014-2015 [Data File]. Avail- 8. Thomas C, Freisthler B. Examining locations of medical marijuana dispensaries in
able from http://chks.wested.org Los Angeles. Drug Alcohol Rev. 2016; 35 (3): 334-337. https://www.ncbi.nlm.nih.
7. Zapolski TCB, Fisher S, Banks DE, Hensel DJ, Barnes-Najor J. Examining the pro- gov/pmc/articles/PMC4814366/
tective effect of ethnic identity on drug attitudes and use among a diverse youth 9. Wen H, Hockenberry JM, Cummings JR. The effect of medical marijuana laws
population. J Youth Adolesc. 2017; 46(8):1702-171. https://link.springer.com/arti on adolescent and adult use of marijuana, alcohol, and other substances. J Health
cle/10.1007%2Fs10964-016-0605-0 Econ. 2016; 42: 64-80. https://www.sciencedirect.com/science/article/abs/pii/
S0167629615000351Key Public Health Actions to Minimize Adverse
Additional Resources
Health Impacts of Marijuana Legalization
The Los Angeles County Department of Public
Health:
1. Provide community education and prevention • Offers information and fact sheets regarding the
messaging, particularly to youth, pregnant laws and risks related to marijuana use.
women, and other priority populations at http://publichealth.lacounty.gov/media/
increased risk of adverse health effects. Cannabis/
• Provides current facts on the effects of marijuana
2. Conduct inspections and enforce regulations to on teens and what researchers are looking out for
ensure safe marijuana cultivation, distribution, and in future studies on marijuana.
retail activities. https://www.mjfactcheck.org/los-angeles-county
• Has a YouTube channel with educational videos,
3. Conduct health impact assessments and provide peer-to-peer conversations, and roundtable
other evidence-based information to inform discussions on marijuana and various effects on
teens to promote #BiggerChoices.
policy decisions related to marijuana regulation
www.LetsTalkCannabisLACounty.com
and taxation. (For more information about health
impact assessments, visit the Center for Health • Provides teen-focused information on the
Impact Evaluation at http://publichealth.lacounty. consequences and health effects of marijuana
on teens and ways they can make bigger choices
gov/pa/.)
than weed.
http://publichealth.lacounty.gov/sapc/teens/
4. Establish data systems to ensure effective
monitoring for adverse health and environmental The role of Los Angeles County’s Office of
Cannabis Management (OCM), working closely
impacts and rapid response to address these
with the Board of Supervisors and County
impacts.
departments, is to coordinate the implementation of
County cannabis policies and regulations.
5. Promote a health equity framework to ensure that
http://cannabis.lacounty.gov/
actions are taken to mitigate harms in low income
The California Department of Public Health has
communities, communities of color, and other
an educational website on responsible adult use
marginalized populations. (For more information
of marijuana post-legalization, as well as other
about health equity, visit the Center for Health
resources on marijuana.
Equity at http://publichealth.lacounty.gov/ http://bit.do/letstalkcannabis
CenterForHealthEquity/.)
The National Institute on Drug Abuse (NIDA) for
Teens provides interactive tools and blog posts on
marijuana and how it affects teens.
https://teens.drugabuse.gov/drug-facts/marijuanaLA In this issue:
HEALTH RECENT TRENDS IN
MARIJUANA USE
LOS ANGELES COUNTY
BOARD OF SUPERVISORS
Hilda L. Solis, First District Los Angeles County
Mark Ridley-Thomas, Second District Department of Public Health
313 N Figueroa Street, Room 127
Sheila Kuehl, Third District Los Angeles, CA 90012
Janice Hahn, Fourth District
Kathryn Barger, Fifth District
LA COUNTY DEPARTMENT
OF PUBLIC HEALTH
Barbara Ferrer, PhD, MPH, MEd
Director
Jeffrey D. Gunzenhauser, MD, MPH
Interim Health Officer
Cynthia A. Harding, MPH
Chief Deputy Director
Paul Simon, MD, MPH
Chief Science Officer
OFFICE OF HEALTH ASSESSMENT
& EPIDEMIOLOGY
Suggested Citation: Los Angeles County Department of Public Health,
Amy S. Lightstone, MPH, MA
Office of Health Assessment and Epidemiology, Recent Trends In
Chief, Epidemiology & Data Coordination
Marijuana Use In Los Angeles County, July 2018
Unit
CENTER FOR HEALTH IMPACT For additional information about the LA County Health Survey,
visit: www.publichealth.lacounty.gov/ha
EVALUATION
Will Nicholas, PhD, MPH
Director
ACKNOWLEDGEMENTS
We thank Tina Kim, PhD, MA; Yan Cui,
MD, PhD; and Faith Washburn, MPH, for
their assistance and contributions in prepar-
ing this brief.
Printed by a Forest Stewardship Council certified printer on paper certified by the Forest Stewardship
Council to consist of 50% total recycled content, of which 25% is Post Consumer recycled.
The Los Angeles County Health Survey is a periodic, population-based telephone survey that collects
information on sociodemographic characteristics, health status, health behaviors, and access to health
services among adults and children in the County. The 2015 survey collected information on a random
sample of 8,008 adults and 5,982 children. The survey was conducted for the Los Angeles County
Department of Public Health by Abt SRBI Inc., and was supported by grants from First 5 LA, the Los
Angeles County Department of Mental Health, and Department of Public Health programs including
the Division of Chronic Disease and Injury Prevention, Children’s Medical Services, the Emergency
Preparedness and Response Program, Substance Abuse Prevention and Control, and Environmental Health.You can also read


