Senior Housing & Care - Market Insight 2018 Q1 Review - CBRE

Page created by Enrique Morales
 
CONTINUE READING
Senior Housing & Care - Market Insight 2018 Q1 Review - CBRE
Senior Housing & Care    2018
                          Q1
     Market Insight     Review
Senior Housing & Care - Market Insight 2018 Q1 Review - CBRE
IN THIS REPORT

  Senior Housing Market Fundamentals

  5
  Capitalization Rates, Transaction Activity & Underwriting

 17
  Structured Debt Options

 24
  About CBRE National Senior Housing

 26
Senior Housing & Care - Market Insight 2018 Q1 Review - CBRE
NATIONAL SENIOR HOUSING PRIMARY CONTACTS

LISA WIDMIER                       MATTHEW WHITLOCK                    ARON WILL                          DEBORAH STREET
Executive Vice President           Vice Chairman                       Vice Chairman                      Vice President
Institutional Properties           Institutional Properties            Institutional Properties           Institutional Properties
National Senior Housing            National Senior Housing             National Senior Housing            National Senior Housing
Capital Advisors, Inc.             Debt & Structured Finance           Debt & Structured Finance          CBRE | Capital Markets
Investment Banking                 CBRE | Capital Markets              CBRE | Capital Markets             T +1 760 438 8559
Member FINRA/SIPC                  T +1 978 282 0024                   T +1 713 787 1965                  M +1 760 715 2076
CBRE | Capital Markets
T +1 858 729 9890
M +1 858 952 4743

NATIONAL SENIOR HOUSING TEAM

MATT KURONEN                ADAM MINCBERG               AUSTIN SACCO                  ASHAY SHAH                    TIM ROOT                      HENRY MCARDLE
Vice President              Vice President              Vice President                Transaction Manager           Senior Production Analyst     Senior Financial Analyst
Institutional Properties    Institutional Properties    Institutional Properties      Institutional Properties      Institutional Properties      Institutional Properties
National Senior Housing     National Senior Housing     National Senior Housing       National Senior Housing       National Senior Housing       National Senior Housing
Debt & Structured Finance   Debt & Structured Finance   Debt & Structured Finance     CBRE | Capital Markets        Debt & Structured Finance     CBRE | Capital Markets

KENNETH QUACH               BRANDON WILLIAMS            SANDY AGUILA                  JUDITH BRIGGS                 NATALIA MANNING
Financial Analyst           Production Analyst          Client Services Coordinator   Client Services Coordinator   Client Services Coordinator
Institutional Properties    Institutional Properties    Graphic Designer              Institutional Properties      Institutional Properties
National Senior Housing     National Senior Housing     Institutional Properties      National Senior Housing       National Senior Housing
CBRE | Capital Markets      Debt & Structured Finance   National Senior Housing       CBRE | Capital Markets        Debt & Structured Finance
                                                        CBRE | Capital Markets

VERTICAL CORPORATE SUPPORT SOURCE

                                                                             CBRE National Senior Housing
                                                                             5780 Fleet Street, Suite 100, Carlsbad, CA 92008
                                                                             Please visit our website at
                                                                             cbre.com/nationalseniorhousing
MITCHELL KIFFE
Senior Managing Director
National Senior Housing
Debt & Structured Finance

                                                               CBRE | Please visit our website at cbre.com/nationalseniorhousing                                         3
Senior Housing & Care - Market Insight 2018 Q1 Review - CBRE
CBRE NATIONAL SENIOR HOUSING REPRESENTATIVE INVESTMENT
PROPERTY TRANSACTIONS - 2015 FORWARD
Today’s complex and constant changing market environments require special solutions. CBRE SH Team Members
consistently achieve the highest sale price/best debt terms in the industry for their Clients.

               Sunwest Portfolio                       Vintage Portfolio (19)           The Maestro Portfolio
               $1.29 billion                           $1.15 billion                    $921,000,000
               Nationa Portfolio                       Northern and Southern CA         Alberta and Quebec,
               11,096 IL/AL/MC units/                  (18) and Western WA (1)          Canada
               beds                                    2,590 IL/AL/MC units             8,206 IL/AL/MC units/beds
               Client was The Blackstone               Client was Vintage Senior        Client was Maestro Funds
               Group                                   Living and their private
                                                       investors

               The Fountains Portfolio                Brightview I                     Sunwest Managed
               $640.0 million                         $498,500,000                     Portfolio
               National Portfolio                     National Portfolio (5 States)    $364,250,000
               (11 states)                            1,584 IL/AL/MC units/beds        National Portfolio (11
               3,637 IL/AL/MC and Entry               Client was Affiliate of          states)
               Fee CCRC units/beds                    Prudential Real Estate            3,054 IL/AL/MC and
               Client was Fountains Senior            Investors                        Cottages
               Living Holdings, LLC                                                    Client was Sunwest

               Brightview II                          The Garden Empire Portfolio      Mid-Atlantic Portfolio
               $363,500,000                           $307,500,000                     $186.2 million
               National Portfolio (3 States)          NJ and NY                        Greater Baltimore,
                1,117 IL/AL/MC units/beds              933 IL/AL/MC units/beds         Maryland (5) and Greater
               Client was an Affiliate of             Client was an Affiliate of The   Washington, D.C. (2)
               The Shelter Group                      Carlyle Group                    526 AL/MC units
                                                                                       Client was an affiliate of
                                                                                       Harrison Street

               CCRC Portfolio                         Five Allegro Communities         Lang Nelson Portfolio
               $186,500,000                           $172,500,000                     JV Recapitalization
               Dallas, TX                             FL and KY                        $127,000,000
               1,104 units                            705 IL/AL/MC/NC units/beds       Greater Minneapolis, MN
               Client was Life Care                   Client was Almanac Realty         1,166 IL/AL units/beds
               Services                                                                Client was Harrison Street
                                                                                       Real Estate Capital

               The Meridian Portfolio                 MBK Two California                Three Arbor Terrace
               $110,500,000                           Communities                       Communities
               CO and TX                              $104,500,000                      $101,665,000
                1,042 IL/NC units/beds                Santa Clarita and Rocklin, CA     Greater Atlanta, GA &
               Client was an Affiliate of             293 IL/AL/MC units                Greater Washington,
               ING Real                               Client was MBK Senior Living      D.C.
               Estate Investment                                                        310 IL/AL/MC units
               Management                                                               Client was Affiliate of
                                                                                        Capitol Seniors Housing

                Texas Portfolio                       Vintage Westwood                  The Wellington at
                Price is Confidential                 $96,000,000                       Hershey’s Mill
                Greater Houston, TX                   Los Angeles, CA                   $95,000,000
                431 AL/MC units                       226 IL units                      West Chester, PA
                Client is Confidential                Client was Vintage                297 IL/AL/SNF units
                                                      Senior Living and their           Client was First
                                                      private investors                 Somerset

                Four IL/AL/MC                         IL/AL/MC                          Renaissance on
                Communities                           Communities                       Peachtree
                $80,400,000                           Price is Confidential             $78,600,000
                Western WA                            The Woodlands, TX                 Atlanta, GA
                320 IL/AL/MC units/beds               (Greater Houston)                 229 IL/AL units/beds
                Client was AEW Capital                207 IL/AL/MC units                Client was The Carlyle
                Management                            Client was Harrison               Group and Formation
                                                      Street/Bridgewood JV              Development

4   CBRE | Please visit our website at cbre.com/nationalseniorhousing
Senior Housing & Care - Market Insight 2018 Q1 Review - CBRE
5      Senior Housing Market
       Fundamentals
The senior housing market continues to perform           from institutional investors, which have accounted
well and to attract substantial global investor          for approximately 30.0% of year to date transaction
interest. Senior housing demand will continue to         volume. By comparison, institutional investment
be driven by several factors including the aging         accounted for only 11.0% of total senior housing
of baby boomers, a stable housing market and             transaction volume in 2015. Despite the recent uptick
an attractive spread between lending rates and           in activity by public buyers, private equity remains
capitalization rates. Demand growth is also fueled       extremely active in the senior housing investment
by seniors with financial capacity who are becoming      community, accounting for 27.0% of year to date
increasingly educated about the benefits of living       transaction volume, in-line with historical private
in senior housing. Average stabilized occupancy is       equity investment share.
steady and strong (approximately 90.1% during the
past four quarters across primary and secondary          Combined senior housing and care transaction
markets) and absorption of new senior housing            volume through year-end 2017 is reported as
supply remains healthy.                                  $15.9 billion in publicly announced transactions, an
                                                         increase over 2016 ($14.5 billion). Combined senior
The senior housing industry has proven itself as not     housing and care transaction volume through May
only a defensive investment during an economic           29, 2018 totals $3.7 billion with transaction volume
downturn, but also an income and capital return          totaling $13.5 billion for the prior four quarters (Q2
leader across the commercial real estate investment      2017 - Q1 2018), on par with prior years.(1) (2)
spectrum. As of Q1 2018, the Property Index
Performance Data provided by the National Council
of Real Estate Investment Fiduciaries (NCREIF)
reports a total return on investment (ROI) for senior
housing of 14.88% and 12.79% for the prior five
and one-year periods, respectively. These returns
are considerably higher than those of other major
real estate property types. The total return reported
for multi-family for the prior five years is 8.99%,
considerably lower than the return reported by
senior housing for this same period.

According to information compiled by Real Capital
Analytics, the composition of senior housing and
care buyers continued to show a dynamic shift
during the first half of 2018. Historically, publicly-
traded buyers (mainly REITs) have represented
a majority of the transaction volume, although
between 2016 and 2017 the public buyers were              Virginia Widmier and Matilda Looney

less active, many devoting significant resources to
portfolio repositioning efforts through coordinated
dispositions. However, during the first half of
2018, publicly-traded buyers represented 34.0%
of transaction volume, the largest share of the total
year to date transaction volume. Additionally, senior
housing is continuing to attract substantial interest                                           Matilda Looney Celebrating 100th Birthday

                                           CBRE | Please visit our website at cbre.com/nationalseniorhousing                                5
Senior Housing & Care - Market Insight 2018 Q1 Review - CBRE
SENIOR HOUSING DEMAND IS DRIVEN BY DEMOGRAPHIC DEMAND
Trends

The baby boomers (post-World War II babies) began                                   per 100,000 standard population. Additionally, age-
turning 65 in 2011 and by 2029, the remainder will                                  adjusted death rates decreased significantly between
also reach age 65 and account for more than 20                                      2013 and 2014 for five of the 10 leading causes.(5)
percent of the total United States population. By 2050,
the 65-plus age group is estimated to equal 88.0                                    Driving this increased life expectancy, and
million, nearly double its current population (49.2                                 consequentially average population age, is the
million). Additionally, by 2056, the 65-plus age group                              advancement in public health strategy and medical
is estimated to be larger than the population under age                             treatment. Life expectancy in the United States has
18. The projected growth in this age group will present                             increased by approximately 30 years over the past
many challenges to policy makers and programs by                                    century, primarily due to the reduction of acute illness
having a significant impact on families, businesses,                                threats. However, an unforeseen consequence of longer
healthcare providers and, most notably, the demand                                  life expectancy has been the increased prevalence of
for senior housing.(3)                                                              heart disease, cancer and other chronic diseases as the
                                                                                    leading causes of death. As Americans age during the
One of the primary drivers in trends for the aging                                  next several decades, the elderly population will require
population is mortality rates. Survivorship rates have                              a larger number of formally trained, professional
shown consistent improvement for many decades. In                                   caregivers as a direct effect of these chronic diseases,
the United States in 1972, the average life expectancy                              which often affect independence and mobility.(3)
of a 65-year-old was 15.2 years. By 2015, this metric
increased by 5.2 years to approximately 20.4 years.                                 Moreover, the problems facing the United States aging
Additionally, it is estimated that about one out of every                           population can be witnessed as a global phenomenon.
four 65-year-olds will live to be 90 years old, with one                            Fifty countries had a higher proportion of people aged
of every 10 expected to live past 95 years of age.(4)                               65-plus than the United States in 2010. This number is
According to NCHS Data Brief No. 229, life expectancy                               expected to increase to approximately 98 countries by
at birth for the United States population reached a                                 2050.(6)
record high of 78.8 years in 2012, with the age-adjusted
death rate for the United States having decreased
1.0% between 2013 and 2014 to a record low of 725

                                               Number of People Age 65 and Over and 85 and Over (millions)
                                                                                                                                      98.2
                            100                                                                                88.0
                                                                                            82.3
    Population (millions)

                            80                                        74.1
                                                     56.4
                            60
                                  40.3
                            40                                                                                                               19.7
                                                                                                   14.6               19.0
                            20           5.5                6.7               9.1
                             0
                                   2010A              2020F             2030F                2040F               2050F                  2060F

                                                            Population 65 +                Population 85 +

Chart Source: U.S. Census Bureau; 2017 National Population Projects: Summary Table 3: Projections of the Population by Sex and Age for the United
States: 2017 to 2060. Released March 2018 historical data per census data.
Note: “A” indicates actuals based on 2010 Census and “F” indicates forecasted population estimates released March 2018.

6                  CBRE | Please visit our website at cbre.com/nationalseniorhousing
Senior Housing & Care - Market Insight 2018 Q1 Review - CBRE
SENIOR HOUSING DEMAND IS DRIVEN BY DEMOGRAPHIC DEMAND
                        U.S. Population Estimates Age 75-Plus

                                   60                                                                                                                                                                                14.0%

                                   50                                                                                                                                                                                12.0%

                                                                                                                                                                                                                                   % of Total Population
                                                                                                                                                                                                                     10.0%
75-Plus Population (millions)

                                   40
                                                                                                                                                                                                                     8.0%
                                   30
                                                                                                                                                                                                                     6.0%
                                   20
                                                                                                                                                                                                                     4.0%

                                   10                                                                                                                                                                                2.0%

                                    0                                                                                                                                                                                0.0%

                                                                                                    Population 75+                           % of Total Population

                        Chart Source: U.S. Census Bureau; release date: March 2018 and U.S. Census Bureau, Statistical Abstract of the United States: 2012.
                        Note: “A” indicates actuals based on Census data and “F” indicates forecasted population estimates released March 2018.

A Multi-Trillion Dollar Industry
In the United States, annual expenditures on healthcare services are projected to total nearly $3.7 trillion in 2018.
Healthcare is one of the largest line items in Federal and State government spending. Healthcare spending is
estimated to grow at an average of 5.5% per year from 2018 through 2025 (4.6% on a per capita basis). Further,
during this same period, healthcare spending is estimated to grow 1.0% faster than GDP per year. As a result,
the healthcare portion of GDP is expected to rise from 18.0% in 2017 to 19.4% by 2025.(7)

                                                                                                                                                                                                         $5,091

                                                                                                                                                                                                                       $5,370
                                                     National Health Expenditures (Billions)

                                                                                                                                                                                             $4,819
                          $6,000

                                                                                                                                                                                 $4,562
                                                                                                                                                                     $4,322
                                                                                                                                                         $4,091
                                                                                                                                             $3,868
                                                                                                                                 $3,675

                          $5,000
                                                                                                                     $3,489
                                                                                                         $3,337
                                                                                        $3,201
                                                                             $3,026
                                                                  $2,879
                                                       $2,797
                                          $2,689

                          $4,000

                          $3,000

                          $2,000

                          $1,000

                                   $0

                                    Source: Centers for Medicare & Medicaid Services, actuals published as of 2/2018. The projections incorporate estimates of GDP and spending as of May 2017.

                                                     National Health Expenditures Per Capita
                                                                                                                                                                                                                         $15,386

                     $20,000
                                                                                                                                                                                                           $14,671
                                                                                                                                                                                               $14,007
                                                                                                                                                                                   $13,378
                                                                                                                                                                       $12,787
                                                                                                                                                           $12,248
                                                                                                                                               $11,685
                                                                                                                                   $11,205
                                                                                                                       $10,736
                                                                                                           $10,364
                                                                                          $10,003

                     $15,000
                                                                               $9,516
                                                                    $9,111
                                                         $8,937
                                            $8,647

                     $10,000

                                $5,000

                                   $0

     Source: Centers for Medicare & Medicaid Services, actuals published as of 2/2018. The projections incorporate estimates of GDP and spending as of May 2017.

                                                                                                        CBRE | Please visit our website at cbre.com/nationalseniorhousing                                                                                  7
Senior Housing & Care - Market Insight 2018 Q1 Review - CBRE
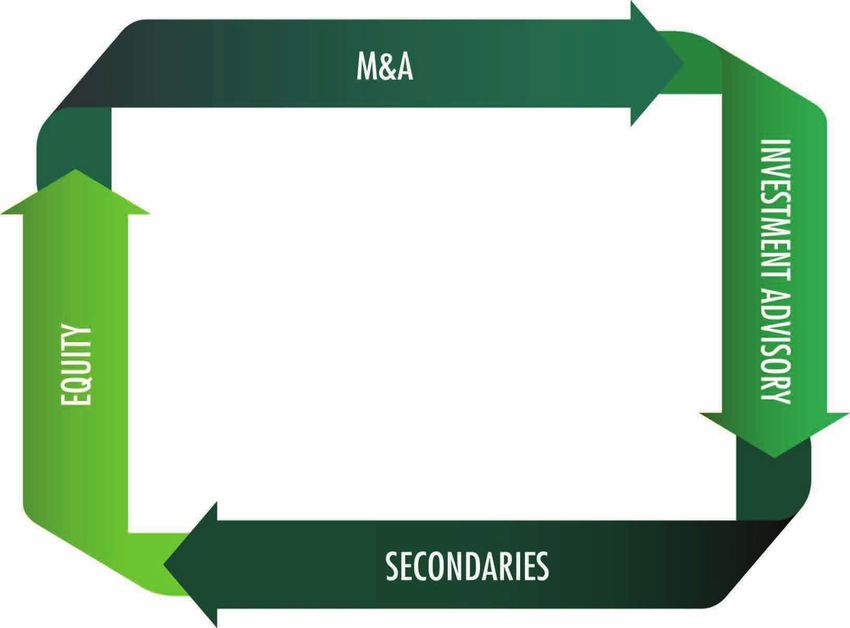
SENIOR HOUSING PROPERTY TYPES
Senior housing can be classified according to the level of healthcare services provided.

                                  Multi-Family                                        Congregate Care                                             Healthcare
                                    Senior                   Independent               Assisted Living              Memory Care                 Nursing Care
                                  Apartments                    Living
 Building Facility           Similar to                  Similar to                  Most units do not           Units do not have           Units resemble hotel
                             apartments but may          apartments but has          have a full kitchen,        a full kitchen, only        rooms and many
                             have special access         commercial kitchen,         only dorm room              dorm room size              rooms have shared
                             and common area             dining room and             size refrigerator and       refrigerator and            occupancy.
                             designs.                    additional common           microwave. Many             microwave. Many
                                                         area amenities.             units are studios.          units are studios.
 Ideal Building Size         60 to 200 Units             100 to 150 Units            80+ Units                   24 to 36 Units              120 Beds (70 Units)
 Resident Entry Age (1)      55 to 75                    75 to 84 (avg. 80.6)        75 to 85 (avg. 87)          Included with               80 to 90
                                                                                                                 assisted living
 Percent Revenue             0%                          45%                         65%                         Included with               75%
 from Services (2)                                                                                               assisted living
 Typical Services            Organized social            Restaurant-style            Independent                 Assisted living             Assisted living
 Provided                    activities.                 dining, social              living services plus        services plus special       services plus
                                                         activities, weekly          assistance with             behavior/memory             administration of
                                                         housekeeping,               bathing, eating and         care, secured access        medications. 24
                                                         laundry and                 dressing; medication        only.                       hour care by RA, RN
                                                         transportation.             reminders (no                                           licensed personnel.
                                                                                     administration of
                                                                                     medicine).
 Average Length of           5 to 12 Years               2.0 to 3.6 Years            1.2 to 3.0 Years            1.3 to 2.7 Years            30 Days to 2 Years
 Stay(3)
 Average Monthly
 Rent (4)                                                $3,263                      $4,949                      $6,593                      $9,836

 Trailing 50 Quarter
 Avg. Stabilized
 Occupancy / Current                                     90.5% / 91.4%               90.3% / 88.9%               90.1% / 86.5%               88.8% / 86.7%
 Avg. Stabilized
 Occupancy (4)

 Total Units/Beds in                                     270,926                     240,496                     78,965                      586,246
 Inventory (4)
 Number of Units/
 Beds Under                                              14,426                      17,718                      8,436                       4,915
 Construction (4)
 Construction vs.
 Inventory (4)                                           5.3%                        7.4%                        10.7%                       0.8%

 Penetration Rate of                                     6.0% IL/4.3% CCRC           5.0%                        Included with               10.6%
 75+ Households (4) (5)                                                                                          assisted living

Notes:

(1) IL Data-”Retirement Living Communities: How They Are Changing the Way People Retire,” Senior Homes, accessed October 15, 2015 http://www.seniorhomes.
     com/p/retirement-living-communities/. AL Data- Centers for Disease Control and Prevention, Residents Living in Residential Care Facilities: United States, 2010
     Christine Caffrey, Manisha Sengupta, Eunice Park-Lee, Abigail Moss, and Lauren Harris-Kojetin, NCHS data brief, no 91. Hyattsville, MD: National Center for
     Health Statistics. 2012., http://www.cdc.gov/nchs/data/databriefs/db91.pdf (accessed October 15, 2015).
(2) “A Case for Investment: Seniors Housing” NIC MAP® Data Service (September 2009).
(3) “The State of Seniors Housing 2016.” (Table 8.2) ASHA American Seniors Housing Association (2016).
(4) NIC MAP® Data Service; Primary Market Data.
(5) Ibid. Note: Penetration rate equals inventory divided by the number of households headed by an individual at least 75 years old

8        CBRE | Please visit our website at cbre.com/nationalseniorhousing
Senior Housing & Care - Market Insight 2018 Q1 Review - CBRE
SENIOR HOUSING SUPPLY
       Number Communities                                                          Total Units/Beds
  Number Communities             Continuing Care                                                        Total Units/Beds
                                   Retirement                                     Majority Nursing
       Majority Nursing                                                                Care
                                  Communities                                                                                    Continuing Care
            Care                                                                      44.5%
                                       7.7%                                                                                        Retirement
           43.2%                                           Majority
                                                                                                                                  Communities
                                                         Independent
                                                                                                                                      20.0%
                                                        Living 11.0%

                                                                                                                                                 Majority
                                                                                                                                               Independent
                                                                                                                                                  Living
                                                                                                                                                  12.7%

                                                       Majority Assisted
                                                            Living
                                                           38.1%

                                                                                                                           Majority Assisted
                                                                                                                                Living
Source: NIC MAP® Data Service.                                                                                                 22.8%

  Community Location in the NIC MAP Metro Markets

                                       Total No. of           Total No. of                           Location Mix (Units/Beds)
   Region                              Communities             Units/Beds
   Northeast                             3,266                472,652        West,                                                         Northeast,
   Southeast                             3,483                431,494        19.2%                                                         24.8%
   North Central                         3,113                382,817
   South Central                         2,163                252,143
                                                                             South
   West                                  3,278                365,078        Central,
   Top 100 Metro Market Totals         15,303             1,904,184          13.2%

  Note:
  Northeast – CT, DE, ME, MA, NH, NJ, NY, PA, RI, VT                                                                                       Southeast,
  Southeast – AL, DC, FL, GA, KY, MD, NC, SC, TN, VA, WV                                                                                   22.7%
  North Central – IA, IL, IN, MI, MN, NE, ND, OH, SD, WI                     North Central,
  South Central – AR, KS, LA, OK, TX, MO, MS                                 20.1%
  West – AK, AZ, CA, CO, HI, ID, MT, NM, NV, OR, UT, WA, WY

                                                                             Source: NIC MAP® Data Service.

Existing Senior Housing Supply                                                          Some Compelling Math
There are approximately 23,350 professionally managed                                   • A 5.9% increase in the number of seniors
senior housing and nursing care communities (with 25 or more                              is more than the total number of the entire
units/beds) in the United States, representing 3.01 million                               existing supply of professionally managed
professionally managed units/beds nationally. The combined                                senior housing beds/units!(8)(9)
projected total value is $469.2 billion based on values reported
in The Senior Care Acquisition Report for 2017 transactions and                         • A 1.0% increase in the penetration rate
NIC MAP’s industry size projections. The current estimated value                          would necessitate a 17.0% increase in the
is more than twice the value reported as of 2009 ($222.8).(2)(8)                          professionally managed senior housing
                                                                                          supply to meet this incremental demand.(8)(9)

                                                               CBRE | Please visit our website at cbre.com/nationalseniorhousing                             9
Senior Housing & Care - Market Insight 2018 Q1 Review - CBRE
SENIOR HOUSING CONSTRUCTION ACTIVITY
With a Q1 2018 year-over-year growth rate of 2.2%, inventory growth is below the 30-year
average annual growth rate of 4.0%.(8)

The senior housing pipeline (construction versus inventory) is 6.2% as of Q1 2018. New senior housing construction
activity peaked at 11,368 units/beds during the second quarter of 2015. There were reportedly 6,330 units/beds
of new construction starts in the first quarter of 2018, which is just over half of what was reported during this peak.
(8)

                                                                                Senior Housing Inventory Growth
                                       10.00%
                                                                                         (All Markets)
                                        9.00%

                                        8.00%                                                                                                        Inventory Growth %
                                                                                                                                                       at 30 year lows
                                        7.00%
            Growth in Inventory (%)

                                        6.00%
                                                                                                    Average = 4.0%
                                        5.00%

                                        4.00%

                                        3.00%

                                        2.00%

                                        1.00%

                                        0.00%

                                      Source: NIC MAP® Data Service.

         New Senior Housing Construction

                                                                                         New Construction Started by Quarter

         8,000

         7,000

         6,000

         5,000
 Units

         4,000

         3,000

         2,000

         1,000

                  0

                                                                   Majority Independent Living     Majority Assited Living   Majority Nursing Care

Source: NIC MAP® Data Service.

10               CBRE | Please visit our website at cbre.com/nationalseniorhousing
SENIOR HOUSING OCCUPANCY RATES
                                                                                                                         93.0%

 Historical    occupancy       for     seasoned                                                                          92.0%
 communities (those open 24 months or
 longer) is detailed in the graph to the right.                                                                          91.0%

                                                                                   Stabilized Occupancy (%)
 Independent living occupancy (91.4%) led the
                                                                                                                         90.0%
 pack followed by the assisted living (88.9%)
 and memory care segments (86.5%). Nursing                                                                               89.0%
 care occupancy averaged 86.7% in Q1 2018,
 which is consistent with the prior four-quarter                                                                         88.0%
 average (86.5%).
                                                                                                                         87.0%

                                                                                                                         86.0%

                                                                                                                         85.0%

Source: NIC MAP® Data Service.                                                                                                                       Independent Living                     Assisted Living
                                                                                                                                                     Memory Care                            Nursing Care

Occupancy versus Average Monthly Rent “AMR” Growth
Average stabilized occupancy and rent growth for the primary market benchmarks are detailed by care segment in the
graphs below. Aggregated senior housing annual rent growth was 2.2% in Q1 2018. Nursing care reported average
annual rent growth of 2.3% in Q1 2018.

                                            Independent Living                                                                                                            Assisted Living
                                                                             4.0%                                                                                                                             4.0%
                     94%                                                                                                                       94%
                                                                             3.5%                                                                                                                             3.5%
                     92%                                                                                                                       92%
                                                                             3.0%                                                                                                                             3.0%
                                                                                                      Y-t-Y Growth (%)

                                                                                                                                                                                                                     Y-t-Y Growth (%)
                     90%
  Occupancy (%)

                                                                                                                                               90%
                                                                                                                           Occupancy (%)

                                                                             2.5%                                                                                                                             2.5%
                     88%                                                     2.0%                                                              88%                                                            2.0%
                     86%                                                     1.5%                                                              86%                                                            1.5%
                     84%                                                     1.0%                                                              84%                                                            1.0%
                     82%                                                     0.5%                                                              82%                                                            0.5%
                     80%                                                     0.0%                                                              80%                                                            0.0%

                            Stabilized Avg Occupancy       Avg AMR Y-t-Y Growth                                                                      Stabilized Avg Occupancy        Avg AMR Y-t-Y Growth

                                             Memory Care                                                                                                                   Nursing Care
                                                                             4.0%                                                                                                                             4.0%
                      94%                                                                                                                      94%
                                                                             3.5%                                                                                                                             3.5%
                      92%                                                                                                                      92%
                                                                             3.0%                                                                                                                             3.0%
                                                                                                                                                                                                                      Y-t-Y Growth (%)
                                                                                                   Y-t-Y Growth (%)

                      90%
                                                                                                                               Occupancy (%)
   Occupancy (%)

                                                                             2.5%                                                              90%
                                                                                                                                                                                                              2.5%
                      88%                                                    2.0%                                                              88%                                                            2.0%
                      86%                                                    1.5%                                                              86%                                                            1.5%
                      84%                                                    1.0%                                                              84%                                                            1.0%
                      82%                                                    0.5%                                                              82%                                                            0.5%
                      80%                                                    0.0%                                                              80%                                                            0.0%

                            Stabilized Avg Occupancy        Avg AMR Y-t-Y Growth                                                                     Stabilized Avg Occupancy         Avg ADR Y-t-Y Growth

                   Source: NIC MAP® Data Service.

                                                                     CBRE | Please visit our website at cbre.com/nationalseniorhousing                                                                                                   11
HOW DOES OCCUPANCY STACK UP WITH OTHER PROPERTY TYPES?
Senior housing occupancy has been relatively consistent and never significantly below 90% – even during the
economic downturn in 2008.

           Comparison of Occupancy Senior Housing vs. Other Commercial Property Types

      90.0%

      80.0%

      70.0%

      60.0%

      50.0%

      40.0%
                         2011               2012               2013                2014               2015               2016                2017

  Sources: Seniors Housing source is NIC MAP® Data Service; Retail, Office and Multi-family source is Mortgage Bankers Association Q4 2017 Quarterly Data
  Book; HotelNewsNow Newswire December Releases 2011-2017.

              Office Occupancy

              Retail Occupancy

              Multi-family Occupancy

              Hotel Occupancy

              Seniors Housing Occupancy

12    CBRE | Please visit our website at cbre.com/nationalseniorhousing
SENIOR HOUSING MANAGEMENT COMPANIES
(Independent Living “IL”/Assisted Living “AL”)

 RANK COMPANY                                                        OWNERSHIP               UNITS/BEDS    PROPERTIES
                                                                                             MANAGED

     1      Brookdale                                                  Public → BKD            102,055       1,048

     2      Holiday Retirement                                         Private                 37,523          306

     3      LCS                                                        Private                 34,400          141

     4      Sunrise Senior Living LLC                                  Public → SRZ            27,125          260

     5      Five Star Senior Living                                    Public → FVE            24,476          215

     6      Erickson Living                                            Private                 21,705           18

     7      Senior Lifestyle Corporation                               Private                 19,905          194

     8      Atria Senior Living                                        Private                 19,541          166

     9      Capital Senior Living                                      Public → CSU            12,591          129

    10      Enlivant                                                   Private                 10,794          231

Source: “ASHA 50 Report” ASHA: American Seniors Housing Association, (as of June 1, 2017).

• This is a highly fragmented (“cottage industry”) market.

• The top 50 senior housing providers control 33.0% of the IL/AL/MC total supply. (10)

• The average size of the top 50 providers is only 10,226 units per provider compared to an average of 31,012
  units for the top 10.

• Only four providers in the Top 50 are publicly traded companies.

                                                    CBRE | Please visit our website at cbre.com/nationalseniorhousing   13
NURSING CARE MANAGEMENT COMPANIES

(“SNF” or “NC”)

  RANK         COMPANY                                                                   OWNERSHIP         BEDS
                                                                                                         MANAGED FACILITIES

     1         Genesis HealthCare Corp                                                   Public → GEN     56,575    512

     2         HCR ManorCare                                                             Private          34,539    255

     3         Golden Living                                                             Private          30,267    295

     4         Life Care Centers of America                                              Private          28,414    213

     5         SavaSeniorCare                                                            Private          24,154    200

     6         Consulate Health Care                                                     Private          22,059    210

     7         Signature HealthCARE                                                      Private          14,157    113

     8         The Ensign Group                                                          Public → ENSG    13,205    124

     9         Extendicare Health Services                                               Public → EXE     12,086     90

     10        Kindred Healthcare                                                        Public → KND     11,535     90

Source: Provider Magazine; June 2016 issue. Rankings are based on 12/31/15 bed counts.

• Also a highly fragmented (“cottage industry”) market.

• Nursing care providers provide an array of services and specialty care remains a strong trend for the top
  50 providers. Memory care is at the top of the list (47 providers), followed closely by assisted living (43) and
  outpatient therapy (42).

• The top 50 nursing care providers control 29.8% of the total nursing care supply.(11)(12)

• The average size of the top 50 providers is only 8,710 beds per provider compared to 24,699 beds for the top
  ten providers.(11)(12)

• Only eight providers in the top 50 are publicly traded companies.

14       CBRE | Please visit our website at cbre.com/nationalseniorhousing
PUBLICLY TRADED SENIOR HOUSING COMPANIES
The senior housing/healthcare publicly traded providers’ total market capitalization is approximately $6.36 billion
as of June 11, 2018. This is up from $5.20 billion on September 19, 2017.

Public Pricing
                                                                                                                52-Week Range
                                                   Close                    200-Day
                                                            Trailing P/E               52-Week                                           Market Cap
 Company                             Ticker     Stock Price                  Moving
                                                             Ratio (1) (2)             Change (1)             High (1)      Low (1)       6/11/18
                                                 6/11/18                   Average (1)

 Independent/Assisted
 Living:

 Brookdale Senior Living              BKD          9.05            N/A          8.35         -37.75%          15.66          6.28           1.70B

 Capital Senior Living                CSU         11.09            N/A         12.06         -26.06%          16.72          9.15         345.26M

 Five Star Quality Care               FVE          1.55            N/A          1.39         -11.76%           1.85          1.05          78.33M

 Total IL/AL                                                                                                                               $ 2.12B

 Nursing Care:

 Adcare Health Systems                ADK       0.2356           N/A          0.2675         -77.01%           1.14         0.16            4.62M

 Diversicare Healthcare              DVCR           7            N/A            8.36         -32.31%          12.25         6.45           44.19M

 Ensign Group                        ENSG        37.23         48.35           27.17         84.91%           38.45        18.75            1.94M

 Kindred Healthcare                   KND           9            N/A              9          -15.57%           11.9          5.5          821.35M

 National Healthcare
                                     NHC         69.62         18.87           62.57          -4.99%           74.8           57            1.06B
 Corp.

 Genesis Healthcare                   GEN         2.3            N/A             1.3         27.93%             2.5          0.6          366.73M

 Total NC                                                                                                                                  $ 4.24B

 Total Providers                                                                                                                         $ 6.36B

Notes:
(1) Data pulled by Yahoo! Finance who pulls from multiple sources or calculates internally. Data is for 52-weeks ending 6/11/2018.
(2) Trailing twelve months intraday P/E Ratio.
(3) Market Cap is an intraday value derived by taking outstanding shares multiplied by the current share price. Shares outstanding is taken from the most recently filed
quarterly or annual report and Market Cap is calculated using shares outstanding.							                                                                       (4)
Enterprise Value is a market-based measure of a company’s value and is generally equal to Market Cap plus debt minus total cash and cash equivalents.

Chart Source: Yahoo! Finance

                                                                 CBRE | Please visit our website at cbre.com/nationalseniorhousing                                         15
PUBLICLY TRADED SENIOR HOUSING DOMINATED REITs
The senior housing/healthcare REIT total market capitalization is $82.48 billion as of June 11, 2018. This is down
slightly as compared to $88.76 billion reported as of September 19, 2017.

REIT Pricing
                                                                                                             52-Week Range
                                                Close          Trailing
                                                                Annual        Dividend      52-Week                                   Market Cap
 Company                           Ticker    Stock Price       Dividend        Date (1)     Change (1)      High (1)     Low (1)     6/11/2018 (2)
                                             6/11/2018          Yield (1)

 REITs

 CareTrust REIT                     CTRE         16.58           4.44%       13-Apr-18       -11.84%        19.86         12.73           1.26B

 HCP, Inc.                          HCP          24.18           6.08%       22-May-18       -23.02%        33.67         21.48          11.52B

 LTC Properties                     LTC          41.63           5.48%       29-Jun-18       -16.39%        52.85         34.46           1.65B

 MedEquities Realty Trust (4)       MRT          10.25           8.20%        5-Jun-18       -13.80%        13.06         9.67          326.84M

 National Health Investors          NHI          74.03           5.15%       10-Aug-18        -4.96%         81.6        62.71            3.07B

 New Senior Investment
                                    SNR           7.47          14.09%       22-Jun-18       -24.85%        10.57         6.77          613.65M
 Group
 Omega Healthcare
                                    OHI          30.81           8.43%       15-May-18        -6.27%        34.84         24.9            6.39B
 Investors

 Quality Care Properties(5)         QCP          21.22            N/A            N/A          19.98%        22.91        12.25            2.00B

 Sabra Health Care REIT (6)         SBRA         20.89           8.25%       31-May-18        -9.85%        25.31        15.78            3.72B

 Senior Housing Properties
                                    SNH          17.59           8.87%       17-May-18       -17.80%        22.01        14.86            4.18B
 Trust

 Ventas                             VTR          54.91           5.68%        12-Jul-18      -19.55%        72.36        46.55           19.70B

 Welltower (7)                      HCN           58.3           6.00%       23-May-18 39893.11% 60.99                    0.11           21.69B

 Total REITs                                                                                                                          $76.12B

 Providers & REITs Estimated Market Capitalization Total:                                                                             $82.48B

Notes:
(1) Data pulled by Yahoo! Finance who pulls from multiple sources or calculates internally. Data is for 52-weeks ending 9/19/2017.			                      (2)
Market Cap is an intraday value derived by taking outstanding shares multiplied by the current share price. Shares outstanding is taken from the most recently filed
quarterly or annual report and Market Cap is calculated using shares outstanding.
(3) Enterprise Value is a market-based measure of a company’s value and is generally equal to Market Cap plus debt minus total cash and cash equivalents.
           (4) MedEquities went public on Septembr 28, 2016 at $12 per share, and announced a $0.21 dividend.
(5) Quality Care Properties was spun out from HCP effective November 1, 2016.							                                                                       (6)
Care Capital Properties was merged into Sabra Health Care REIT effective August 16, 2017.
(7) Formerly Health Care REIT.

Chart Source: Yahoo! Finance

16       CBRE | Please visit our website at cbre.com/nationalseniorhousing
17                    Capitalization Rates, Transaction
                      Activity & Underwriting
 Decade in Review - Senior Housing Transaction Volume
                                                                                  Dollar Value of Publicly Announced
                                                                           Senior Housing & Care Transactions (2008-2017)
                                                       $30                                                                                                                      400

                                                                                                                                                                                350
                                                       $25
                       Transaction Volume (Billions)

                                                                                                                                                                                       Number of Transactions
                                                                                                                                                                                300
                                                       $20
                                                                                                                                                                                250

                                                       $15                                                                                                                      200

                                                                                                                                                                                150
                                                       $10
                                                                                                                                                                                100
                                                         $5
                                                                                                                                                                                50

                                                         $0                                                                                                                     0
                                                                   2008        2009    2010        2011        2012      2013     2014      2015        2016     2017

                                                                                      Transaction Volume (Billions)                  Number of Transactions

                 Chart Source: The Senior Care Acquisition Report, 23rd Edition 2018.

Senior Housing & Care Transaction Activity By Buyer Type
Cross-Border (Internationally Based)                                                                                        Private
A buyer is defined as “cross-border” if the buyer or major                                                                  Private, as an investor type, refers to companies whose control is
capital partner is not headquartered in the same country where                                                              in private hands and whose business is primarily geared toward
the property is located. An increasing number of firms have                                                                 operating, developing, or investing in commercial real estate.
subsidiaries accessing capital in multiple countries so a firm may                                                          This includes private equity joint ventures, commingled funds and
have two headquarters locations for the purposes of the chart                                                               high net worth family offices.
analysis. For example, Deutsch Bank (DB Real Estate) is assumed
to be based in Germany for deals outside of the United States                                                               Public Listed/REITs
while their acquisitions within the United States are assumed to be                                                         Companies and/or funds traded on open public markets whose
made via its domestic headquartered subsidiary, RREEF.                                                                      business is primarily geared toward investing in and/or operating
                                                                                                                            or developing commercial real estate. These include REITs, REOCs
Institutional                                                                                                               and publicly-listed funds.
Institutional refers to an investor, such as a bank, insurance
company, retirement fund, hedge fund or mutual fund that is                                                                 User/Other
financially sophisticated and makes large investments, often held                                                           Users of commercial property for specific purposes; business
in very large portfolios of investments.                                                                                    users, government, educational or religious institutions who own
                                                                                                                            real estate for their own use.

                60%                                                               Seniors Housing Transaction Activity ($B) By Buyer Type
                                                             51%
                50%                                                                          46%

                40%                                                                                                                                                       38%
                                                                                                                                                                                                                 34%
                                                                                                                                                                                                                34.0%
      Buyer %

                                                                                                                                                                                                                         30%
                                                                                                                                                                                                                        30.0%
                30%                                                                    27%                                     26% 25%                                                 27%
                                                                                                                                                                                      27.0%
                                                       25%                                                               24%             24%            23%
                                                                                                                                                                    21%
                20%
                                                                         14%                       14%
                                                                                                         11%                                                  12%
                                                                   10%                                                                                                                                               9%
                                                                                                                                                                                                                    9.0%
                10%                                                                                                                                5%
                              1%                                                  2%                                1%                                                                 0%
                                                                                                                                                                                     0.0%
                0%
                                                         2014                              2015                             2016                           2017                                             2018 YTD

                                                                           User/Other         Private          Public Listed/REITs       Cross-Border         Institutional
Chart Source: Real Capital Analytics, May 29, 2018. Senior Housing transactions only.

                                                                                                   CBRE | Please visit our website at cbre.com/nationalseniorhousing                                                            17
CROSS-BORDER TRANSACTION ACTIVITY ANALYSIS
During the past three years, the senior housing investment market has witnessed a continual dynamic shift in
the investor profile mix. Historically, publicly-traded buyers (mainly REITs) have represented a majority of the
transaction volume, although between 2016 and 2017 the public buyers were less active, many devoting resources
to portfolio repositioning efforts through coordinated dispositions. However, during the first half of 2018, publicly-
traded buyers represented 34.0% of transaction volume, the largest share of the total year to date transaction
volume. Additionally, senior housing is continuing to attract substantial interest from institutional investors, which
have accounted for approximately 30.0% of year to date transaction volume. Institutional buyers include banks,
insurance companies, retirement (pension) funds, hedge funds and mutual funds. By comparison, institutional
investment accounted for only 11.0% of total senior housing transaction volume in 2015. Despite the recent uptick
in activity by public buyers, private equity remains extremely active in the senior housing investment community,
accounting for 27.0% of year to date transaction volume, in-line with historical private equity investment share.
Private equity buyers include dedicated senior housing funds, opportunity funds and commingled funds with core
plus and value-add investment objectives. Cross-border buyers captured a 9% share of the 2018 YTD transaction
volume. Multinational investment platforms from Europe, Asia and the Middle East are actively seeking investments
in U.S. based senior housing.

           Cross-Border Senior Housing Investment by Region

            $4,500
                                                                                                           $4,062
            $4,000

                                                                                $3,357
            $3,500

            $3,000
                                                      $2,572

            $2,500
Millions

            $2,000           $1,736

            $1,500

            $1,000
                                                                                                                                  $535

             $500

               $0
                             2014                      2015                      2016                       2017                2018 (YTD)

                 East Asia   Western Europe   United States    Australia - NZ   MidEast   United Kingdom       Canada   Southeast Asia   Total

Source: Real Capital Analytics, Q2 2018.

 18            CBRE | Please visit our website at cbre.com/nationalseniorhousing
GENERAL INDUSTRY PARAMETERS - PRICING

     Senior Housing/Nursing Care Value Estimated at $469.2 Billion

                          Majority Nursing
                           Care 25.3%

                                                                                                  Majority Independent
                                                                                                     Living 43.0%

 Majority Assisted
  Living 31.7%

              Chart Source: The Senior Care Acquisition Report; 23rd Edition 2018 and NIC MAP®
              Data Service.

Historical Value Per Unit Pricing

                               Senior Housing (IL/AL) Price Per Unit                                                          Independent Living (IL) Price Per Unit

                $275                                                                                                  $275

                $225                                                                                                  $225
(thousands)

                                                                                                        (thousands)

                $175                                                                                                  $175

                $125                                                                                                  $125

                 $75                                                                                                   $75
                        2009     2010    2011    2012     2013   2014    2015    2016     2017                               2009 2010 2011 2012 2013 2014 2015 2016 2017

                            Median IL/AL price per unit          Average IL/AL price per unit                                   Median IL price per unit   Average IL price per unit

                                  Assisted Living (AL) Price Per Unit                                                            Nursing Care (NC) Price Per Bed
                $275                                                                                                  $105

                                                                                                                      $95
                $225
                                                                                                                      $85
                                                                                                      (thousands)
(thousands)

                                                                                                                      $75
                $175
                                                                                                                      $65

                                                                                                                      $55
                $125
                                                                                                                      $45

                 $75                                                                                                  $35
                        2009     2010    2011     2012    2013   2014     2015    2016     2017                              2009 2010 2011 2012 2013 2014 2015 2016 2017

                               Median AL price per unit           Average AL price per unit                                    Median NC price per bed     Average NC price per bed

Chart Source: The Senior Care Acquisition Report; 14th Edition 2009, 23rd Edition 2018.

                                                                            CBRE | Please visit our website at cbre.com/nationalseniorhousing                                          19
SENIOR HOUSING CAPITALIZATION RATES
Senior housing aggregate capitalization rates resumed their downward trend during 2017, a rebound from
their brief uptick due in part to the REIT pullback and a high concentration of value-add deals during 2016. An
abundance of affordable equity capital, in tandem with interest rates that can still be considered historically low
has driven this continued compression. An additional contributing factor was the quality of the properties that
traded during 2017, which included a higher proportion of newer and/or stabilized product. Generally speaking,
the capitalization rates reflected in the chart below are after a management fee and before a capital replacement
reserve and NOI is based on the trailing 12-month period before the sale or year-to-date actuals annualized. The
average and median capitalization rates below are unweighted and the average unit weighted capitalization rate
weighs each transaction’s capitalization rate based on its number of units. Consistent with prior years, the average
unit weighted capitalization rate in 2017 (6.6%) was lower than the unweighted average capitalization rate (7.5%).

                            12.0%

                            11.0%
     Capitalizatoin Rates

                            10.0%

                             9.0%

                             8.0%

                             7.0%

                             6.0%

                                                                Average Cap Rate
                                                                Median Cap Rate

                             Source: Senior Care Acquisition Report, 23nd Edition 2018

20      CBRE | Please visit our website at cbre.com/nationalseniorhousing
SENIOR HOUSING CAPITALIZATION RATES
Summary by Product Type
The following survey reflects the knowledge and collaboration of CBRE Research, Capital Markets and Valuation &
Advisory professionals who provided their estimation of capitalization rate ranges based on recent interactions with
active investors in their market. Core and non-core classifications are based upon the perception of each respondent
and represent their assessment of multiple factors including physical plant and market area characteristics.

Stabilized Property Acquisitions                                  Stabilized Property Acquisitions
  PROPERTY                          CLASS/                           PROPERTY                             CLASS/
                    SECTOR                       H2 2017 (%)                           SECTOR                             H2 2017 (%)
    TYPE                           SEGMENT                             TYPE                              SEGMENT
                                       AA             5.23                                                   A                4.67
                                                                                         Infill               B               5.15
                                       A              6.07                                                   C                5.19
                                                                    Multi-family
                      CBD                                                                                    A                4.96
                                        B             6.90                            Suburban                B               5.49
                                                                                                             C                6.32
                                       C              8.56                                                 Luxury             7.01
    Office
                                       AA             6.38                                              Full-Service          7.69
                                                                                         CBD
                                                                                                       Select-Service         8.05
                                       A              7.14                                               Economy              9.16
                                                                        Hotel
                   Suburban                                                                                Luxury             7.61
                                        B             8.24                                              Full-Service          8.23
                                                                                      Suburban
                                                                                                       Select-Service         8.60
                                       C              9.67                                               Economy              9.65
                                       A              5.25                                                   IL               5.40
   Industrial          All              B             6.27                                                   AL               6.10
                                                                                         Core
                                       C              8.07                             (Class A             MC                6.70
                                                                                         Avg.)
                  Neighbor-            A              5.79                                                  NC                11.20
                    hood /
                                        B             7.23             Senior                              CCRC               7.10
                  Community
                    Center             C              9.03            Housing*                               IL               6.30
     Retail                            A              6.84                                                   AL               6.60
                                                                                      Non-Core
                     Power              B             7.97                             (Class A             MC                7.10
                                                                                         Avg.)
                                       C              9.13                                                  NC                11.80
                  High Street          A              4.67                                                 CCRC               6.00

Source: CBRE Research: CBRE North America Cap Rate Survey Second Half 2017
*Note: Senior Housing figures come from CBRE Research’s U.S. Seniors Housing & Care Investor Survey and Trends Report; Winter 2018.

                                                    CBRE | Please visit our website at cbre.com/nationalseniorhousing                 21
SENIOR HOUSING INVESTMENT RETURNS
The Property Index Performance Data provided
by the National Council of Real Estate Investment                                              Cumulative NCREIF Total Returns
Fiduciaries (NCREIF) demonstrates that reporting                                             NPI vs. Multi-Family vs. Senior Housing
senior housing properties have generally                                                Over the last ten years, Seniors Housing returns have consistently
outperformed the broader National Property                                              outperformed other types of real estate.
Index (NPI) since at least 2003.                                         8,000

                                                                         7,000

The senior housing total return for Q1 2018 was
                                                                                                                                       Stabilized Senior Housing
                                                                         6,000

2.14%, which is comprised of a 1.36% income                              5,000

return and a 0.79% capital appreciation return.

                                                               Index
                                                                         4,000                                                                                      Total NPI

Over the past four quarters, senior housing                              3,000
returned 12.79% (5.59% income and 6.94%
                                                                         2,000
appreciation). This is relatively consistent with                                                                                                                               Apartments

the seven-year total return of 13.63%, and is                            1,000
                                                                              Q1 2011      Q1 2012         Q1 2013     Q1 2014       Q1 2015         Q1 2016            Q1 2017         Q1 2018

5.7% greater than the NPI return of 7.09% and                               0
                                                                                                     Total NPI        Multi-Family       Senior Living Stabilized
6.46% greater than the multi-family total return
of 6.33%. Over a seven-year period, senior
                                                                         Chart Source: NCREIF Query Tool. 3Q04 = 1,000.
housing returns have outperformed the NPI and
multi-family in total returns and income returns.

The stronger performance seen in the senior
                                                                                          Cumulative NCREIF Appreciation Returns
housing sector may reflect the fact that senior                                            NPI vs. Multi-Family vs. Senior Housing
housing has seen continuous rent growth, despite                          2,900

significant fluctuations in the general economy.                          2,700

The following charts illustrate the returns achieved
                                                                          2,500
                                                                          2,300
by the senior housing component as compared                               2,100

to the multi-family component and the overall
                                                                 Index

                                                                          1,900
                                                                          1,700
index. Items shown for each quarter represent                             1,500
that particular quarter’s return, while periods                           1,300

showing a single year or multiple years represent                         1,100
                                                                           900
the compounded annual index returns achieved                                  Q1 2011       Q1 2012         Q1 2013     Q1 2014      Q1 2015          Q1 2016            Q1 2017         Q1 2018

for that period. All returns are before fees.                                                        Total NPI        Multi-Family       Senior Living Stabilized

Senior Housing Returns
                                                                          Chart Source: NCREIF Query Tool. 3Q04 = 1,000.
                     Total Returns
                                 Total     Total Stabilized
                    Total NPI Multi-Family Senior Housing
Q1 2018                1.69      1.46            2.14
Q4 2017                1.77      1.62            4.12
Q3 2017                1.70      1.66            2.73
Q2 2017                1.75      1.45            3.24
Q1 2017                1.62      1.30            2.57                                         Cumulative NCREIF Income Returns
One Year Index         7.09      6.33           12.79
Three Year Index       8.74      7.97           13.16                                        NPI vs. Multi-Family vs. Senior Housing
Five Year Index       10.06      8.99           14.88
Seven Year Index      10.63     10.09           13.63                    2,700
                                                                         2,600
             Capital (Appreciation) Returns                              2,500
                                                                         2,400
                                    Total   Total Stabilized             2,300
                     Total NPI Multi-Family Senior Housing               2,200
Q1 2018                0.57         0.40          0.79                   2,100
                                                                         2,000
Q4 2017                0.63         0.55          2.79                   1,900
Q3 2017                0.56         0.59          1.38
                                                                 Index

                                                                         1,800
Q2 2017                0.59         0.35          1.82                   1,700
                                                                         1,600
Q1 2017                0.48         0.20          0.96                   1,500
One Year Index         2.37         1.90          6.94                   1,400
                                                                         1,300
Three Year Index       3.84         3.32          7.17                   1,200
Five Year Index        4.86         4.13          8.43                   1,100
                                                                         1,000
Seven Year Index       5.16         5.00          6.95                     900
                                                                              Q1 2011      Q1 2012          Q1 2013     Q1 2014      Q1 2015          Q1 2016             Q1 2017            Q1 2018
                        Income Returns
                                  Total    Total Stabilized
                    Total NPI Multi-Family Senior Housing                                            Total NPI        Multi-Family        Senior Living Stabilized
Q1 2018               1.12        1.06           1.36
Q4 2017               1.13        1.07           1.34
Q3 2017               1.14        1.07           1.36                    Chart Source: NCREIF Query Tool. 3Q04 = 1,000.
Q2 2017               1.16        1.10           1.42
Q1 2017               1.15        1.10           1.61
One Year Index        4.63        4.37           5.59
Three Year Index      4.77        4.55           5.70
Five Year Index       5.02        4.72           6.09
Seven Year Index      5.27        4.91           6.36
Source: NCREIF

22      CBRE | Please visit our website at cbre.com/nationalseniorhousing
UNDERWRITING GUIDELINES
Because senior housing is a hybrid between multi-family and hotel property types, there is an added complexity to
the underwriting process. Unlike office, multi-family, industrial and retail, simple ARGUS or other canned models
are not conventionally used. Rather, customized Excel models are developed — adding time and complication
to the process. Below are standard assumptions that are often incorporated into underwriting models as well as
questions that underwriters should consider. These assumptions reflect the current environment.

                                                                 Assumptions based on Community / Market Conditions
                   Current Occupancy Condition                    Strong                             Good                                  Fair / Poor
Occupancy
             > 95%                                          Lease-down to 96%                  Lease-down to 95%                       Lease-down to 93%
              90-95%                                       Lease-up to 95%              Lease-up/down to 94%                    Lease-up/down to 91%
             < 90% (Initial Community Lease-up)              Lease-up to 95%              Lease-up/down to 93%                    Lease-up/down to 91%
              80% - 90% (Not initial lease-up)             Lease-up to 93%                    Lease-up to 90%                   Lease-up/down to 85%
              70% - 80% (Not initial lease-up)             Lease-up to 85%                    Lease-up to 80%                   Lease-up/down to 75%
              60% - 70% (Not initial lease-up)             Lease-up to 75%                    Lease-up to 70%                        Stabilize at current
             < 60% (Not initial lease-up)                   Stabilize at current               Stabilize at current                    Stabilize at current
Lease-Up/Down Net Units/Beds Per Month
             > 95%                                                    4                                  4                                       2
              90-95%                                                4                                  4                                       2
             < 90% (Initial Community Lease-up)                       4                                  4                                       2
              80% - 90% (Not initial lease-up)                      3                                  2                                       1
              70% - 80% (Not initial lease-up)                      3                                  2                                       1
              60% - 70% (Not initial lease-up)                      3                                  2                                       1
             < 60% (Not initial lease-up)                             3                                  2                                       1
Rate Assumptions
                                                    Yr. 1     Yr. 2   Yr. 3   Yr. 4>   Yr. 1     Yr. 2       Yr. 3    Yr. 4>   Yr. 1     Yr. 2   Yr. 3   Yr. 4>
             Current Rates                          4.5%      4.5%    4.5%    4.5%     4.0%      4.0%        4.0%     4.0%     3.0%      3.0%    3.0%    3.0%
             Street Rates                           5.0%      5.0%    5.0%    5.0%     4.5%      4.5%        4.5%     4.5%     3.5%      3.5%    3.5%    3.5%
             < 60% (Initial lease-up)               0.0%      2.5%    5.0%    5.0%     0.0%      2.0%        3.5%     4.0%     0.0%      2.0%    3.0%    3.5%

Occupancy Assumptions
P&L or Rent Roll               Always use current rent roll if the data is trusted.
Lease-Up Lag                   Should be zero months unless community specific information dictates otherwise.
                               Independent Living - 36 months; Assisted Living - 24 months; Memory Care - 20 months and Nursing Care -
Rollover
                               12 months.
Other Revenue Assumptions
Care Revenue                   Either Based on trended actuals, Operator Budget, Or Built up through Care Utilization Matrix.
New Resident Fee               Based upon actual fee received and trended forward.
Second Resident Fee            Based upon actual fee received and trended forward. Increased with in-house rents annually.
Other Revenue                  Either Based on trended actuals, Operator Budget, Or Built up Lease-Up Utilization Analysis.
Expense Assumptions
Normal Operating Expens-
                               Either Based on trended actuals, Operator Budget, Or Built up Lease-Up Utilization Analysis.
es
Utilities                      Either Based on trended actuals, Operator Budget, Or Built up Lease-Up Utilization Analysis.

Insurance (GL & Property)      Obtain current quote or base on in-place policy coverage and then grow 3.5% per year thereafter.

                               Based on current tax bill; increase 3.5% per year thereafter or as state/county dictates based on fixed annual
Property taxes
                               increases or reassessment triggered by sale.

Management Fees                5.0% of Revenue.

Capital Expenditures           $300 to $500 / unit per year.

                                                        CBRE | Please visit our website at cbre.com/nationalseniorhousing                                     23
24               Structured Debt
                  Options

            U.S. Treasury Yield Curve Rates

 5.0%

 4.0%

 3.0%

 2.0%

 1.0%

 0.0%
     2004      2005   2006     2007         2008   2009   2010       2011    2012    2013      2014       2015     2016   2017   2018

                         10 Year Treasury                 5 Year Treasury               Linear (5 Year Treasury)

        Source: U.S. Treasury (January 2, 2004 - June 26, 2018)

• The 10-year Treasury note rate is considered one of                  performance versus other commercial real estate
the major pricing benchmarks in the debt market. As                    classes, etc.). Senior housing has one of the lowest
illustrated in the chart above, the average 10-year U.S.               default rates, yet it has higher interest rate spreads. As
Treasury Yield Curve Rate ended calendar years 2015                    such, lenders have become more comfortable with the
and 2016 at 2.27% and 2.45%, respectively, with a                      nuances of the operating component of assisted living
2017 average rate of 2.33%.                                            and memory care. Note, however, that these lenders
                                                                       generally have a preference toward 100% private pay
• There was concern when interest rates spiked after the               independent living, assisted living and memory care
conclusion of the 2016 U.S. presidential election. The                 (as opposed to nursing care facilities with government
benchmark 10-year Treasury stood at 2.45% at closing                   reimbursement dependencies). Nursing care has
on December 30, 2016, up 62 basis points (“bps”)                       become generally accepted in the lending community
from Election Day on November 8, 2016. In 2017,                        if it is part of a campus (i.e. a rental continuing care
Treasuries remained flat or slightly down year over year.              retirement community with a skilled component), which
Today, the 10-year Treasury sits at 2.90% (as of June                  includes the full continuum of care.
25, 2018) and the 2018 YTD average is 2.84%.
                                                                       • A handful of life insurance companies are still quoting
• Although credit spreads remain competitive, the                      comparable spreads to the Agencies for 5, 7 and 10-year
rise in the 10-year Treasury rate by roughly 50 bps                    fixed rate mortgages (with preference towards 7 and 10-
in 2018 has undoubtedly increased debt capital costs                   year fixed-rate). Eligible product types are independent
for borrowers. Given most acquirers in the sector are                  living, assisted living and, memory care (assuming it’s
now users of secured debt, the cost of debt capital in                 a small percentage of the campus). In addition, three
a continued rising interest rate environment has begun                 to four additional insurers are comfortable lending on
to impact valuations; more significantly in the value-                 100% independent living product. Most insurers require
add space where a heavier reliance exists upon higher                  a lower LTV and larger loans ($25M+). There are one to
leverage debt.                                                         two life insurance companies with competitive floating
                                                                       rate programs, however, construction to permanent
• Over the past several years and continuing in 2018,
                                                                       programs are not currently available programmatically.
there has been a heightened awareness and interest
in senior housing from life insurance companies, other                 • The multi-family lending caps are intended to further
traditional balance sheet lenders and several new debt                 the Federal Housing Finance Agency’s (“FHFA”) strategic
providers. These lenders find the sector compelling for                goal of maintaining the Agencies (Fannie Mae and
the same reasons as equity investors (demographics,                    Freddie Mac) as a backstop for the multi-family finance

24      CBRE | Please visit our website at cbre.com/nationalseniorhousing
SENIOR HOUSING STRUCTURED DEBT OPTIONS

market without impeding the participation of private          30% to 35% cash equity (resulting in leverage of 65%
capital. For the 2018 calendar year, the Agency volume        to 70%) priced at 275 to 350 basis points over 30-day
caps were initially set at $35 billion. Important to note,    London Interbank Offered Rate (“LIBOR”). Over the past
loans in affordable and underserved market segments           18 months, non-recourse new construction financing
will operate in the same capacity in as the prior years and   (limited to completion guarantees) has become very
are excluded from the cap. If the restricted affordable       scarce, even for the highest-caliber firms with significant
housing units make up less than 50% of the total units,       track records in the space. This can be attributed to a
the FHFA will exclude 50% of the loan amount from the         number of factors including aggregate supply concerns,
cap. Also, if 50%-plus of the units are restricted units,     where we are in the current real estate cycle, and HVCRE
the FHFA will exclude the entire loan amount from the         High Volatility Commercial Real Estate (“HVCRE”)
cap. Throughout 2018, the FHFA will again review the          regulation within the Basel III capital requirements. In
Agency’s estimates of the multifamily loan origination        addition, spreads have widened 50 to 75 bps along
market size on a quarterly basis. If the FHFA determines      with increases in LIBOR rendering construction loans
that the actual 2018 market size is greater than was          approximately 100 to 150 bps more expensive today.
projected, it will apply an appropriate increase to the
capped category. If FHFA determines that the actual
2018 market size is smaller than was projected, it will not
reduce the capped category. Overall, the volume caps
imposed are not impacting the lending climate today the
same way that they did when first implemented in 2015.

• Offering floating rate mortgages with interest rate
spreads lower than any balance sheet lenders, the
Agencies continue to offer the lowest cost floating rate
debt in the sector. However, many regional and national
banks offer competitive floating rate programs with three
to five-year terms and competitive interest only periods.

• New bridge and mezzanine lending sources for non-
stabilized communities have favorably emerged in this
sector. Many of these bridge financing sources are
priced between 100 to 300 basis points above Agency
floating rate spreads. Bridge lenders include select
traditional banks (both national and regional) and other
specialized higher yield financial investment firms. Non-
recourse bridge financing is available for experienced
and strong borrowers at leverage levels up to 80%.

• Construction debt is primarily available through
traditional HUD loans, regional banks, local banks
(particularly for smaller deals when an established
relationship between the borrower and lender exists), and
on a very limited basis, through life insurance companies
via construction to permanent loan programs. Many
larger national banks are also providing construction
debt. Strong borrowers with a strong track record,
evidenced by stabilized portfolios producing solid
overall cash flows, might expect partial recourse with

                                              CBRE | Please visit our website at cbre.com/nationalseniorhousing       25
26            About CBRE National
              Senior Housing
CBRE National Senior Housing is a fully integrated           on senior housing, providing a range of services. We
platform of professionals dedicated to the senior            provide investment opportunities to the marketplace
housing industry. The platform consists of four separate     across a broad spectrum of senior housing property
and distinct concentrations: investment sales, debt and      types including:
structured finance, investment banking, and valuation.
Our investment sales team has successfully transacted        • Age-Restricted Multi-family
on over $17 billion in property sales dating back to 1998;   • Independent Living
our average annual sales volume since 2014 exceeds           • Assisted Living
$1.4 billion. The Team offers a depth of expertise rarely    • Alzheimer’s/Memory Care
found in the senior housing sector. Its partners: Lisa       • Skilled Nursing and Continuum of Care
Widmier, Matthew Whitlock and Aron Will possess a            • Entry Fee CCRC Communities
combined 61-year senior housing-specific industry
experience and $28.9 billion in transaction volume.          Our services include:
Our experience personally as developers, institutional       • Investment Property Sales
investors, appraisers and owner/operators provides           • Structured Debt
us with an intimate familiarity and perspective of a         • Investment Banking
transaction from all sides.                                  • Valuation
                                                             • General Consulting
CBRE National Senior Housing focuses exclusively

26    CBRE | Please visit our website at cbre.com/nationalseniorhousing
OUR NATIONAL PRESENCE
CBRE has assembled a fully integrated Team with the requisite experience, expertise, and successful track record
necessary to successfully structure and execute a transaction to meet the Client’s objectives.

             820+ Communities
                     110,000 Units/Beds
                                    45 States
                        WA

                                                                                                                                                           ME
                                              MT                  ND

                   OR                                                          MN                                                                VT
                                                                                                                                                      NH
                                 ID                                                                                                        NY
                                                                                           WI                                                         MA
                                                                  SD
                                                WY                                                          MI                                        CT RI

                                                                                 IA                                                   PA
                                                                  NE
                         NV                                                                                                                     NI
                                                                                                                      OH               MD       DE
                                                                                                IL     IN
                                       UT
                                                   CO                                                                       WV
                                                                        KS                                                            VA
                                                                                      MO
                  CA                                                                                             KY

                                                                                                                                      NC
                                                                                                            TN
                                  AR                                     OK
                                                   NM                                 AR                                     SC

                                                                                                        AL             GA
                                                                                                MS

                                                                   TX                 LA

                                                                                                                                 FL

                   CBRE National Senior Housing Offices:
                   San Diego, Houston and Boston
                   States where CBRE Team Members have conducted business

                        IN PROCESS                         TOTAL COMPLETED                                      DEBT
                           2018                               2014-2017                                     ORIGINATIONS

                       $3.5B                               $10.1B                                           TOP 2
                   CBRE National Senior                       Principals of the CBRE                      CBRE National Senior
                   Housing has closed, is                    National Senior Housing                      Housing was ranked
                   actively marketing, or                  team completed more than                     Top Two Senior Housing
                     is under contract on                  $10 billion in senior housing                Originator in the nation
                  $2.3 billion of sales and                 investment sales and debt                  from 2010 through 2016,
                     investment banking                    transactions between 2014                     and was the #1 Senior
                transactions encompassing                    and 2017 encompassing                      Housing/Age Restricted
                 nearly 6,500 units across                   more than 46,000 units                     Originator in the U.S in
                 the U.S. In addition, CBRE                         nationwide.                        both 2013 and 2014 and
                  National Senior Housing                                                                #2 in 2015. The team
                     has closed or has in                                                              originated $3.7 billion in
                process approximately $1.2                                                             debt transactions over the
                billion of debt originations.                                                               past three years.
                                                                                                      CBRE is the largest agency
                                                                                                      originator (Fannie/Freddie)
                                                                                                     in the nation with over $18B
                                                                                                      of loan volume in 2017 and
                                                                                                      has been Freddie Mac’s #1
                                                                                                       Seller Servicer from 2009
                                                                                                                to 2017.

                                                        CBRE | Please visit our website at cbre.com/nationalseniorhousing                                       27
A PARTIAL LIST OF SIGNIFICANT ASSIGNMENTS
  Sales Assignments                                     ​Consideration                           Units​​
 Vintage Portfolio (22)                                $1.3 Billion                             3,055
​The Sunwest Portfolio                                ​$1.25 Billion                           ​11,100
Maestro Portfolio                                     $921 Million                             ​ ,206
                                                                                               8
The Fountains Portfolio                               $640 Million                             3,637
​Brightview I Portfolio                               ​$498.5 Million                          ​1,584
 ​ rightview II Portfolio
 B                                                     ​ 363.5 Million
                                                       $                                        ​ ,117
                                                                                                1
​The Bristal Portfolio                                ​$290 Million                            ​931
​ ramerica-Sunrise UK Portfolio
P                                                     ​ 247 Million
                                                      $                                         ​ 37
                                                                                                4
Pacifica Portfolio                                    $187.7 Million                           ​720
LCS CCR Portfolio                                     $186.5 Million                            1,104
7 Community AL/MC Portfolio                           $186.3 Million                           ​526
​5 Community Allegro Portfolio                        ​$172.5 Million                          ​705
L​ ang Nelson Portfolio                               ​ 127 Million
                                                      $                                         ​ ,166
                                                                                                1
Ventas Portfolio                                      $121.2 Million                           ​1,295
 7 Community AL/MC Portfolio                           $120.7 Million                           ​ 00
                                                                                                5
​Baynorth/Watermark Portfolio                         ​$114.5 Million                          ​496
​ BK California Portfolio
M                                                     $104.5 Million                           ​ 93
                                                                                               2
3 Community IL/AL/MC Portfolio                        $101.7 Million                           310

 Debt Assignments                           Loan Amount      ​ nits
                                                             U             ​ urpose
                                                                           P                            Lender
The Fountains Portfolio                    $410.0 Million    3,663        Sale & Acquisition           Agency
Ranger 36 Portfolio                        $348.6 Million    2,524        Refinance                    Agency
Credit Facility                            $271.3 Million    1,258        Acquisition                  Agency
Two Community CA and AZ Portfolio          $80.0 Million     275          Acquisition                  Life Co.
Regency Oaks of Clearwater                 $75.0 Million     471          Refinance                    Agency
Bonaventure Portfolio                      $72.5 Million     453          Acquisition                  Agency
CSH Seattle Portfolio                      $60.0 Million     368          Acquisition                  Bank
Cascade Portfolio                          $58.5 Million     469          Refinance                    Agency
The Village of Woodlands Waterway          $55.2 Million     207          Sale & Acquisition           Agency
MorningStar Portfolio                      $53.0 Million     196          Sale & Acquisition           Finance Co.
The Arbor Terrace Portfolio- GA 2          $50.5 Million     236          Sale & Acquisition           Agency
The Village at River Oaks                  $49.7 Million     195          Construction                 Bank
The Cornerstone Portfolio                  $49.6 Million     172          Acquisition                  Life Co.
The Golden Pond Portfolio                  $48.5 Million     578          Sale & Acquisition           Finance Co.
Georgetown Development                     $41.9 Million     210          Construction                 Other
The Springs at Greer Gardens               $40.1 Million     217          Construction                 Bank
Franklin Park at Alamo Heights             $40.0 Million     220          Construction                 Bank

“   CBRE SH recently closed a $186.5 million senior housing portfolio transaction with first-time Middle
      Eastern capital. This transaction is yet another example of how CBRE can deliver superior results
    for its clients. Collaboration among four different CBRE practices – Investment Properties, Debt and
 Structured Finance, Investment Banking, and Valuation and Advisory Services – made this highly complex
 transaction possible, allowed for the existing operator to remain, and also expedited the closing process.
                                                                                                                  “
28    CBRE | Please visit our website at cbre.com/nationalseniorhousing
You can also read