The Deliberate Depression - LEBANON ECONOMIC MONITOR - World Bank Document
←
→
Page content transcription
If your browser does not render page correctly, please read the page content below

Public Disclosure Authorized   Public Disclosure Authorized        Public Disclosure Authorized   Public Disclosure Authorized

                                                                                                                                     LEBANON

                                                                                                                                     MONITOR
                                                                                                                                    ECONOMIC
                                                                                                                            The
                                                                                                                            Deliberate

                                                                                             Fall 2020
                                                                                                                            Depression

Middle East and North Africa Region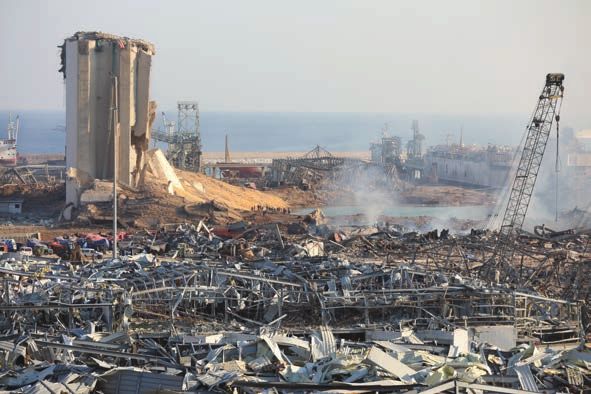
Lebanon
    Economic Monitor
          The Deliberate Depression

                        Fall 2020

Global Practice for Macroeconomics, Trade & Investment
          Middle East and North Africa Region

LEBANON ECONOMIC
         MONITOR
                 Document of the World Bank
                                                   The Delibera
                                                       Depressi

TABLE OF CONTENTS
Preface . . . . . . . . . . . . . . . . . . . . . . . . . . . . . . . . . . . . . . . . . . . . . . . . . . . . . . . . . . . . . vii
Executive Summary . . . . . . . . . . . . . . . . . . . . . . . . . . . . . . . . . . . . . . . . . . . . . . . . . . . . . . ix
الموجز التنفيذي . . . . . . . . . . . . . . . . . . . . . . . . . . . . . . . . . . . . . . . . . . . . . . . . . . . . . . . xiii
1. The Policy Context . . . . . . . . . . . . . . . . . . . . . . . . . . . . . . . . . . . . . . . . . . . . . . . . . . . . 1
2. Recent Macro-Financial Developments . . . . . . . . . . . . . . . . . . . . . . . . . . . . . . . . . . . . . . . . 3
Output and Demand . . . . . . . . . . . . . . . . . . . . . . . . . . . . . . . . . . . . . . . . . . . . . . . . . . . . . . . . . . . . . . . . . . . . . . . . . . .3
Fiscal Developments . . . . . . . . . . . . . . . . . . . . . . . . . . . . . . . . . . . . . . . . . . . . . . . . . . . . . . . . . . . . . . . . . . . . . . . . . . 6
Money and Banking . . . . . . . . . . . . . . . . . . . . . . . . . . . . . . . . . . . . . . . . . . . . . . . . . . . . . . . . . . . . . . . . . . . . . . . . . . .8
The Average Exchange Rate . . . . . . . . . . . . . . . . . . . . . . . . . . . . . . . . . . . . . . . . . . . . . . . . . . . . . . . . . . . . . . . . . . 10
Pass Through Effects on Prices . . . . . . . . . . . . . . . . . . . . . . . . . . . . . . . . . . . . . . . . . . . . . . . . . . . . . . . . . . . . . . . . 11
The External Sector . . . . . . . . . . . . . . . . . . . . . . . . . . . . . . . . . . . . . . . . . . . . . . . . . . . . . . . . . . . . . . . . . . . . . . . . . . 13
3. Global Crises Comparators: Fundamentals Matter . . . . . . . . . . . . . . . . . . . . . . . . . . . . . . . .15
Output . . . . . . . . . . . . . . . . . . . . . . . . . . . . . . . . . . . . . . . . . . . . . . . . . . . . . . . . . . . . . . . . . . . . . . . . . . . . . . . . . . . . . .15
Inflation . . . . . . . . . . . . . . . . . . . . . . . . . . . . . . . . . . . . . . . . . . . . . . . . . . . . . . . . . . . . . . . . . . . . . . . . . . . . . . . . . . . . .17
Fiscal . . . . . . . . . . . . . . . . . . . . . . . . . . . . . . . . . . . . . . . . . . . . . . . . . . . . . . . . . . . . . . . . . . . . . . . . . . . . . . . . . . . . . . .17
Debt . . . . . . . . . . . . . . . . . . . . . . . . . . . . . . . . . . . . . . . . . . . . . . . . . . . . . . . . . . . . . . . . . . . . . . . . . . . . . . . . . . . . . . . 18
External Position . . . . . . . . . . . . . . . . . . . . . . . . . . . . . . . . . . . . . . . . . . . . . . . . . . . . . . . . . . . . . . . . . . . . . . . . . . . . .18
Overall . . . . . . . . . . . . . . . . . . . . . . . . . . . . . . . . . . . . . . . . . . . . . . . . . . . . . . . . . . . . . . . . . . . . . . . . . . . . . . . . . . . . . 19
4. Outlook and Risks . . . . . . . . . . . . . . . . . . . . . . . . . . . . . . . . . . . . . . . . . . . . . . . . . . . . .21
Special Focus: A Reform Agenda to Turn the Country Around – Proposal for Discussion . . . . . . . . . .27
Governance Failure and Causes of Policy Inaction . . . . . . . . . . . . . . . . . . . . . . . . . . . . . . . . . . . . . . . . . . . . . . . . 28
A Reform Agenda for Stabilization, Economic Efficiency and Restoration of Trust . . . . . . . . . . . . . . . . . . . . .29
Pillar I: Macroeconomic Stabilization: A Necessary, But Not Sufficient, Condition to Growth . . . . . . . . . . . . 32
Pillar II: A Governance and Accountability Reform Package . . . . . . . . . . . . . . . . . . . . . . . . . . . . . . . . . . . . . . . . 36
Pillar III: Infrastructure Development Reform Package . . . . . . . . . . . . . . . . . . . . . . . . . . . . . . . . . . . . . . . . . . . . .40
iii
Pillar IV: An Economic Opportunities Reform Package  . . . . . . . . . . . . . . . . . . . . . . . . . . . . . . . . . . . . . . . . . . . . 44
             Pillar V: A Human Capital Development Reform Package . . . . . . . . . . . . . . . . . . . . . . . . . . . . . . . . . . . . . . . . . .46

     Annex  .  .  .  .  .  .  .  .  .  .  .  .  .  .  .  .  .  .  .  .  .  .  .  .  .  .  .  .  .  .  .  .  .  .  .  .  .  .  .  .  .  .  .  .  .  .  .  .  .  .  .  .  .  .  .  .  .  .  .  .  .  . 61
        Key BdL Circulars since October 2019 . . . . . . . . . . . . . . . . . . . . . . . . . . . . . . . . . . . . . . . . . . . . . . . . . . . . . . . . . .61
        Monetary and Exchange Rate Policies . . . . . . . . . . . . . . . . . . . . . . . . . . . . . . . . . . . . . . . . . . . . . . . . . . . . . . . . . . 61
        Socio-Economic Support . . . . . . . . . . . . . . . . . . . . . . . . . . . . . . . . . . . . . . . . . . . . . . . . . . . . . . . . . . . . . . . . . . . . . .62
        Banking Sector Regulations . . . . . . . . . . . . . . . . . . . . . . . . . . . . . . . . . . . . . . . . . . . . . . . . . . . . . . . . . . . . . . . . . . .63
        Averaging Lebanon’s Multiple Exchange Rates  . . . . . . . . . . . . . . . . . . . . . . . . . . . . . . . . . . . . . . . . . . . . . . . . . . 64
        VAR Estimations of Impact of Currency Devaluations on Economic Activity. . . . . . . . . . . . . . . . . . . . . . . . . . .65
        Global Financial Crises Episodes . . . . . . . . . . . . . . . . . . . . . . . . . . . . . . . . . . . . . . . . . . . . . . . . . . . . . . . . . . . . . . .66
        The Asian Financial Crisis of 1997–98 . . . . . . . . . . . . . . . . . . . . . . . . . . . . . . . . . . . . . . . . . . . . . . . . . . . . . . . . . . 66
        The Argentinian Financial Crisis of 2001–02 . . . . . . . . . . . . . . . . . . . . . . . . . . . . . . . . . . . . . . . . . . . . . . . . . . . . .67
        The Iceland Financial Crisis of 2008 . . . . . . . . . . . . . . . . . . . . . . . . . . . . . . . . . . . . . . . . . . . . . . . . . . . . . . . . . . . . 68
        Crises in the European Monetary Union 2008–13  . . . . . . . . . . . . . . . . . . . . . . . . . . . . . . . . . . . . . . . . . . . . . . . . 69
          The Irish Financial Crisis of 2008 .  .  .  .  .  .  .  .  .  .  .  .  .  .  .  .  .  .  .  .  .  .  .  .  .  .  .  .  .  .  .  .  .  .  .  .  .  .  .  .  .  .  .  .  .  .  .  .  .  .  .  .  .  .  .  .  .  .  . 70
          The Greece Financial Crisis of 2009  .  .  .  .  .  .  .  .  .  .  .  .  .  .  .  .  .  .  .  .  .  .  .  .  .  .  .  .  .  .  .  .  .  .  .  .  .  .  .  .  .  .  .  .  .  .  .  .  .  .  .  .  .  .  .  . 70
          The Cyprus Financial Crisis of 2011–13 .  .  .  .  .  .  .  .  .  .  .  .  .  .  .  .  .  .  .  .  .  .  .  .  .  .  .  .  .  .  .  .  .  .  .  .  .  .  .  .  .  .  .  .  .  .  .  .  .  .  .  .  . 72

     List of Figures
        Figure 1 While the Contraction in Real GDP Commenced in 2018, It Is Heavily Concentrated in 2020  . . . 4
        Figure 2 Net Exports Are Expected To Be the Sole Positive Contributor to Real GDP . . . . . . . . . . . . . . . . . . 4
        Figure 3	Large Shortfalls in Revenues Will Induce a Significant Deterioration in the Fiscal Position . . . . . . 7
        Figure 4	Valuation Effects from Exchange Rate Depreciations Will Pressure the Debt-to-GDP Ratio . . . . . .7
        Figure 5 Triple-Digit Inflation Rates Driven by Basic Consumption Items  . . . . . . . . . . . . . . . . . . . . . . . . . . . . . 8
        Figure 6	Heavy Deleveraging of Assets (private loans) and Liabilities (private deposits) in
                   Financial Sector . . . . . . . . . . . . . . . . . . . . . . . . . . . . . . . . . . . . . . . . . . . . . . . . . . . . . . . . . . . . . . . . . . . . . .9
        Figure 7	A Steady and Sharp Deterioration in Credit Performance as Measure by NPL Ratio for Banks 10
        Figure 8	AER Simulations under Assumption of Stability of Black-Market Rate by end-2020 . . . . . . . . . . . 11
        Figure 9	AER Simulations under Assumption of Instability of Black-Market Rate through 2021 . . . . . . . . .11
        Figure 10	Under Sc1a, the Inflation Rate Abates toward the End of 2021, Whereas … . . . . . . . . . . . . . . . . . .12
        Figure 11	... in Sc1b, It Remains Elevated Driven by the Continued Depreciation of the Exchange Rate 12
        Figure 12	CPI-Parallel Exchange Rate Pass through at 30 Percent for Upper Middle-Income Countries 13
        Figure 13	CPI-Parallel Exchange Rate Pass through at 67 Percent for Lower Income Countries . . . . . . . . . 13
        Figure 14	A Steady Depletion in the Gross Foreign Exchange Position at BdL . . . . . . . . . . . . . . . . . . . . . . . . 14
        Figure 15	Ratios of C1, C2 Luxury and other Imports Were Stable until Period Leading to Crisis …  . . . . . . 14
        Figure 16	… when Ratios of C1 and C2 Imports, Rose at the Expense of those for Luxury and
                   other Goods . . . . . . . . . . . . . . . . . . . . . . . . . . . . . . . . . . . . . . . . . . . . . . . . . . . . . . . . . . . . . . . . . . . . . . . . 14
        Figure 17	Real GDP for G1 Global Crises Comparators  . . . . . . . . . . . . . . . . . . . . . . . . . . . . . . . . . . . . . . . . . . . 16
        Figure 18	Real GDP for G2 Global Crises Comparators  . . . . . . . . . . . . . . . . . . . . . . . . . . . . . . . . . . . . . . . . . . . 16
        Figure 19	CPI Indices for G1 Global Crises Comparators . . . . . . . . . . . . . . . . . . . . . . . . . . . . . . . . . . . . . . . . . . 17
        Figure 20	CPI Indices for G2 Global Crises Comparators . . . . . . . . . . . . . . . . . . . . . . . . . . . . . . . . . . . . . . . . . . 17
        Figure 21	Overall Fiscal Balance for G1 Global Crises Comparators  . . . . . . . . . . . . . . . . . . . . . . . . . . . . . . . . 18
        Figure 23	Gross Debt for G1 Global Crises Comparators . . . . . . . . . . . . . . . . . . . . . . . . . . . . . . . . . . . . . . . . . . 18
        Figure 22	Overall Fiscal Balance G2 Global Crises Comparators  . . . . . . . . . . . . . . . . . . . . . . . . . . . . . . . . . . . 18

iv   LEBANON ECONOMIC MONITOR: THE DELIBERATE DEPRESSION
Figure 24 Gross Debt for G2 Global Crises Comparators . . . . . . . . . . . . . . . . . . . . . . . . . . . . . . . . . . . . . . . . . . 18
Figure 25 Current Account Balance for G1 Global Crises Comparators . . . . . . . . . . . . . . . . . . . . . . . . . . . . . .19
Figure 26 Current Account Balance for G2 Global Crises Comparators . . . . . . . . . . . . . . . . . . . . . . . . . . . . . 19
Figure 27 Main Reasons Why Accessing Food and other Basic Needs Was Challenging,
July–August 2020 . . . . . . . . . . . . . . . . . . . . . . . . . . . . . . . . . . . . . . . . . . . . . . . . . . . . . . . . . . . . . . . . . . .23
Figure 28 Labor Force Participation Status in August 2020 and pre Lockdown (Feb 2020) . . . . . . . . . . . . .23
Figure 29 Main Income Sources Over the Past 12 Months in July . . . . . . . . . . . . . . . . . . . . . . . . . . . . . . . . . . . 23
Figure 30 Reform Pillars . . . . . . . . . . . . . . . . . . . . . . . . . . . . . . . . . . . . . . . . . . . . . . . . . . . . . . . . . . . . . . . . . . . . . . .29
List of Tables
Table 1 MIDAS Forecasts for 2020 and 2021 Real GDP Growth for Baseline and COVID-19 Scenarios . 5
Table 2 Selected Macroeconomic Indicators for Lebanon; 2015–2021 . . . . . . . . . . . . . . . . . . . . . . . . . . . . 25
Table 3 High Priority: 7-Actions, 5-Programs and 3-Reviews . . . . . . . . . . . . . . . . . . . . . . . . . . . . . . . . . . . . . .31
Table 4 Empirical Evidence Behind Lebanon’s Pre-Crisis Economic Slowdown . . . . . . . . . . . . . . . . . . . . . 36
Table 5 Summary of Reform Matrix, by Pillar . . . . . . . . . . . . . . . . . . . . . . . . . . . . . . . . . . . . . . . . . . . . . . . . . . . 50
Table 6 VAR Results on the Impact of Currency Devaluations on Main Economic Variables. . . . . . . . . . .66
List of Boxes
Box 1. Nowcasting and Forecasting Economic Activity . . . . . . . . . . . . . . . . . . . . . . . . . . . . . . . . . . . . . . . . . . . . . . .5
Box 2. Results from m-VAM Vulnerability and Food Security Assessment . . . . . . . . . . . . . . . . . . . . . . . . . . . . . .23
TABLE OF CONTENTS vPREFACE
T
he Lebanon Economic Monitor provides prepared the Special Focus , based on contributions
an update on key economic developments from the Lebanon Country Team. The Lebanon
and policies over the past six months. It also Economic Monitor has been completed under the
presents findings from recent World Bank work on guidance of Eric Le Borgne (Practice Manager).
Lebanon. It places them in a longer-term and global Zeina Khalil (Communications Officer) is the lead on
context and assesses the implications of these communications, outreach and publishing.
developments and other changes in policy on the The findings, interpretations, and conclusions
outlook for Lebanon. Its coverage ranges from the expressed in this Monitor are those of World Bank
macro-economy to financial markets to indicators of staff and do not necessarily reflect the views of the
human welfare and development. It is intended for a Executive Board of The World Bank or the govern-
wide audience, including policy makers, business ments they represent.
leaders, financial market participants, and the For information about the World Bank and its
community of analysts and professionals engaged in activities in Lebanon, including e-copies of this publi-
Lebanon. cation, please visit www.worldbank.org.lb.
The Lebanon Economic Monitor is a product To be included on an email distribution list
of the World Bank’s Lebanon Macroeconomics, for this Lebanon Economic Monitor series and
Trade and Investment (MTI) team. It was prepared by related publications, please contact Alain Barakat
Wissam Harake (Senior Economist), Ibrahim Jamali (abarakat@worldbank.org). For questions and com-
(Consultant) and Naji Abou Hamde (Economic ments on the content of this publication, please
Analyst) with contributions from Lars Jessen (Lead contact Wissam Harake (wharake@worldbank.org)
Debt Specialist) and Haocong Ren (Senior Financial or Christos Kostopoulos (ckostopoulos@worldbank.
Sector Economist). Christos Kostopoulos (Lead org). Questions from the media can be addressed to
Economist) and Mohammad Al Akkaoui (Consultant) Zeina Khalil (zelkhalil@worldbank.org).
viiEXECUTIVE SUMMARY
F
or almost a year, Lebanon’s macroeconomy supply chain. Foreign exchange (FX) shortages are
has been assailed by compounded being reflected in a multiple exchange system that
crises, beginning with an economic and has discounted the Lebanese Lira (LL) by as much
financial crisis, followed by COVID-19 and lastly as 80 percent, albeit with heavy fluctuations. The
the explosion at the Port of Beirut. By October Eurobond default precludes access to international
2019, the economy plunged into a financial crisis markets for foreign financing, while the domestic
brought about by a sudden stop in capital inflows, banking system is severely impaired. Informal and
which precipitated systemic failures across banking, ad hoc capital controls have implied a lack of harmo-
debt and the exchange rate.1 This included, on nization of restrictions between banks, and between
March 7, 2020, a Government default on a $1.2 customers within and across banks, generating
billion Eurobond redemption, marking the first ever considerable popular backlash against banks and
sovereign default for Lebanon. Eleven days later, the the central bank, the Banque du Liban (BdL).
Government declared a State of General Mobilization Real GDP growth is projected to sharply
imposing a lockdown to counter COVID-19, including decelerate to –19.2 percent in 2020, on the
the closure of the borders (airport, sea and land), and back of a –6.7 percent contraction in 2019. In
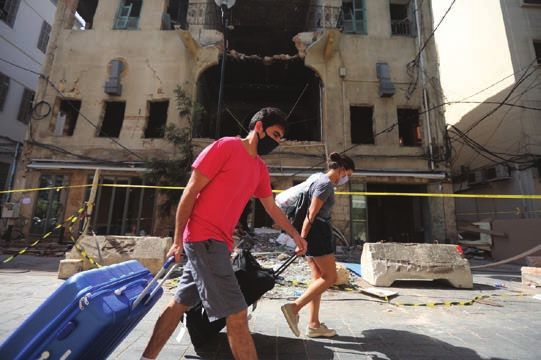
public and private institutions. Lastly, on August 4, a large part due to COVID-19, the tourism sector
2020, a massive explosion rocked the Port of Beirut has been particularly hit; tourist arrivals fell by 71.5
(PoB), destroying much of the port and severely percent, year-on-year (yoy), over the first five months
damaging the dense residential and commercial of 2020 (5M-2020). Further, the BLOM-PMI index,
areas within 1- to 2-mile radius. Beyond the human which captures private sector activity, averaged 40.4
tragedy, the economic impact of the explosion is over January–September 2020 (9M-2020) (suffered yoy declines of 60 and 52 percent, respec- In the lead up to the economic crisis point,
tively, in the first half of 2020 (H1-2020). Lebanon’s macroeconomic fundamentals were
Crises conditions have weighed heavily weak compared to select groups of global crises
on Lebanon’s already precarious fiscal position. comparators.2 As such, we expect the adjustment
Revenues are expected to decline sharply as both process to be more painful and to take longer, even
tax and non-tax revenues tumble due to the sharp with optimal policy measures in place. In fact, one
contraction in economic activity. However, this is year into the economic crisis, such policies have
more than offset by a sharp decline in interest expen- not yet been decided, let alone implemented, which
ditures, driven by Government’s arrest of payment on further pushes out the expected bottoming out of the
its commercial foreign debt (a major share of its total economy and its recovery. Therefore, and as things
expenditure), and a favorable deal with the central stand, Lebanon’s economic crisis is likely to be both
bank to halt coupon payments on Treasury bonds deeper and longer than most economic crises.
held by the latter. Overall, in 2020, the fiscal balance The burden of the ongoing adjustment/
is projected to improve by 4.7 percentage points deleveraging in the financial sector is highly
(pps) to reach –5.9 percent of GDP. regressive, concentrated on smaller depositors,
Exchange rate pass through effects on the local labor force and smaller businesses. De
prices have led to high inflation. The 12-month facto lirafication and haircuts on dollar deposits are
inflation rate has risen steadily and sharply from 10 ongoing despite BdL’s and banks’ official commit-
percent in January 2020, to 46.6 percent in April, 89.7 ment to safeguarding deposits. The burden of the
percent in June, and most recently in August, 120 ongoing adjustment/deleveraging is regressive and
percent. Inflation is a highly regressive tax, affecting concentrated on the smaller depositors, who lack
the poor and vulnerable disproportionately, as well as other source of savings, the local labor force, that
people on fixed income, such as pensioners. is paid in LL, and smaller businesses. The banking
The sharp economic contraction implied sector is advocating for mechanisms that incorporate
a commensurate drop in imports, and conse- state owned assets, gold reserves, and public real
quently, an anticipated narrowing of the current estate in order to overhaul their impaired balance
account deficit. During the first eight months of sheets. This constitutes a bailout of the financial sector
2020 (8M-2020), merchandize imports shrank by 50 and is inconsistent with the restructuring principles
percent, which drove a 59 percent decrease in the that protect taxpayers. These principles include bail
trade-in-goods deficit. We expect the current account in solutions based on a hierarchy of creditors, starting
deficit to contract, falling by 7 pps to reach 14.4 with banks shareholders. Government can also apply
percent of GDP in 2020, compared to a medium-term a wealth tax (on financial and real assets) as a tool to
(2013–2018) average deficit of 22.8 percent of GDP. progressively restructure the financial sector.
Nonetheless, the sudden stop in capital inflows has The LEM Special Focus presents one
implied a steady depletion of FX reserves at BdL, approach to designing a comprehensive reform
which will further exacerbate constraints on imports. agenda aimed at addressing the root causes of
Poverty in Lebanon is likely to continue
to worsen, surpassing half of the population
by 2021. A contraction of the Lebanese GDP per 2
We compare Lebanon’s macroeconomic fundamentals
capita in real terms and two-digit inflation in 2020 will to two groups of global crises comparators: group 1
undoubtedly result in substantial increase in poverty (G1) includes the Asian crisis countries of 1997-98:
Thailand, Malaysia, Indonesia, Philippine and South
rates affecting all groups of population in Lebanon
Korea; group 2 (G2) assembles a more eclectic set of
through different channels such as loss of productive crises that occurred in the 2000’s: Argentina (2001),
employment, decline in real purchasing power, stalled Greece (2008), Ireland (2008), Iceland (2008) and
international remittances and so forth. Cyprus (2012).
x LEBANON ECONOMIC MONITOR: THE DELIBERATE DEPRESSIONthe economic crisis. The purpose of the reform macroeconomic stabilization. The reform agenda
agenda is to help set the stage for a more equi- presented is meant to feed into an open discussion
table, more efficient and more resilient economy. among the citizens of Lebanon and between them
It puts governance reforms at the fore, alongside and their government.
Executive Summary xiالموجز التنفيذي
مم أثار غض ًبا شعب ًيا واسع النطاق ضد املصارف التجارية عىل عمالئهاّ ، عام تقري ًبا،
تع َّرض االقتصاد الكيل يف لبنان ألزمات مضاعفة عىل مدى ٍ
ومرصف لبنان املركزي. بد ًءا من األزمة االقتصاديّة واملال ّية ،مرو ًرا بجائحة كوفيد ،-19وصوالً إىل
يُتوقَّع أن يرتاجع منو إجاميل الناتج املحيل الفعيل بشكل كبري إىل إنفجار مرفأ بريوت .بحلول ترشين األول/أكتوبر ،2019غرق االقتصاد يف
-19.2يف املئة يف العام 2020إثر انقباض قدره -6.7يف املئة يف العام .2019 مم سبّب أزمة مالية بسبب التوقّف املفاجئ يف تدفقّات رؤوس األموالّ ،
تأث ّر قطاع السياحة بشكل خاص ،بسبب جائحة كوفيد -19بشكل كبري؛ فرتاجع إخفاقًا نظام ًيا شامالً يف مجال سعر الرصف ،والدين ،والقطاع املرصيف 3.يف
عدد املسافرين الوافدين إىل لبنان بنسبة 71.5يف املئة ،عىل أساس سنوي، هذا السياق ،أعلنت الحكومة يف 7آذار/مارس ،عن عدم سداد سندات
خالل األشهر الخمسة األوىل من العام .)5M-2020( 2020إىل ذلك ،س ّجل مم شكّل أول عجز اليوروبوندز البالغة قيمتها 1.2مليار دوالر أمرييكّ ،
مؤش مديري املشرتيات التابع لبنك لبنان واملهجر ( )BLOM-PMIالذي ّ عن سداد الديون السيادية يف تاريخ لبنان .بعد مرور 11يو ًما ،أعلنت
يعكس نشاط القطاع الخاص متوسطاً قدره 40.4يف فرتة كانون الثاين/يناير – الحكومة حالة تعبئة عامة وفرضت إغالقًا تا ًما ملكافحة جائحة كوفيد،-19
أيلول/سبتمرب ( )9M-2020( 2020تشكّل نسبة دون 50تراج ًعا يف النشاط)، مبا يف ذلك إغالق الحدود (الجويّة ،والبحريّة ،والربيّة) واملؤسسات العامة
وهي أدىن نسبة ُمس ّجلة .يف موازاة ذلك ،تع ّرضت تراخيص البناء وعمل ّيات والخاصة .وأخ ًريا ،يف 4آب/أغسطس ،2020ه ّز انفجار ضخم مرفأ بريوت،
تسليم االسمنت ،وهي من مؤرشات أنشطة البناء ،إىل تراجع سنوي قدره مد ّم ًرا الجزء األكرب من املرفأ وملحقًا أرضا ًرا جسيم ًة يف املناطق السكنيّة
60و 52يف املئة عىل التوايل ،يف النصف األول من العام .)H1–2020( 2020 والتجاريّة الواقعة يف نطاق دائرة يبلغ شعاعها ميالً إىل ميلني من موقع
أرخت األزمات املتعاقبة بظاللها عىل الوضع املايل ّ
الهش أصالً يف االنفجار .باإلضافة إىل املأساة البرشيّة ،يُعترب األثر االقتصادي لالنفجار
لبنان .ويُتوقَّع أن ترتاجع االيرادات بشكل حاد ،مبا أن االيرادات الرضيب ّية ملحوظًا عىل املستوى الوطني بالرغم من متركزه الجغرايف.
وااليرادات غري الرضيبيّة ترتاجع بسبب االنقباض الحاد يف النشاط من األزمات الثالث التي تع ّرض لبنان لها ،كانت األزمة
االقتصادي .لكن ،ع ّوض عن ذلك تراجع حاد يف نفقات الفائدة ،بسبب سلبية وخطورةً .ففي اقتصاد مدولر ً االقتصاديّة ذات األثر األكرب واألكرث
توقّف الحكومة عن سداد ديونها األجنبيّة التجارية (وهي حصة كبرية من بشكل كبري ،تخنق ضغوط سوق الرصف متويل املؤسسات والتجارة ،
إجاميل نفقاتها) واتفاق تفضييل مع املرصف املركزي إليقاف سداد الفوائد مم يفرض قيودًا عىل استرياد السلع الرأسامل ّية والسلع النهائ ّية ويس ّبب ّ
عىل سندات الخزينة التي بحوزة املرصف .بشكل عام ،يف العام ،2020 اضطرابات عىل طول سلسلة اإلمداد .وتنعكس حاالت قصور العمالت
يتحسن الرصيد املايل بنسبة 4.7نقاط مئويّة لببلغ -5.9يف املئةيُتوقَّع أن ّ الصعبة يف نظام رصف متع ّدد أفقد اللرية اللبنان ّية 80يف املئة من
من إجاميل الناتج املحيل. قيمتها ،وإن كانت التقلّبات كبرية .ونظ ًرا إىل تخلف الحكومة عن سداد
أدّى انتقال تغريات سعر الرصف إىل األسعار إىل ارتفاع التضخّم. سندات اليوروبوندز ،مل يعد باإلمكان الحصول عىل التمويل األجنبي
ازداد مع ّدل التضخّم عىل مدى 12شه ًرا بشكل ثابت وحاد ،فارتفع من عن طريق األسواق الدوليّة ،بينام النظام املرصيف املحيل مشلول إىل
10يف املئة يف كانون الثاين/يناير 2020إىل 46.6يف املئة يف نيسان/أبريل ح ّد بعيد .كام ولّدت القيود الرأسامل ّية غري الرسم ّية غياب االتساق
وإىل 89.7يف املئة يف حزيران/يونيو ،ومؤ ّخ ًرا إىل 120يف املئة يف آب/ بني املصارف (وحتى بني فروع املرصف الواحد) يف القيود املفروضة
عتب التضخّم رضيبة تنازل ّية إىل ح ّد كبري ،تؤث ّر عىل الفقراء
أغسطس .يُ َ
بشكل كبري ،كام عىل ذوي الدخل الثابت ،عىل غرار املتقاعدين.
يرتتب عن اإلنكامش اإلقتصادي الحاد انخفاضاً متناسباً يف 3نُشري بالتايل إىل هذه االخفاقات املنهج ّية الشاملة يف املجال املاكرو مايل
الواردات ،وبالتايل ،تراج ًعا متو ّق ًعا يف عجز الحساب الجاري .خالل األشهر وانعكاساتها االقتصاديّة واالجتامعيّة الفعليّة باألزمة االقتصاديّة بكل بساطة.
xiiiواقعاً ،بالرغم من االلتزام الرسمي ،من جانب املصارف التجاريّة ومرصف الثامنية األوىل من العام ،)8M-2020( 2020تقلّصت واردات السلع
عتب عبء تقليص املديونية املالية/ لبنان املركزي ،بحامية الودائع .يُ َ مم أدّى إىل تراجع بنسبة 59يف املئة يف عجز التجارة بنسبة 50يف املئةّ ،
التعديل الجاري يف القطاع املايل تنازل ًّيا ومركّزا ً عىل املودعني األصغر يف السلع .ونتوقّع تقلّص عجز الحساب الجاري ،مرتاجعاً بـ 7نقاط مئويّة
الذين يفتقرون إىل أي مصدر آخر للمدخرات ،واليد العاملة املحليّة ليبلغ 14.4يف املئة من إجاميل الناتج املحيل يف العام ،2020مقارن ًة
حجم.
التي تتقاىض أجورها ورواتبها باللرية اللبنان ّية ،واملؤسسات األصغر ً مبتوسط العجزعىل املدى املتوسط ( )2018–2013البالغ 22.8يف املئة من ّ
يدعو القطاع املرصيف إىل اعتامد آليّات تأخذ بعني االعتبار األصول التي إجاميل الناتج املحيل .لكن اإلنهيار يف التدفقات الرأساملية الوافدة أدى إىل
متلكها الدولة ،واحتياطيات الذهب ،والعقارات العامة من أجل تصحيح استنفاذ احتياطي العمالت األجنبية لدى مرصف لبنان املركزي ،مام يؤدي
ميزانيات املصارف الضعيفة ،مام يُشكّل إنقاذا ً للقطاع املايل ال يتامىش مع إىل تفاقم القيود عىل الواردات.
مبادئ إعادة الهيكلة التي تحمي دافعي الرضائب .تشمل هذه املبادئ من املتوقع أن يزداد مستوى الفقر يف لبنان سو ًءا ،ليتجاوز عدد
حلول اإلنقاذ الداخيل باإلستناد إىل هرميّة الدائنني ،بد ًءا من مساهمي الفقراء نصف عدد السكان مع حلول العام .2021ال شك يف أن انكامش
املصارف .كام ُيكن للحكومة أن تفرض رضيبة عىل الرثوة (عىل األصول وتضخم ثنايئ الرقم يف
ً إجاميل الناتج املحيل اللبناين الفعيل للفرد الواحد
املالية والحقيقية) كأداة إلعادة هيكلة القطاع املايل بشكل تقدمي. العام 2020سيؤدّيان إىل ازدياد ملحوظ يف مع ّدالت الفقر التي تؤث ّر عىل
يعرض املوضوع الخاص لهذا العدد من مرصد لبنان االقتصادي الفئات السكان ّية كلّها يف لبنان ،من خالل قنوات مختلفة ،عىل غرار فقدان
نه ًجا إلعداد أجندة إصالحية شاملة تهدف إىل معالجة جذور أسباب العاملة اإلنتاجيّة ،والرتاجع يف القوة الرشائيّة الفعليّة ،وتعليق الحواالت
األزمة االقتصادية .تهدف األجندة اإلصالح ّية هذه إىل اقرتاح متهيد الدولية ،إلخ.
الطريق من أجل بناء اقتصاد أكرث مساوا ًة وأكرث كفاء ًة وأكرث قدرة عىل يف سياق املقارنة ،كانت أساسيات االقتصاد الكيل يف لبنان يف
الصمود .تضع الخطة إصالحات الحوكمة يف سلم األولويّات ،إىل جانب الفرتة التي سبقت األزمة االقتصادية ضعيفة مقارن ًة مع أزمات عامل ّية
استقرار االقتصاد الكيل .كام تهدف هذه األجندة إىل إثراء نقاش مفتوح سابقة ُمختارة .4وبالتايل ،نتوقّع أن تكون عمليّة التعديل أصعب وأطول،
يف صفوف املواطنني اللبنان ّيني ويف ما بني املواطنني اللبنان ّيني وحكومتهم. حتى مع توفّر تدابري سياسة مثال ّية .يف الواقع ،بعد مرور عام عىل األزمة
مم االقتصاديّة ،مل يتم بعد تحديد هذه السياسات ،ناهيك عن تنفيذهاّ ،
يؤخّر بشكل أكرب الخروج من األزمة االقتصاديّة وإنعاش االقتصاد مج ّددًا.
4نُقارن مبادئ االقتصاد الكيل يف لبنان إىل مجموعتَني من عوامل مقارنة األزمات وبالتايل ،وكام هي الحال اآلن ،يُر َّجح أن تكون األزمة االقتصاديّة التي
العامل ّية :تشمل املجموعة األوىل ( )G1دول األزمة اآلسيويّة يف العام –1997 ترضب بلبنان أخطر وأطول مقارن ًة مع غالب ّية األزمات االقتصاديّة.
:1998تايلند ،وماليزيا ،والفيلبني ،وإندونيسيا ،وكوريا الجنوبية؛ وتضم املجموعة يُعترب عبء تقليص املديونية املالية/التعديل الجاري يف القطاع
الثانية ( )G2مجموعة ُمحدّدة من األزمات التي وقعت يف العقد األول من املايل تنازل ًّيا إىل حدّ بعيد ،حيث ُيركّز عىل املودعني األصغر ،واليد العاملة
القرن الحادي والعرشين :األرجنتني ( ،)2001واليونان ( ،)2008وايرلندا (،)2008 عتب تحويل الودائع بالدوالراملحل ّية ،واملؤسسات األصغر حجامً .وبالتايل ،يُ َ
وايسلندا ( ،)2008وقربص (.)2012 األمرييك إىل اللرية اللبنان ّية واالقتطاع من الودائع يف الدوالر األمرييك أمرا ً
xiv LEBANON ECONOMIC MONITOR: THE DELIBERATE DEPRESSION1
THE POLICY CONTEXT
O
n April 30, 2020, the (then) cabinet and modality of restructuring that would be needed
endorsed a long-awaited financial recovery in the financial sector (banks plus BdL). A key
plan that aimed to regain macro-financial motivation for this disagreement has been the need
stability for Lebanon. The Government’s program for public debt restructuring, which would result in
rested on central and interrelated pillars, including: heavy losses in the financial system, given the large
(i) exchange rate adjustment; (ii) comprehensive debt holdings of public debt by BdL and banks. Eventually,
restructuring; (iii) comprehensive financial sector the Government resigned, and with efforts to form a
restructuring; (iv) a phased fiscal adjustment; (v) successor government having failed so far, progress
growth enhancing reforms; (vi) social sector reforms; awaits the formation of new Government. Meanwhile,
(vii) anti-corruption agenda; (viii) environmental the economy keeps shrinking and the social cost of
reforms; and (ix) international financial assistance. the crisis rises and widens.
Lebanese authorities and the IMF began dis- The banking sector is advocating for
cussions in May 2020. The discussions eventually mechanisms that incorporate state owned assets
stalled as differences and inconsistencies emerged (SOEs), gold reserves, and public real estate in
within the Lebanon team regarding the Government’s order to overhaul their impaired balance sheets.
financial recovery program. Key members on the This constitutes a bailout of the financial sector and
authority’s team subsequently resigned from posi- is inconsistent with the restructuring principles estab-
tion, amid highly publicized differences between lished in the wake of the Global Financial Crisis of
Government and BdL (especially on debt; losses in
the financial sector; banking sector restructuring).
BdL and the banking sector at large have
5
The Government’s plan identifies LL 62 trillion ($50
billion at the plan’s assumed exchange rate $1=LL
expressed serious disagreements with the
3,500) in aggregated losses in BdL’s balance sheet,
Government’s plan and analysis, in particular, which when added to losses in the banking sector and
the identified losses in the financial sector.5 This netting out equity, result in LL 154 trillion ($44 billion) in
is a critical component as it determines the extent impaired liabilities for the financial sector.
12008 to protect taxpayers when financial institutions spilled over to street action even under COVID-19
fail. These principles include bail in solutions based conditions; internal political discord and fragmenta-
on a hierarchy of creditors, starting with banks share- tion continues; and geopolitical tensions complicate
holders. Government also has the prerogative and solutions. In consequence, high skilled labor is increas-
legal jurisdiction to apply a wealth tax on deposits as ingly likely to take up potential opportunities abroad,
a tool to restructure the financial sector. A wealth tax constituting a permanent social and economic loss
applied on financial and real assets can be very pro- for the country.
gressive tool for needed macro-financial restructuring. Lebanon needs to urgently adopt and imple-
A year into the economic crisis, there have ment a credible, comprehensive and coordinated
been limited policy responses by the authori- macro-financial stability strategy, within a medium
ties as Lebanon faces a dangerous depletion term macro-fiscal framework. This strategy would
of resources, including human capital with be based on: (i) a debt restructuring program toward
brain drain an increasingly desperate option. achieving debt sustainability over the medium term;
In fact, Lebanon lacks a fully-functioning executive (ii) a comprehensive financial sector restructuring
authority and is currently in the process of forming toward regaining solvency of the banking sector; (iii) a
its third Government in less than a year. Following new monetary policy framework aimed at regaining
the failure of Moustapha Adib to form a Government, confidence and stability in the exchange rate; (iv) a
PM Saad Hariri was designated to be the next Prime phased fiscal adjustment aimed at regaining confi-
Minister by President Aoun upon consultations with dence in fiscal policy; (v) growth enhancing reforms;
Parliamentarians. Meanwhile, social discontent has and (vi) enhanced social protection.
2 LEBANON ECONOMIC MONITOR: THE DELIBERATE DEPRESSION2
RECENT
MACRO-FINANCIAL
DEVELOPMENTS
Output and Demand first five months of 2020 (5M-2020), compared to
an increase of 5.5 percent in the same period in
The compounded crises, namely, the economic 2019. While the decline in tourist arrivals has been
crisis, COVID-19 and the PoB explosion, have in effect since October 2019 due to economic crisis
had staggered impacts on output and with conditions, it was highly concentrated from Spring
differentiated magnitudes. Due to insufficient high 2020 and onwards due to COVID-19. Further, the
frequency data, precise identification of each of BLOM-PMI index, which captures private sector
those impacts is a challenging task. In order to draw activity, averaged 40.4 in 9M-2020 (FIGURE 1 • While the Contraction in Real GDP Commenced in 2018, It Is Heavily Concentrated in 2020
Real GDP Growth (%)
20 16.4
15 11.3
10.8 9.3 9.1 10.2 8.0
10 8.1 6.4 7.5
3.8 3.9 3.9 3.4 2.7 1.5 2.5 3.8 2.5
5 1.7
1.1 0.9 0.2 1.5 0.9
0
–0.8 –1.9
–5
–10 –6.7
–15
–20
–19.2
–25
1992
1993
1994
1995
1996
1997
1998
1999
2000
2001
2002
2003
2004
2005
2006
2007
2008
2009
2010
2011
2012
2013
2014
2015
2016
2017
2018
2019
2020
Sources: CAS and WB staff calculations.
FIGURE 2 • Net Exports Are Expected to Be the Sole Positive Contributor to Real GDP
30
20
10
0
10
20
30
40
50
2011 2012 2013 2014 2015 2016 2017 2018 2019e 2020f
Private consumption Government consumption Gross fixed capital investment
Net exports Statistical discrepancy Lebanon RGDP growth
Sources: CAS and WB staff calculations.
a contraction of activity), compared to 46.8 for purchases.9 On the other hand, construction permits
9M-2019. Even as the PMI index has indicated a and cement deliveries, which are more accurate
persistent contraction of activity since 2013, the indicators of construction activities in the real estate
year it was first published, the 9M-2020 average is market, suffered yoy declines of 60 and 52 percent,
the lowest recorded. Similarly, the Byblos/AUB con- respectively, in H1-2020. This comes on the heels
sumer confidence index registered a yoy decline of of significant contractions in H1-2019 amounting to
60.6 percent in H1-2020. Meanwhile, the real estate 30.8 and 32.4 percent, respectively.
sector has been subject to two offsetting factors;
on the one hand, facilitation by the financial sector
to allow real estate purchases using pre-October 9
Some of these purchases involved real estate collateral
2019 dollar deposits under conditions of capital held on badly performing loans. Hence, this effectively
controls (and therefore, a lack of alternatives to get constituted a netting out effect of assets and liabilities on
those deposits out) has led to an increase in such banks’ balance sheets.
4 LEBANON ECONOMIC MONITOR: THE DELIBERATE DEPRESSIONBOX 1. NOWCASTING AND FORECASTING ECONOMIC ACTIVITY
Despite its importance for policymaking, GDP is typically observed at low frequencies, and in the case of Lebanon, with a long lag.a As
such, central banks and policymakers endeavor to assess the state of the economy via higher frequency measures of economic activity.
Since the important contribution of Ghysels, Santa-Clara and Valkanov (2004),b Mixed-Data Sampling (MIDAS) methods (or models) have
gradually become essential tools at the disposal of central banks and policymakers for nowcasting GDP. A key advantage of MIDAS models
is that they allow the combination of low frequency GDP data with higher frequency economic activity data in their estimations. As such, the
use of MIDAS models has rapidly gained traction among policymakers and central bankers for nowcasting GDP.c
On the other hand, a caveat is that under crisis dynamics, linear relationships might not hold along tail end conditions. Indeed, MIDAS
regressions assume a linear relation between GDP growth and the high frequency indicators. Nonetheless, the Almon lag specification
used to relate the high frequency indicator to GDP growth can take various shapes using only a few parameters (Ghysels and Marcellino,
2018).d By estimating the weights that relate the high frequency indicators to real GDP growth, MIDAS regressions partially account for
nonlinearity in the relationship. Unlike bridge equations in which observations on the high frequency indicators are weighted equally, the
MIDAS approach allows for flexible weighting of the monthly observations on the high frequency indicators. As such, the MIDAS approach
captures well the steep downward trend in the high frequency indicators in the latter part of the sample, i.e. the 2020 monthly observations
on the high frequency indicators.e The high frequency indicators used to nowcast and forecast Lebanon’s real GDP growth are, namely,
yoy growth rates in: claims of the commercial banking sector on resident customers (cl), outstanding lines of credit for imports (lc), non-
resident (nr) and resident (r) deposits; all sourced from BdL. That is, in the MIDAS setup, our vector of high frequency indicators is
x tH =(cl ,lc ,nr ,r )
We aggregate information from the four high frequency indicators using principal components analysis. More specifically, we extract the
first principal component from the four indicators and use it to nowcast or forecast real GDP growth. The MIDAS model, which uses the first
principal component of the four indicators, is referred to as the factor augmented MIDAS model. The low frequency variable of interest in
the nowcasting or forecasting exercises is
y tL =(gdpg )
where gdpg is the annual growth rate in GDP.
In forecasting Lebanon’s GDP growth in 2020 and 2021, two setups are entertained. The first is referred to as the baseline setup and
does not control for COVID-19 economic effects, whereas the pandemic is incorporated into the second setup. More specifically, the AR(1)
model used to forecast the high frequency indicator is augmented with an indicator (i.e., dummy) variable taking the value one from April
2020 (i.e., at the start of the lockdown period) through first half of 2021 (H1-2021). In such a way, we are able to gauge the marginal
impact of COVID-19 on growth. High data for frequency variables are available through May 2020, while the GDP data are available only
until 2018. The dynamic (i.e., multi-step-ahead) forecasts of real GDP growth rates for 2020 and 2021 are generated using ADL-MIDAS
model. The results are provided in Table 1.
It should be noted that the forecast of real GDP growth for 2021 is subject to considerably more uncertainty than that for 2020. The
reasons for the uncertainty are twofold: (i) unlike 2020, the data for the high frequency indicators are not yet available; and (ii) the forecast
of real GDP growth for 2021 builds on the forecast of real GDP growth of 2020.
TABLE 1 • MIDAS Forecasts for 2020 and 2021 Real GDP Growth for Baseline and COVID-19 Scenarios
2020 2021
Baseline COVID Baseline COVID
Non-resident deposit growth –11.0% –13.0% –7.5% –8.6%
Resident deposit growth –16.7% –18.1% –11.4% –12.5%
Claims on the resident sector –14.7% –16.2% –16.3% –16.9%
Lines of credit for imports –16.8% –21.5% –10.2% –11.0%
Factor Augmented MIDAS –18.9% –22.4% –11.3% –12.8%
Average (excl. min & max) –16.1% –18.6% –11.0% –12.1%
(continued on next page)
Recent Macro-Financial Developments 5BOX 1. NOWCASTING AND FORECASTING ECONOMIC ACTIVITY (CONTINUED)
Average estimates of growth projections for 2020 and 2021 are 18.6 percent and 12.1 percent, respectively. Results from Table 1 also
suggest that the estimated COVID-19 impact averages 2.5 pp of GDP in 2020 and 1.1 pp of GDP in 2021. A couple of factors can help
understate the COVID-19 impact, specifically, (i) that the high frequency indicators used are more optimal for financial crisis dynamics, which
is the largest of the three crises that the country is facing, that for COVID; and (ii) that the sample period used to estimate the MIDAS model is
through May 2020, leaving only 2 months to account for the COVID-19 effects in Lebanon. As such, the COVID-19 impact estimation is likely to
change (increase) as more data come in. The results for 2020 ad 2021 can be updated as more data come in for the high frequency indicators.
a
Lebanese GDP data are collected and disseminated by the Central Administration of Statistics (CAS).
b
Ghysels, E., Santa-Clara, P., & Valkanov, R. (2004), The MIDAS Touch: Mixed Data Sampling Regression Models, Discussion paper UNC and UCLA.
c
A comparative assessment of the nowcasting ability of MIDAS and bridge equations is provided in: Schumacher, C. (2016), A Comparison of MIDAS and Bridge
Equations, International Journal of Forecasting, 32(2), 257–270.
d
Ghysels, E., and Marcellino, M. (2018), Applied Economic Forecasting using Time Series Methods, Oxford University Press.
e
Further, the existing literature shows that the predictive ability of nonlinear model is not superior to that of linear models (Clements, Franses and Swanson, 2004). This is
particularly true for forecasting GDP growth and inflation (Marcellino, 2008). The data limitations in Lebanon (in particular, the historical availability of GDP data) as well
as the unprecedented large movements in the high frequency indicators complicate estimation and prediction from nonlinear models.
Clements, M. P., Franses, P. H., & Swanson, N. R. (2004), Forecasting Economic and Financial Time-Series with Non-Linear Models, International Journal of Forecasting,
20(2), 169–183.
Marcellino, M. (2008); A linear benchmark for forecasting GDP growth and inflation? Journal of Forecasting, 27(4), 305–340.
On the demand side, private, and to a lesser percent of GDP. This will be driven by declines in
extent public, consumption and investments are primary expenditures—due almost exclusively to the
expected to contract sharply, with consumption denominator-led effect—and lower interest payments
historically constituting more that 100 percent on debt. Overall, in 2020, the fiscal balance is forecast
of output (Figure 2). Net exports, on the other hand, to improve by 4.7 pps to reach –5.9 percent of GDP
is expected be the sole positive contributor to GDP, (Figure 3). On the other hand, the primary balance
driven by falling imports; according to Customs data, is expected to endure a clear deterioration and is
the total value of merchandize imports declined by 50 projected to be –3.6 percent of GDP, compared to a
percent in 8M-2020, compared to the same period in (2013–2018) average of 0.7 percent.
2019, while merchandize exports fell by 8.3 percent. Partial-year fiscal data confirm severe fiscal
stresses. Over the 6M-2020 period, total revenues
declined by 19.8 percent (yoy), driven by 49.8, 44.4
Fiscal Developments and 32.4 percent yoy decreases in VAT, telecoms and
customs revenues, respectively. We note that income
Crises conditions have further deteriorated tax and VAT are the two largest revenue sources for
Lebanon’s already precarious fiscal position. the Government, followed by transfers from telecoms
Revenues are expected to decline sharply as both and taxes on international trade (of which customs
tax and non-tax revenues tumble in absolute value is a component). The sharp fall in VAT and customs
due to the sharp contraction in economic activity. As are tempered by much smaller declines in other taxes
a percentage to GDP, a sizable increase in nominal so that total tax revenues fell by 27.9 percent over
GDP (in LL), driven by a high GDP deflator (due to 6M-2019. On the non-tax side, treasury transaction
rising prices), will further reinforce the falling revenue resources (revenues) increased by 183 percent due
ratio via a denominator-led effect. Total revenues to the “others” category, also helping to partially offset
in 2020 are thus projected to decrease by around the sharp decline in telecom transfers. Total expen-
9 pps to reach 11.5 percent of GDP, compared ditures over 6M-2020 have also decreased by 16.2
to an average (2013–2018) of 20.7 percent. On percent. This, however, is largely due to cuts in interest
the expenditure side, total spending is forecast payments on debt. In fact, over 6M-2020, interest
to decline by almost 14 pps to be at around 17.3 payments on foreign debt fell by 87.6 percent (yoy),
6 LEBANON ECONOMIC MONITOR: THE DELIBERATE DEPRESSIONFIGURE 3 • Large Shortfalls in Revenues Will Induce a Significant Deterioration in the Fiscal Position
Fiscal Aggregates (% of GDP)
5
3
0
–3
–5
–8
Percent (%)
–10
–13
–15
–18
–20
–23
–25
–28
1991 1993 1995 1997 1999 2001 2003 2005 2007 2009 2011 2013 2015 2017 2019
Overall fiscal balance Primary fiscal balance, excluding interest payments
Sources: Lebanese authorities and WB staff calculations.
FIGURE 4 • Valuation Effects from Exchange Rate Depreciations Will Pressure the Debt-to-GDP Ratio
Gross Public Debt
100 250
90
80 200
70
Percent (%)
US$ Billion
60 150
50
40 100
30
20 50
10
0 0
1991 1993 1995 1997 1999 2001 2003 2005 2007 2009 2011 2013 2015 2017 2019
External public debt (US$ bln) Gross public debt (US$ bln)
Domestic public debt (US$ bln) Gross public debt as a percentage of GDP (rhs, %)
Sources: Lebanese authorities and WB staff calculations.
a result of the default decision on Eurobonds early in outstanding stock of foreign currency-denominated
March 2020, while that on domestic debt decreased debt was 37 percent in April 2020, mostly held by
by 26.1 percent. The latter is due to an agreement domestic banks. Of course, taken at the higher
with the central bank, by which BdL would not receive average exchange rate in the economy, this share
coupon payments on Treasury bonds it holds as part of increases dramatically (a doubling or tripling would be
fiscal relief for the Government.10 Meanwhile, primary
spending remained largely unvaried in nominal terms
(but fell sharply in real terms as inflation has spiked). 10
As of August 2020, BdL held 60 percent of gross local
The economic crisis has led to a sharp dete- currency public debt.
rioration in Lebanon’s public debt ratio, which has
11
The default on the Eurobonds implies uncertainty over
the final nominal value of foreign debt, whose new terms
long been on an unsustainable path. By end-2020,
(i.e. face value, maturity, grace period etc.) need to be
the debt-to-GDP ratio is projected to reach 194 per- negotiated with foreign creditors. For our purposes, we
cent, compared to 171 percent end-2019 (Figure 4).11 assumed no principal and coupon payments take place
Taken at the official exchange rate, the share of for Eurobonds in 2020 and 2021.
Recent Macro-Financial Developments 7FIGURE 5 • Triple-Digit Inflation Rates Driven by Basic Consumption Items
Drivers of 12-Months Headline Inflation
175
150
125
100
Percent (%)
75
50
25
0
–25
–50
Jun-19
Feb-19
Mar-19
Apr-19
May-19
Jun-19
Jul-19
Aug-19
Sep-19
Oct-19
Nov-19
Dic-19
Jun-20
Feb-20
Mar-20
Apr-20
May-20
Jun-20
Jul-20
Aug-20
Food & non-alcoholic beverages Alcoholic beverages & tobacco Clothing & footwear Actual rent
Owner occupied Water, electricity, gas and other fuels Furnishings, household equipment Health
Transportation Communication Education Other
Headline inflation growth
Sources: CAS and WB staff calculations.
consistent with some of the current various exchange yoy inflation rate over the first 8 months of 2020 (8M-
rates in use in the country). Historically, interest cost 2020) for food and non-alcoholic beverages was 170.3
has consumed about half of government revenues, percent, while that for clothing and footwear was
averaging 9 percent of GDP over 2013–2018. 195.4 percent, and 240.1 percent for furnishing and
household equipment (Figure 5).
The severe restrictions on capital outflows
Money and Banking have increased the monetary space for monetary
authorities. From October 2019 to August 2020,
Monetary conditions mirror the state of economic BdL lowered interest rates on banks’ LL and dollar
and financial crisis centered around exchange deposits by 556 and 533 basis points (bps), respec-
market pressures that triggered triple-digit inflation tively. Banks’ lending rates in LL have mirrored this
rates. Acute exchange market pressures in Lebanese effect, falling by 405 bps over the same period, while
markets are reflected by heavy fluctuations in the rates for dollar loans have fallen by only 251 bps.
black-market exchange rate,12 which has breached BdL has issued a series of circulars that
LL 10,000 per US$, before falling back down. This is reflect the central bank’s vision of a crisis man-
within the context of a multiple exchange rate system, agement strategy, along with some key political
which includes the official exchange (LL 1,507.5/ US$) economy priorities. These initiatives can be divided
as well BdL-backed lower rates for critical imports. into three main categories: (i) monetary and
Subsequently, exchange rate pass through effects on exchange rate policies; (ii) socio-economic support;
prices have resulted in surging inflation; the 12-month and (iii) financial sector regulations. Annex A lists key
inflation rate has risen steadily and sharply from 10 circulars along with a description of main stipulations.
percent in January 2020, to 46.6 percent in April, Lebanon’s monetary system is fragmented
89.7 percent in June, and most recently in August, with multiple and segmented arrangements with
120 percent. Inflation is a highly regressive tax, variable pricing and exchange rates. This includes:
disproportionally affecting the poor and vulnerable,
and more generally, people living on fixed income like 12
The black market has become a main supply channel for
pensioners. This is especially so in Lebanon’s case dollars for both real and financial activity, as commercial
where key basic items of the consumption basket are banks heavily restricted withdrawals and transfers of
primary drivers of overall inflation. In fact, the average customers’ dollar deposits.
8 LEBANON ECONOMIC MONITOR: THE DELIBERATE DEPRESSIONFIGURE 6 • Heavy Deleveraging of Assets (Private Loans) and Liabilities (Private Deposits) in Financial
Sector
Banks' Deposits and Loans (% yoy change)
30
20
10
Percent (%)
0
–10
–20
–30
–40
–50
Jan-15
Mar-15
May-15
Jul-15
Sep-15
Nov-15
Jan-16
Mar-16
May-16
Jul-16
Sep-16
Nov-16
Jan-17
Mar-17
May-17
Jul-17
Sep-17
Nov-17
Jan-18
Mar-18
May-18
Jul-18
Sep-18
Nov-18
Jan-19
Mar-19
May-19
Jul-19
Sep-19
Nov-19
Jan-20
Mar-20
May-20
Jul-20
LBP credit outstanding to private sector FX credit outstanding to private sector
Private sector deposits in LBP Private sector deposits in FX
Sources: BdL and WB staff calculations.
cash as the economy became heavily cash based
a. The pre-crisis dollar deposits in commercial in LL; and (ii) conversions to dollars as evidenced
banks. These electronic dollars are subject by an increasing dollarization rate, which by August
to severe capital controls and can only be 2020 reached 81 percent, compared to 77.3 percent
(i) withdrawn in LL at the e-board rate and in by end-2019. Private dollar deposits, on the other
limited quantities; (ii) transferred within the hand, declined by a much lower 5.7 percent over
domestic banking system; (iii) cashed out in 8M-2020. Hence, the higher dollarization was more
informal and nontransparent schemes though than offset by a combination of outflows, dollar bank
middlemen at large discounts. note hoarding and, importantly, the settlement of
b. The dollar banknote and new dollar deposits outstanding private sector loans in dollars. Regarding
(fresh dollars). This is traded at the black-market the latter, BdL and the Banking Control Commission
rate. Most businesses need to access this dollar (BCC) facilitated the settlement of outstanding private
in order to import consumption and capital goods. sector loans using pre-crisis dollar deposits in a
c. The Lebanese lira bank note. Limited economic netting out effect of assets and liabilities of banks’
utility for electronic dollars, along with scarcity balance sheets. As a result, commercial banks’ total
of dollar bank notes, and minimum incentives credit to the private sector fell by 22.1 percent over
to save in LL, all rendered the economy heavily 8M-2020, amounting to a decline of US$ 12.5 billion
cash-based in local currency. By August 2020, (at the official exchange rate).
the stock of currency in circulation increased by Commercial banks’ net foreign assets posi-
294 percent (yoy), even as M2 and M3 declined tion has continued to deteriorate. As of August
by 17.1 and 7 percent, respectively. 2020, the banking sector, as a whole, had US$ 4.4 bil-
lion in placements at non-resident financial institutions
Heavy deleveraging in the financial sector. (FIs), while its liabilities to non-resident FIs amounted
Total private sector deposits in commercial banks to US$ 7.5 billion, a net foreign asset position of US$
shrank by 10.2 percent, amounting to US$ 17.2 –3.1 billion (compared to a net foreign asset position
billion (at the official exchange rate), over 8M-2020, of US$ –2.1 billion end-2019).
with distinct dynamics driving LL and dollar deposits The credit portfolio of the banking sector
(Figure 6). The former declined by 25.6 percent over has substantially deteriorated during recent
the same period, dragged by both (i) demand for months. Wholesale and retail trade and processing
Recent Macro-Financial Developments 9FIGURE 7 • A Steady and Sharp Deterioration in heavily consumption based,13 a good proxy would
Credit Performance as Measure by be an average exchange rate calculated using
NPL Ratio for Banks
consumption-based weights, henceforth denoted as
Total credit portfolio AER. As Annex B details, AER is calculated from the
following prevailing exchange rates:
o/w consumption
o/w housing
o/w financial intermediation • The official exchange rate—LL 1507.5 per US$—
o/w retail trade which remains an anchor to many contracted
o/w wholesale trade
prices in the economy and at which BdL is
o/w contracting and construction
o/w processing industries backing up the importation of highly critical
0% 10% 20% 30% 40% 50% goods, namely, fuel, medicines and wheat.
Oct-19 Mar-20 Jun-20
• The e-board exchange rate—LL 3,900 per
US$—used for the importation of critical goods
Sources: BdL and WB staff calculations. identified in the list of (FX-backed) items issued
by Ministry of Economy and Trade (MoET) as well
as the rate at which lirafication is taking place. Its
industries, among other economic sectors were level is administratively determined.
severely affected, causing business closing and job • The more volatile, market-determined, black-
losses/reduced salaries. Non-performing loan (NPL) market exchange rate.
ratio (gross NPLs including unearned interests as a
percentage to total loans) stood at 28.3 percent as To project 2020 AER, we consider bad
of June 2020, compared to 13.3 percent at end-June and worse case scenarios (a good case scenario
2019 and 16.8 percent at the beginning of the crisis in remains unjustified in the current policy making
October 2019. NPL ratio for construction, wholesale environment). In the bad case scenario, denoted
and retail trade, and processing industries stood at as Sc1a, we assume that the black-market rate
47, 40 and 42 percent, respectively, at the end of continues deteriorating to reach LL 10,000 per US$
June (Figure 7). With the devastating impact of the by January 2021, stabilizing thereafter. In the worse
explosions on the economy, continued deterioration case scenario, denoted as Sc1b, we assume that
in the quality of the LL 70 trillion credit portfolio (US$ the black-market rate deteriorates throughout 2021
47 billion at official exchange rate and two-thirds to reach LL 15,500 per US$ by December 2021. We
denominated in USD) would be expected. emphasize that both scenarios should be considered
as illustrative and not projections, since high volatility
in the black-market rate in current panic conditions
The Average Exchange Rate implies very high uncertainty.
The results show that the estimated AER
The fixed exchange rate regime, which has stabilizes in Sc1a, but continues to deteriorate
nominally held at Lebanese lira (LL) 1,507.5 in Sc1b, in reflection of our assumptions (Figures
to the US dollar ($) from 1997 to 2019, is de 8 and 9). Specifically, 2020 AER averages LL 3,550
facto dislodged in favor of a system of multiple per US$ in both Sc1a and Sc1b, depreciating by 129
exchange rates. The average exchange rate in the percent compared to 2019. In 2021, the AERs for Sc1a
economy is a key parameter for macroeconomists in and Sc1b diverge; for the former the AER depreciates
their analyses and estimations, and its identification by 49 percent to average around LL 5,303 per US$,
in a multiple exchange rate system is not a
straightforward exercise. This is particularly so in
the case of Lebanon due to a lack of high frequency 13
Private consumption amounted to an average of 89
transactions data across multiple exchange percent of GDP over the 2004–2018 period, while public
rates. Nonetheless, since Lebanon’s economy is consumption averaged an additional 15 percent of GDP.
10 LEBANON ECONOMIC MONITOR: THE DELIBERATE DEPRESSIONFIGURE 8 • AER Simulations under Assumption of Stability of Black-Market Rate by end-2020
12,000
10,000
8,000
LL/ US$
6,000
4,000
2,000
0
Aug-19
Sep-19
Oct-19
Nov-19
Dec-19
Jan-20
Feb-20
Mar-20
Apr-20
May-20
Jun-20
Jul-20
Aug-20
Sep-20
Oct-20
Nov-20
Dec-20
Jan-21
Feb-21
Mar-21
Apr-21
May-21
Jun-21
Jul-21
Aug-21
Sep-21
Oct-21
Nov-21
Dec-21
Official rate Black market rate, Sc1a Highly critical imports exchange rate
Critical imports exchange rate AER, Sc1a
Sources: WB staff calculations based on data from authorities.
FIGURE 9 • AER Simulations under Assumption of Instability of Black-Market Rate through 2021
18,000
16,000
14,000
12,000
LL/ US$
10,000
8,000
6,000
4,000
2,000
0
Aug-19
Sep-19
Oct-19
Nov-19
Dec-19
Jan-20
Feb-20
Mar-20
Apr-20
May-20
Jun-20
Jul-20
Aug-20
Sep-20
Oct-20
Nov-20
Dec-20
Jan-21
Feb-21
Mar-21
Apr-21
May-21
Jun-21
Jul-21
Aug-21
Sep-21
Oct-21
Nov-21
Dec-21
Official rate Black market rate, Sc1b Highly critical imports exchange rate
Critical imports exchange rate AER, Sc1b
Sources: WB staff calculations based on data from authorities.
whereas it continues deteriorating in the latter scenario, rapidly in Sc1a than in Sc1b, in reflection of our
by 82 percent, to average around LL 6,465 per US$. assumptions. Specifically, the inflation rate averages
72 percent in 2020 for both Sc1a and Sc1b, but
Pass Through Effects on Prices 14
To calculate exchange rate pass-through effects on
inflation, we divided the inflation rate by the AER
Prices of goods and services have surged as a depreciation rate for the same month and multiply by
result of the depreciating exchange rate and in 100. This generates a series of pass-through rates for
reflection of the high import component of the the time period August 2019 to August 2020, which
consumption basket. A simple calculation based we averaged out. We also tested lagging effects by
on the AER and actual inflation data from September generating two more series where (i) the inflation rate
is divided by the AER depreciation rate in the previous
2019 to August 2020 suggest an exchange rate-pass
month; and (ii) the inflation rate is divided by the two
through rate of 52 percent.14 months prior AER depreciation rate. We calculated the
The results, which are presented in Figures standard deviation for the three series and chose the
10 and 11 show inflation abating much more series with the lower standard deviation, which was that
Recent Macro-Financial Developments 11You can also read