Tourism in the Kruger National Park: Past Development, Present Determinants and Future Constraints - African Journal of Hospitality ...
←
→
Page content transcription
If your browser does not render page correctly, please read the page content below
African Journal of Hospitality, Tourism and Leisure, Volume 7 (2) - (2018) ISSN: 2223-814X
         Copyright: © 2018 AJHTL - Open Access- Online @ http//: www.ajhtl.com

   Tourism in the Kruger National Park: Past Development,
        Present Determinants and Future Constraints
                                           Michael R. Brett
                                  Department of Social Sciences
                                 University of Zululand, South Africa
                                   E-mail: BrettM@unizulu.ac.za

Abstract
Proclaimed on 26 March 1898, the Sabi Game Reserve was the largest game reserve established
in South Africa at the time. In 1902, at the end of the Anglo-Boer War, the reserve was re-established
by the British caretaker government. The game reserve later faced considerable opposition, and the
idea of a national park was gradually developed. The enlarged game reserve was finally proclaimed
by the South African Parliament in 1926 and became the country’s first national park. The first visitor
overnight accommodation was constructed in 1928. A rapid increase in visitors soon placed
pressures on visitor facilities. Over the intervening 90 years the Kruger National Park has become
the most visited national park in Africa where wildlife viewing is the core attraction. Visitor numbers
have increased from 27 in 1927 to 1.8 million in 2016/2017. At a 6% rate of increase, visitors will
double to 3.65 million by 2029. Since 1961 the number of accommodation nodes within the park
has increased from 14 to 27, totalling 4179 beds and 1896 visitors in campsites. A total of 1047 beds
are also available in 24 privately-owned concession lodges. The park has an 883-kilometre network
of tarred roads and 1679 kilometres of gravel roads. Of the four management regions, 47.7% of
visitor accommodation and 32.9% of visitor roads are concentrated in the southern region, which
accounts for 21.9% of the park’s area. As the southern region is closest to the cities of Johannesburg
and Pretoria, the research reveals that it attracts more visitors and the rest camps in this region
exhibit the highest occupancy rates. However, out of 308 social media respondents, 90.9% believe
that the southern region is currently overcrowded. Proposals for the future include better
management of OSV visitors, separate branding for the four regions and the establishment of
peripheral accommodation.

Keywords: Kruger National Park, ecotourism, tourist accommodation, visitor increases, constraints

Introduction – The creation of the Kruger National Park

The Kruger National Park is South Africa’s oldest, largest and most successful national park in terms
of both its local and international profile, and its ability to generate income from tourism (SANParks,
2018a, 29). The Sabi Game Reserve, the 4600-km² core of the current national park, was originally
proclaimed by President Paul Kruger of the Zuid-Afrikaansche Republiek (ZAR) on 26 March 1898.
(Dennis & Brett, 2000, 3). The Sabi Game Reserve was not the first of the game reserves
established by the ZAR, but it was by far the largest (Carruthers, 1995, 19, 27). Within 18 months,
the geographic region which is now known as the Republic of South Africa was plunged into
internecine conflict between English and Afrikaners, and which later embroiled all the people of
South Africa in a lengthy war. The conflict finally ended on 31 May 1902, although guerrilla activity
continued for a number of years after the peace treaty (SA History Online). The war cost the British
government more than £200 million (equivalent to £57.4 billion in 2018 values at an annual inflation
rate of 5%). Much of South Africa lay in ruin, as agriculture had collapsed in many regions as a
result of the farm-burning policy, and the internment of 230,000 members of the civilian population
in concentration camps (SA History Online).
Lord Alfred Milner was appointed Administrator of the Transvaal and the Orange River Colony from
January 1901 to June 1902. His caretaker government in Pretoria was anxious to re-establish
government institutions and three of the ZAR’s game reserves were re-established (Pringle, 1982,

                                                                                                      1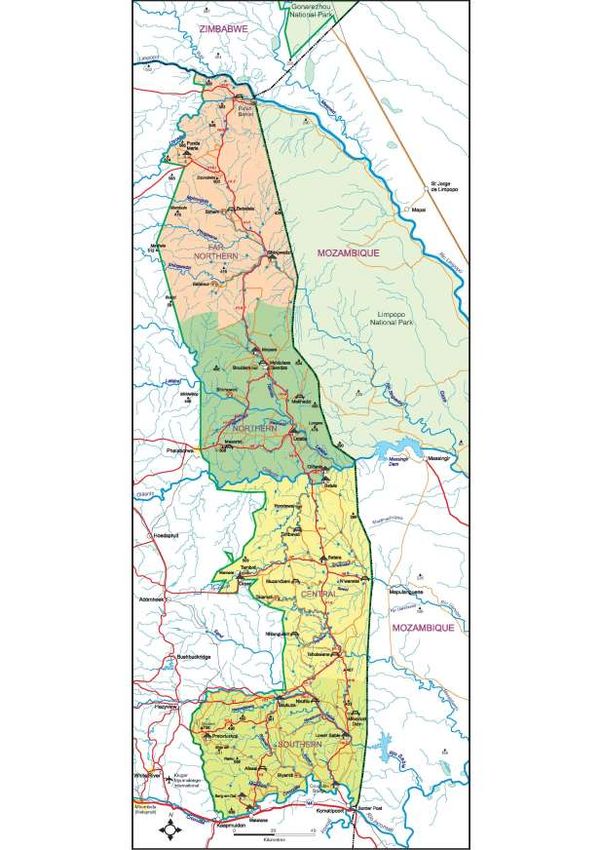
African Journal of Hospitality, Tourism and Leisure, Volume 7 (2) - (2018) ISSN: 2223-814X
          Copyright: © 2018 AJHTL - Open Access- Online @ http//: www.ajhtl.com

80; Carruthers, 1995, 32, 61). In Britain the ruling class had had a long-established tradition of
preserving certain wild animal species for the exclusive use of the ruling elite, so Milner’s decisions
in no ways represented a new or radical approach to wildlife preservation (Carruthers, 1995, 67;
Dennis & Brett, 2000, 4; Brett, 2010, 4)

The caretaker government in Pretoria appointed Major James Stevenson-Hamilton as warden of the
re-established Sabi Game Reserve in July 1902. After hiring four assistants he trekked into the
Lowveld1 and entered the reserve on 6 August 1902. Travelling in an easterly direction from
Pretoriuskop, Stevenson-Hamilton was disappointed by the scarcity of wildlife he encountered,
which was a direct result of the recent Anglo-Boer War (Stevenson-Hamilton, 1937, 46). After
spending four months at Crocodile Bridge, where the Selati Railway crossed the Crocodile River, he
relocated his headquarters in November 1902 to a blockhouse at Sabie Bridge, that had
accommodated soldiers during the Anglo-Boer War (Stevenson-Hamilton, 1937, 38, 49, 71).

Sabie Bridge was so named as it was the point where a wide steel bridge carrying the Selati Railway
crossed the Sabie River. With the military discipline he had acquired at Sandhurst, and whilst serving
as an officer in the Sixth Inniskilling Dragoons, Stevenson-Hamilton devoted his energies to his new
career (Carruthers, 1995, 36). Initially, he regarded this junior civil service job as a temporary
assignment, but within one year he had convinced the British administrators in Pretoria of the need
to triple the size of the Sabi Game Reserve (Carruthers, 1995, 37). In the same year, the Singwitsi
Game Reserve was proclaimed and encompassed 9,000 km² of land between the Letaba and
Luvuvhu rivers (Stevenson-Hamilton, 1937, 97). Stevenson-Hamilton had not been responsible for
the proclamation of the Singwitsi Game Reserve, but took control of the vast terrain. The annual
budget for the two discontinuous reserves, which covered 22,000 km², was £4,000 and strict control
had to be exercised over both staff and finances (Carruthers, 1995, 39).             Because of his
determination and authoritarian managerial style, which resulted at times in the forced relocation of
some of the reserve’s resident black homesteads when they were suspected of poaching,
Stevenson-Hamilton was soon nick-named ‘Skukuza’ (the one who sweeps clean) by the local
people (Stevenson-Hamilton, 1937, 48, 58; Carruthers, 1997, 128). In 1911 the warden reported
that there were 600 taxable men and 3500 women and children in the Sabi Game Reserve, and a
smaller population in the Singwitsi Game Reserve (Brett, 2010, 56, Carruthers, 2001, 93).

As the British wildlife protectionist tradition did not view the preservation of wildlife in the same way
as the American experiment, which, beginning in 1872, had begun declaring certain landscapes as
the property of the entire nation, early game rangers in South Africa were de facto deer keepers.
(Carruthers, 1995, 53; Carruthers, 1997, 125). There was little of no evidence of any conservation
ethic in the general public, and the accepted view was that the game reserves would eventually be
re-opened for trophy hunting once wildlife populations had recovered (Stevenson-Hamilton, 1937,
115). English sport hunters dominated the “fauna preservation societies” of the day, which were
often little more than hunting clubs, and no clear distinction existed between sport hunting and wildlife
preservation (Pringle, 1982, 60, 78; Carruthers, 1995, 14, 18, 24, 31, 52).

As herbivore populations in the two game reserve began to recover, so predator numbers increased
and the “keepers of the royal deer” were soon faced with opposition from farmers on the boundary
of the Sabi Game Reserve (Stokes, 1941, 22; Pringle, 1982, 86; Carruthers, 2001, 87). The
Transvaal Game Protection Association, which was formed in 1902, included sport hunters and
influential landowners. Influential members viewed the Sabi Game Reserve as a refuge for predators
(Stevenson-Hamilton, 1937, 201; Pringle, 1982, 84; Carruthers, 1995, 18, 31). One member called
for the, ‘’abolition of the Sabi Game Reserve and the subsequent extermination of all the game in it”
(Stevenson-Hamilton, 1937, 262). Another vocal member from the Lydenburg branch, Frederick

1
 The low country lying east of the Drakensberg Mountains and extending as far as the Mozambique border. Altitude
ranges from 120 metres to 750 metres and this region has a reputation for supporting an abundance of wildlife. The
prevalence of malaria helped to limit development until the end of the 19th century.
                                                                                                                     2
African Journal of Hospitality, Tourism and Leisure, Volume 7 (2) - (2018) ISSN: 2223-814X
         Copyright: © 2018 AJHTL - Open Access- Online @ http//: www.ajhtl.com

Vaughan-Kirby, called the Sabi Game Reserve, “a Government lion-breeding concern, and not a
protection for game” (Carruthers, 1995, 42; Pringle, 1982, 93).

As Pringle (1982, 86), summed up this period in the eventual proclamation of the Kruger National
Park, “the game reserve may have been intended for the benefit of future generations, but the
present generation was not allowed in. There was no accommodation in the Reserve. Nor roads.”

Rangers responded to increased opposition from neighbouring farmers and other influential lobby
groups by shooting many predators, even birds of prey, venomous snakes and even baboons, and
up until 1927 a total of 1272 lions, 660 leopards, 269 cheetahs, 521 hyaenas and 1142 wild dogs
were killed (Stevenson-Hamilton, 1937, 73; Smuts, 1982, 174).

Stevenson-Hamilton was well acquainted with developments in the global conservation movement
and knew of the success of the American national parks. He wrote, “I had incidentally heard a great
deal about the American national parks and of their success as a public attraction. Would it
conceivably be possible to wean the South African public from its present attitude towards the wild
animals of its own country, which was that of regarding them either as a convenient source of
exploitation or as an incubus hindering the progress of civilization?” (Stevenson-Hamilton, 1937,
115).

In a major study of the environmental history of the British empire, MacKenzie (1988) argues, “to a
large extent the very different conditions of Africa…were all overridden in favour of a concept which
seemed to represent a North American success story, an example of what conscience could do to
redress the destructiveness of America’s nineteenth-century frontier and make her flora and fauna
available to a population increasingly discovering that it had the affluence and the mobility to develop
an interest. The American precedent received a great deal of attention from the proponents of
African national parks” (261, 262).

At the time the two game reserves were administered by the Transvaal Provincial Administration,
and in 1914 General Jan Smuts, Minister of Finance and Defence in the Union Government
supported the proposal that at least part of the reserve should become a national park, in line with
trends in the United States of America (Carruthers, 1995, 55).

The 1903 proclamation, which had extended the boundary of the Sabi Game Reserve north of the
Sabie River, incorporated many privately-owned farms, while the Singwitsi Game Reserve to the
north encompassed the land between the Letaba and Luvuvhu rivers (Carruthers, 1995, 34, 38).
State land between the Olifants and Letaba rivers, which was inhabited by black communities, was
later added, but the inclusion of the central region was the most difficult part of the negotiations which
resulted in the proclamation of the Kruger National Park. Much of the land was owned by white
farmers and a speculative land company, although conditions were not conducive at the time for
settled agriculture (Stevenson-Hamilton, 1937, 210; Stokes, 1941, 21; Bulpin, 1974, 16).
Government had to first acquire 33 privately-owned and 49 company-owned farms, which were
mostly the property of the Transvaal Consolidated Land Company (Dennis & Brett, 2000, 14;
Carruthers, 2001, 155, 156). The irregular western boundary which resulted was therefore decided
mainly by limiting the number of farms the government needed to purchase, as opposed to any
ecological consideration (Stevenson-Hamilton, 1937, 214; Pringle, 1982, 96). After the farms had
been purchased, or exchanged for land to the west, the Kruger National Park was proclaimed by the
South African Parliament on 31 May 1926 (Stevenson-Hamilton, 1937, 214).

Development of early tourism in the vicinity of Pretoriuskop

The following year only three cars visited the new national park and revenue amounted to £3 (Dennis
& Brett, 2000, 5). The Pretoriuskop area was the first portion of the Kruger National Park to be
opened to visitors, and the network of loop roads around the camp recalls the time when it offered
                                                                                                  3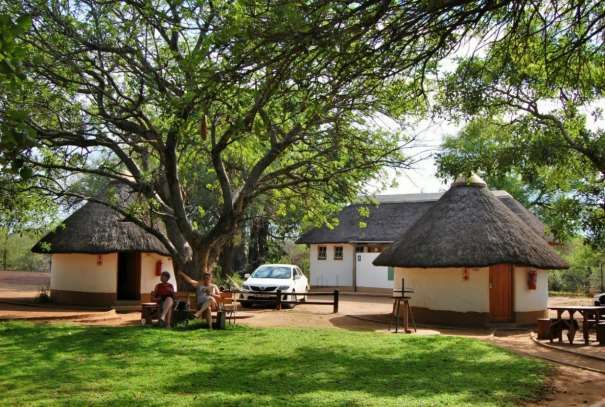
African Journal of Hospitality, Tourism and Leisure, Volume 7 (2) - (2018) ISSN: 2223-814X
         Copyright: © 2018 AJHTL - Open Access- Online @ http//: www.ajhtl.com

some of the best game-viewing in the entire park (Bulpin, 1974 (2), 3; Ewart-Smith, 2005, 185)
(Figure 1). When Stevenson-Hamilton first visited the area in 1902 he wrote, “Pretoriuskop, later to
become so covered with wildebeest that they looked like mobs of cattle scattered everywhere, then
held but a few reedbuck and duiker” (Stevenson-Hamilton, 1937, 58).

From 1913 to 1923, as many as 8,800 sheep, belonging to nine farmers, were herded into the Sabi
Game Reserve from the beginning of May to the end of September (Pringle, 1982, 90). The sheep
farmers burnt the veld around Pretoriuskop to create short, green grazing for their flocks of sheep
(Pienaar, 1972, 3). The underlying geology consists of the igneous rock, granite, which produces a
sandy, infertile soil requiring regular fire to ensure that grasses do not become tall and unpalatable.
The relatively high rainfall, and the absence of frost, encourages grass growth even during winter
(Gertenbach, 1983, 11), but the underlying sandy soil results in the presence of sour grass species,
especially on the mid- and upper- slopes of the landscape (Gertenbach, 1983, 13). The presence
of nutritious grazing in the Pretoriuskop area was therefore largely dependent on regular veld fires.

The veld burning regime practised by the farmers was later continued by Stevenson-Hamilton, even
after the sheep farmers were no longer permitted, but veld experts warned that certain sour grass
species would be stimulated by fires implemented at too regular an interval (Pienaar, 1972, 5). In
later years, all veld fires were banned by Colonel J.A.B. Sandenbergh, a South African Air Force
officer who succeeded Stevenson-Hamilton in 1946. The annual fires had held the vegetation in a
sub-climax condition and, in the absence of fire, the silver-leaf trees (Terminalia sericea), which is
not a popular browse species, soon grew into a tall, dense woodland. The Pretoriuskop area soon
lost its reputation of offering prime game-viewing (Stokes, 1941, 31; Braack, 1983, 46; van Wyk,
1984, 181; Pienaar, 1972, 9; Paynter, 1986, 66, 84). Pienaar (1972, 3) stated, “that there is at
present less game to be found in the Pretoriuskop area than in the era before 1947 cannot be
disputed.” This perception persists even to the present time, and Pretoriuskop has the lowest unit
occupancy rate for any camp in the southern half of the park.

Development of the early rest camps in the Kruger National Park

Initially, visitor access to the Kruger National Park was cumbersome, and only day visits were
permitted as there were no overnight visitor facilities. The austere budget of £10,000 that Stevenson-
Hamilton had been given in 1927 to manage the Kruger National Park, left little surplus to construct
any visitor facilities, although government did provide a grant for road construction (Stevenson-
Hamilton, 1937, 223, 224). Day visitors had to obtain a permit from either Pretoria, White River,
Sabie Bridge (Skukuza) or the Pretoriuskop game ranger post at Mthimba. The arrangement was
cumbersome and visitors often passed ranger Harry Wolhuter’s house at Mthimba (9 kilometres west
of Numbi Gate) without first obtaining a permit, and an agent was later employed to issue permits
(Joubert, 1990, 2).

The first three “rest huts” were constructed in 1928 at Pretoriuskop, Sabie Bridge and Satara, and in
1929 a further 12 rondavels (circular huts) were constructed at Sabie Bridge and two at Satara
(Joubert, 1990, 2). In 1929 visitors increased to 2500, from the initial 27 only two years previously
(SANParks, 2017). The early rest huts were constructed according to a design by the American
mining engineer, Paul Selby, and made use of local natural resources such as thatching grass and

                                                                                                      4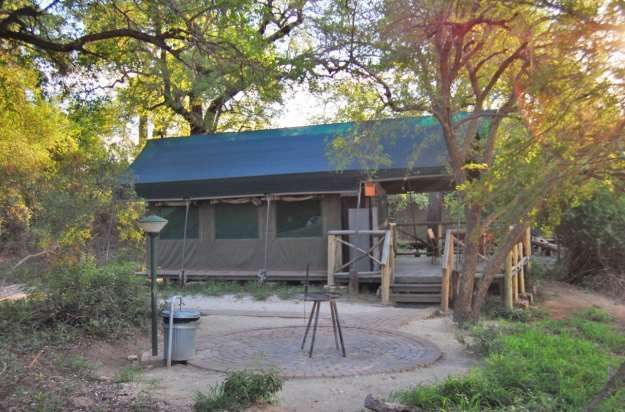
African Journal of Hospitality, Tourism and Leisure, Volume 7 (2) - (2018) ISSN: 2223-814X
          Copyright: © 2018 AJHTL - Open Access- Online @ http//: www.ajhtl.com

Figure 1: The loop roads near Pretoriuskop, such as the loop around Manung, are a relic from the early days when
this region offered some of the best game-viewing in the Kruger National Park Source: Author’s own

Figure 2: Built in 1930, a surviving example of an early rondavel in Pretoriuskop Camp. These structures were
known as “Selby huts” and did not include windows because of the danger posed at night by predators such as
lions and leopards Source: Author’s own

                                                                                                              5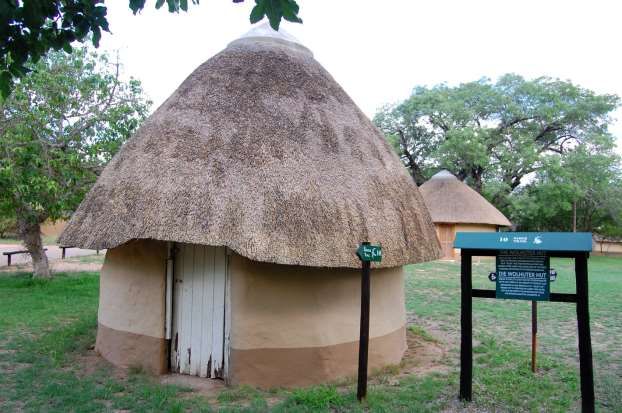
African Journal of Hospitality, Tourism and Leisure, Volume 7 (2) - (2018) ISSN: 2223-814X
Copyright: © 2018 AJHTL - Open Access- Online @ http//: www.ajhtl.com
timber for roof struts (Figure 2). The six extant huts at Balule are examples of these early “Selby
huts” (Figure 7). The Selby huts did not contain any windows, as the rest camps were not fenced,
and a round hole in the top half of the door allowed visitors to ascertain if any dangerous predators
were in the vicinity before opening the door. As there was only a small gap between the wall and
the roof, the interior was dark and the huts were very hot during summer (Joubert, 1990, 3).
Construction of the Olifants Poort (Gorge) camp commenced in 1929, and in the following year two
huts were constructed at Sabie Bridge (Skukuza), four at Malelane, four at Pretoriuskop (Figure 2),
15 in Satara, six at Olifants (Balule) (Figure 7), one at Olifants Poort (Gorge) and 12 at Letaba (Figure
5, 6). At Lower Sabie, the house that had been used by ranger, Tom Duke, was converted into visitor
accommodation (Joubert, 1990, 3). By 1930, within four years of the park being first opened to the
public, a total of 63 thatched huts had been completed to accommodate overnight visitors. As
rangers had limited funds at their disposal, they used local resources such as leadwood poles
(Combretum imberbe) and thatching grass collected from the adjacent veld to construct these units
(van Wyk,1984, 173). The design of visitor accommodation mimicked Swazi and Shangaan
architecture, and national parks in South Africa soon developed their own unique architectural style
which has persisted, with very few exceptions, to the present day (refer to Figures 16 and 17).
After several guests contracted malaria, from 1930 the park was closed from the end of October until
the end of May each year (Bulpin, 1974 (2), 3). By 1933, small rest camps had been established at
Pretoriuskop, Sabie Bridge (Skukuza), Malelane, Crocodile Bridge, Rabelais, Satara, Olifants Poort
(Gorge), Olifants (Balule), Letaba (Figure 5, 6) and Malopeni. Shingwedzi was opened in 1934, and
the Lower Sabie units were completed in 1936 (Joubert, 1990, 4). Within a decade of the first visitors
entering the park, there were therefore 12 rest camps available for visitors, of which only Rabelais,
Gorge and Malopeni were later abandoned. The nine remaining rest camps have been developed
and enlarged over the years and form the foundation of the Kruger National Park’s current visitor
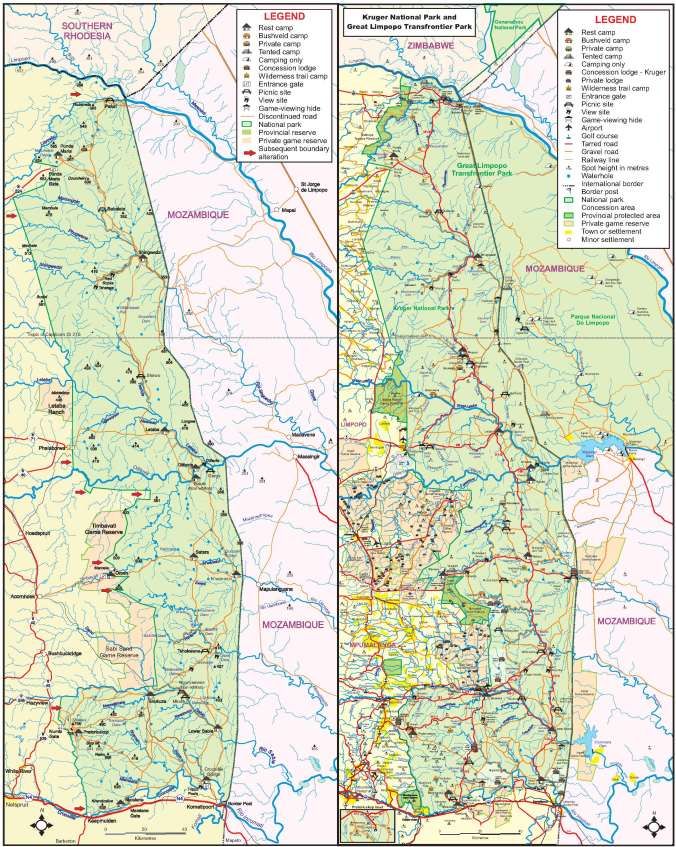
infrastructure (Maps 1 - 3).
The further development of visitor accommodation in the Kruger National Park
The initial 12 small rest camps were connected by roads constructed by staff which followed the
straightest routes between ranger posts, and there were initially relatively few game-viewing loop
roads. However, by the end of 1929 a total of 617 km of roads had been constructed (Joubert, 1990,
12) and by 1948 it was possible to travel from Malelane to Sabie Bridge (Skukuza), and as far as
Satara, Olifants (Balule), Letaba, Shingwedzi, Punda Maria and ending at Pafuri on the far northern
border (Map 2).
Visitors to Kruger National Park
2 000 000
1 800 000
1 600 000
1 400 000
1 200 000
1 000 000
800 000
600 000
400 000
200 000
0
1927
1929
1931
1933
1935
1937
1939
1941
1943
1945
1947
1949
1951
1953
1955
1957/1958
1959/1960
1961/1962
1963/1964
1965/1966
1967/1968
1969/1970
1971/1972
1973/1974
1975/1976
1977/1978
1979/1980
1981/1982
1983/1984
1985/1986
1987/1988
1989/1990
1991/1992
1993/1994
1995/1996
1997/1998
1999/2000
2001/2002
2003/2004
2005/2006
2007/2008
2009/2010
2011/2012
2013/2014
2015/2016
Figure 3: Growth in visitor numbers since 1927
6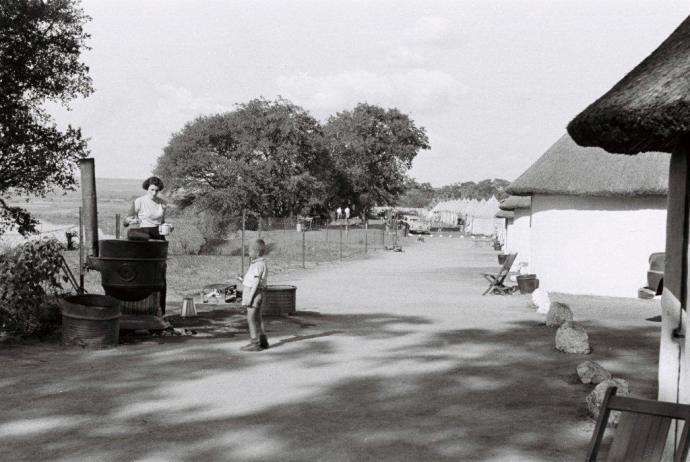
African Journal of Hospitality, Tourism and Leisure, Volume 7 (2) - (2018) ISSN: 2223-814X
          Copyright: © 2018 AJHTL - Open Access- Online @ http//: www.ajhtl.com

Figure 4: A display at Tshokwane Picnic Site recalling the early days of tourism in the Kruger National Park
Source: Author’s own

Figure 5: In 1954 visitors to Letaba Camp had to be accommodated in tents due to a lack of adequate overnight
accommodation Source: SANParks archives

                                                                                                               7
African Journal of Hospitality, Tourism and Leisure, Volume 7 (2) - (2018) ISSN: 2223-814X
          Copyright: © 2018 AJHTL - Open Access- Online @ http//: www.ajhtl.com

Figure 6: Letaba Camp in 1954 showing the river-facing huts and the old hot-water boilers which used to be a
feature of rest camps and picnic sites in the Kruger National Park Source: SANParks archives

Figure 7: The 18-bed Balule Camp consists of “Selby huts” and is located at the site where a pontoon, built by
Colonel Deneys Reitz, transported visitors across the Olifants River from 1929 to 1937 and is one of the oldest
rest camps in the Kruger National Park Source: Author’s own

                                                                                                             8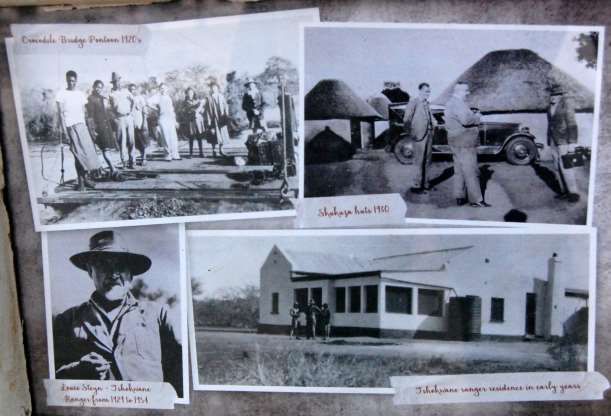
African Journal of Hospitality, Tourism and Leisure, Volume 7 (2) - (2018) ISSN: 2223-814X
         Copyright: © 2018 AJHTL - Open Access- Online @ http//: www.ajhtl.com

There are currently 27 separate accommodation nodes in the Kruger National Park consisting of 12
large rest camps, two small rest camps, five bushveld camps, two bush lodges, two camping camps,
two overnight hides, a former ranger’s house and one tented camp (Table 2). In addition, there are
24 concession lodges in the park, including the contractual areas, and 10 wilderness trail camps
(Table 2).

In the 86 years for which detailed visitor statistics are available, visitor numbers have exhibited a
sustained increase. In only 20 years of the total period were declines on the previous year’s visitor
figures recorded. These declines often coincided with political unrest or global economic recession
(SANParks, 2017). Visitors to the Kruger National Park doubled between 1934 and 1947, between
1947 and 1954, between 1954 and 1963 and again from 1963 to 1973. Visitors increased to 50,000
in 1948 and to 100,000 by 1955.

The park’s staff often could not keep track with the increase in visitors and innovative solutions, such
as erecting rows of tents, had to be found (Figure 5). In 1963 a total of 200,000 visitors were recorded
and in 1984 visitors totalled 500,000. In 2002 visitors exceeded one million for the first time. Taken
over the 90 years from when the first visitors entered the park, visitor numbers have grown by 67,323
fold to the latest figure of 1,817,724 for 2016/2017 (Figure 3).

Methodology

The latest visitor statistics supplied by SANParks were quantified, analysed and expressed spatially.
If the statistics are analysed in detail, they reveal regional differences between both the
distribution of visitor roads and accommodation amongst the four management regions of the Kruger
National Park (Map 1, Table 2).

Spearman’s correlation was used to assess the relationship between occupation rate and the size
of a rest camp. The outcome variable was the occupation rate of Kruger National Park camps and
the explanatory variable was the size of the camp. The null hypothesis is that there is no relationship
between the occupancy rate of camps and the size of each camp. The alternative hypothesis is that
there is a positive correlation between these two data. The scatter plot reveals that there is a weak
positive relationship between occupancy rate and the number of beds (rho= 0.16, p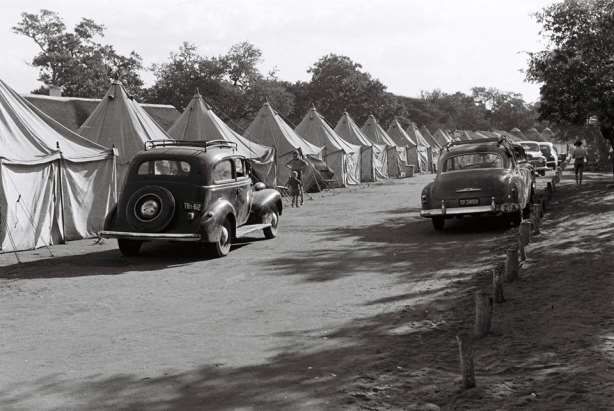
African Journal of Hospitality, Tourism and Leisure, Volume 7 (2) - (2018) ISSN: 2223-814X
             Copyright: © 2018 AJHTL - Open Access- Online @ http//: www.ajhtl.com

fenced-off portion of the iSimangaliso Wetland Park) covers 37,985 hectares and contains 97
kilometres of visitor roads, which equates to 391 hectares per kilometre of road.

These figures indicate that the density of visitor roads, even in the southern region of the Kruger
National Park, is lower than for the provincial game reserves in KwaZulu-Natal. Such a comparison,
however, is only the first step in the process. The number of day visitors travelling on the roads,
especially during peak holiday periods, and the number of hectares per bed also needs to be
calculated and compared to other protected areas.
Table 1: The four management regions of the Kruger National Park and length of visitor roads
    Region           Area         in   Tarred          Gravel         Total length of    Hectares   per
                     hectares          roads      in   roads     in   roads              km of road
                                       km              km
    Southern         419290            280             563            843                497.37
    Central          509239            203             443            646                788.29
    Northern         448148            213             418            631                710.22
    Far Northern     536410            187             255            442                1213.59
    Total            19130872          883             1679           2562               746.71

Visitor perceptions and distance to the entrance gates

The Kruger National Park measures 352 kilometres in length from south to north, and ranges in width
from 42 to 85 kilometres. The vegetation of the park is underpinned mainly by parallel bands of
igneous rocks such as granite, rhyolite, gabbro, gneiss and basalt, which give rise to 35 vegetation
types described by Gertenbach (1983). The two vegetation types where wildlife is described as
abundant are found in the southern or central regions (Gertenbach, 1983, 55, 68), while five of the
six vegetation types where wildlife is described as uncommon are situated in the far northern region
(Gertenbach, 1983, 62, 92, 93, 103, 110, 117).

Historically, the N4 and N12 roads from Johannesburg and Pretoria were the main access routes to
the park, and they still provide the shortest distance. (Figure 8). The improvement of the N1 as far
as Polokwane has done nothing to alter this pattern. If the toll road charges between Johannesburg
and Punda Maria, and Johannesburg and the nearest gate (Malelane), are calculated, the charges
differ by only 4% (Drive South Africa). However, the far northern Punda Maria Gate is 140 kilometres
further from Johannesburg than Malelane Gate is, and Pafuri Gate is 199 kilometres further. Historic
visitation patterns which have become established since 1927, customer perceptions that there is
little wildlife in the far northern region, and the concentration of privately-owned lodges outside the
park in the Mbombela and Bushbuckridge municipalities, are far more plausible explanations for the
preference of visitors in the southern and central regions.

The division of the Kruger National Park into four regions is a useful tool for analysing regional visitor
densities. In most instances, the boundaries of a region are a reasonable distance from the nearest
rest camp, so the regional analysis remains valid, although in some instances it is possible for visitors
who are staying in one region to travel into another region during the course of a day. If visitor roads
and all accommodation are taken into account, then the southern region comprises 21.9% of the
Kruger National Park, but contains nearly one-third of visitor roads (tarred and gravel) and 47.7% of
overnight accommodation.

Although the central region has a reputation of offering high quality game-viewing, in part due to an
extensive network of gravel roads which follow the meandering courses of the N’waswitsontso,
Ripape, Sweni, N’wanetsi and Timbavati rivers, this region accounts for 26.6% of the park’s surface
area but contains 18.2% of all accommodation (Dennis & Brett, 2000, 15). Unlike the southern region

2
 Calculated from the area of the 22 ranger sections combined, and including the Ngala concession land, the area of
the Kruger National Park is 5053 ha less than in the Kruger National Park Management Plan (2018). This may be due
to the inclusion of land in the north-western corner of the Makuleke contractual area.
                                                                                                                 10
African Journal of Hospitality, Tourism and Leisure, Volume 7 (2) - (2018) ISSN: 2223-814X
Copyright: © 2018 AJHTL - Open Access- Online @ http//: www.ajhtl.com
which is accessed through five entrance gates, a private entrance and Skukuza Airport, there is only
one entrance gate for the central region (Map 1).
Distance to Kruger National Park entrance gates
Pafuri 570
615
Punda Maria 511
556
Phalaborwa (N1) 476
521
Phalaborwa 474
498
Orpen 487
511
Crocodile Bridge 445
469
Malelane 392
416
Kruger 448
472
Numbi 407
431
Phabeni 406
430
0 100 200 300 400 500 600 700
Pretoria Johannesburg
Figure 8: Distance from Gauteng to the nine Kruger National Park entrance gates in kilometres
The northern region accounts for 23.4% of the park’s land area and contains 24.6% of all roads and
21.4% of accommodation. This is due to the presence of three large rest camps within this region,
including the 494-bed Mopani Camp which was completed in 1991.
The far northern region, mainly due to its perceived distance from major cities, although it comprises
28% of the park’s surface this region has 17.2% of visitor roads and 12.6% of visitor accommodation.
The relative lack of accommodation in the far northern region is later discussed under
recommendations.
11African Journal of Hospitality, Tourism and Leisure, Volume 7 (2) - (2018) ISSN: 2223-814X
Copyright: © 2018 AJHTL - Open Access- Online @ http//: www.ajhtl.com
Accommodation and roads per region
60
50 47,7
40
33,53 32,90
31,71
30 28,03
26,62 26,38
24,12 24,9 25,21 24,63
23,43 23
21,92 21,18 21,45
20 17,25 18,2
15,19
12,65
10
0
Land area Tarred roads Gravel roads All roads All Accommodation
Southern Central Northern Far North
Figure 9: Regional distribution of roads and accommodation in the Kruger National Park
As the 27 accommodation nodes vary in capacity from six beds for an overnight hide to 860 for
Skukuza, analysis should look at the size of each rest camp and determine whether size has an
influence on occupancy rate. The scatter plot (Figure 10) shows that there is a week positive
relationship between occupancy rate and the number of beds in a camp (rho= 0.16, pAfrican Journal of Hospitality, Tourism and Leisure, Volume 7 (2) - (2018) ISSN: 2223-814X
Copyright: © 2018 AJHTL - Open Access- Online @ http//: www.ajhtl.com
Map 1: The four management regions of the Kruger National Park Source: Author’s own
Table 2: Distribution of visitor accommodation in the Kruger National Park by management region
13African Journal of Hospitality, Tourism and Leisure, Volume 7 (2) - (2018) ISSN: 2223-814X
Copyright: © 2018 AJHTL - Open Access- Online @ http//: www.ajhtl.com
Rest camp3 Beds Camp- Total Wilderness Total Concession Total Total as Land
ing4 Trail lodge % of area as
total for % of
Kruger Kruger
Southern Region
Malelane 18 45 63 Wolhuter 8 Nkambeni 608
Berg-en-dal 357 246 603 Bushman 8 Buffalo Rock 20
Pretoriuskop 360 129 489 Napi 8 Jock 24
Skukuza 605 255 860 Jock Explorer 6
Biyamiti 70 0 70 FitzPatrick’s 6
Crocodile Bridge 74 60 134 Lukumbi 28
Lower Sabie 299 102 401 Lion Sands 18
Narina
Tinga Legends 18
Shishangeni 44
Camp Shonga 10
Camp Shawu 10
Total for region 1783 837 2620 24 792 47.7% 21.92%
Central Region
Talamati 84 0 84 Mathikithi 8 Rhino Post 16
Orpen 42 0 42 Sweni 8 Rhino Plains 8
Maroela 0 60 60 Olifants 8 Hamilton’s 12
Tamboti 124 0 124 Hoyo 12
Satara 416 309 725 Imbali 24
Roodewal 18 0 18 Ngala 45
Balule 18 45 63 Ngala Tented 12
Camp
Singita Sweni 12
Singita 30
Lebombo
3
Camps are arranged from west to east and south to north
4
Based on an average of three people per campsite
14African Journal of Hospitality, Tourism and Leisure, Volume 7 (2) - (2018) ISSN: 2223-814X
Copyright: © 2018 AJHTL - Open Access- Online @ http//: www.ajhtl.com
Total for region 702 414 1116 24 171 18.2% 26.62%
Northern Region
Olifants 276 0 276 Olifants 8
Backpacker
Sable Dam Hide 9 0 9 Lonely Bull 8
Backpacker
Letaba 378 180 558
Shimuwini 71 0 71
Boulders 12 0 12
Tsendze 0 102 102
Shipandani Hide 6 0 6
Mopani 494 0 494
Total for region 1246 282 1528 16 0 21.45% 23.43%
Far Northern
Bateleur 34 0 34 Mphongolo 8 The Outpost 24
Backpacker
Shingwedzi 235 180 415 Nyalaland 8 Pafuri Camp 32
Sirheni 80 0 80 Baobab Hill 8
Bush House
Punda Maria 78 183 261 Makuleke Eco- 20
training
Pafuri Border 21 0 21
Total for region 448 363 811 16 84 12.65% 28.03%
Total for Kruger 4179 1896 6075 80 1047 100% 100%
Park
Has visitor capacity been exceeded?
The Kruger National Park currently contributes R825 million annually directly to the regional
economy of the Lowveld (Kruger National Park Management Plan, 2018, 29). At present, 78.4% of
the total of 1.8 million visitors are day visitors and Open Safari Vehicles (OSVs) accounted for
246,662, or 13.5%, of all visitors (Ferreira & Harmse, 2014, 28; SANParks, 2017). Visitor crowding
during peak holiday periods is not a new trend in the Kruger National Park (Figure 14), but increasing
visitor numbers are resulting in considerable pressure, particularly in the southern region (Figure
15).
Apart from its direct economic contribution to the region, the park indirectly supports more than 200
neighbouring lodges (Map 3). Many of these lodges are located on the private game reserves
15African Journal of Hospitality, Tourism and Leisure, Volume 7 (2) - (2018) ISSN: 2223-814X
Copyright: © 2018 AJHTL - Open Access- Online @ http//: www.ajhtl.com
adjacent to the Kruger National Park, such as Sabi Sand, Timabavati, Klaserie and Balule. Private
game lodge owners often take their visitors to the Kruger National Park, and make use of entrance
gates such as Orpen, but the majority of OSVs originate from companies based in Hazyview, White
River and Nelspruit (Mbombela).
In total, 86% of all OSV entrants originate from five entrance gates in the southern region, as well as
Skukuza Airport and the private Mjejane Game Reserve on the Crocodile River on the southern
border (Figure 11). However, of the total, 64% of all OSVs are entering at just three gates – Numbi,
Phabeni and Kruger – which is indicative of a concentration of operators in Mbombela Municipality.
Mpumalanga International Airport is located 76 kilometres from the two nearest entrance gates.
Although there is opposition to these vehicles from other park users, OSVs offer a distinct advantage
from the perspective of visitor management as the average OSV carries 6.6 visitors compared to 3.4
for ordinary cars (Kruger & Saayman, 2014, 4). Opposition to OSVs from other visitors is due to the
behaviour of certain drivers at sightings of predators and Big Five species, the fact that many OSVs
are in radio contact and soon congregate at a sighting, and the accusation that the drivers are
inconsiderate of other park visitors.
OSV entrants to Kruger National Park
Skukuza Airport 3 022
836
Punda Maria 21
4
Phalaborwa 5 355
920
Phabeni 58 392
8 327
Orpen 29 388
4 164
Numbi 81 453
10 677
Mjejane 1 600
256
Malelane 25 328
3 846
Kruger 24 299
4 861
Crocodile Bridge 17 804
3 218
0 10 000 20 000 30 000 40 000 50 000 60 000 70 000 80 000 90 000
No. of people No. of vehicles
Figure 11: Open Safari Vehicle (OSV) entrants to Kruger National Park for 2016/2017
When day visitors and OSV entrants are added to the concentration of hutted accommdation,
campsites and concession beds, this results in high visitor densities in the southern region which
exceed those of most other African national parks. The Kruger National Park is currently the only
savanna national park in Africa, and which offers a visitor experience based primarily on wildlife
viewing, which receives more than 500,000 visitors per annum (Institute of Economic Affairs, 2016;
World Bank, 2015, 37). The total number of visitors to all the national parks and national reserves
in Kenya for 2015 was 1,953,800, and the Tsavo National Park, which is approximately the size of
the Kruger National Park, received 108,000 visitors (Institute of Economic Affairs, 2016; The Kenyan
16African Journal of Hospitality, Tourism and Leisure, Volume 7 (2) - (2018) ISSN: 2223-814X
Copyright: © 2018 AJHTL - Open Access- Online @ http//: www.ajhtl.com
Camper, 2016). As one of the core tenets of ecotoursim is that it is not mass tourism, and as large
numbers of visitors can disrupt animal behaviour and create a host of problems, large concentrations
of visitors are consdiered to be incompatible with this brand of tourism (Ferreira & Harmse, 2014,
20). Ferreira and Van Zyl (2016) describe the “McDonaldization” of casual dining in the park and
summarise the issue as follows, “the idea of establishing franchised restaurants in a nature-based
tourism destination, such as KNP, was met with divided opinions, polemical discourse and scholarly
argument about the issue of mass tourism to national parks” (Ferreira & Harmse, 2014, 49).
Although the southern region contains 47.7% of accommodation, SANParks is proceeding with the
development of two lodges and a development in Skukuza which will add 550 to SANParks’ beds,
or 31%, to a region that is already carrying considerable visitor volumes (Ferreira & Harmse, 2014,
26). The response in 2016 by the then-CEO, David Mabunda, was to say, “The inbound tourism
market and the emerging middle class have repeatedly demanded a product that provides a full
service in addition to the safari experience without ‘Disney-fication’ of the park… guests to the hotel
will not be driving in the park as guests of the camps do, they will be offered a ‘park and-ride’ service
very similar to that of private game lodges…So instead of having a typical N1 highway traffic
congestion…we will have these cars neatly tucked away and fill up existing park game drive vehicles,
which are running at 50% occupancy, to enhance the game-viewing experience in the most
appropriate way and help towards reducing the menace of traffic on the park's roads" (Siyabonga
Africa).
At an officiating ceremony in Skukuza in 2017, the response from government was to quote figures
which indicate that the Kruger National Park does not have a visitor crowding problem. At the launch
of a R269 million ($22.6 million) hotel development, the Minister of Environmental Affairs stated, “the
development also heralds the beginnings of the development of the first of the SANParks owned
brand of Wild Hotels, Lodges and Resorts. We are therefore, confident that this facility will not
significantly increase the human footprint of the park as plans are underway to ensure that patrons
to Skukuza Safari Lodge will either be transported by charter flights or group transport like tour
busses…the current development footprint in the Kruger National Park, comprising of tourist
facilities, staff housing, tourists roads, support infrastructure and management roads, currently
constitutes 6,285 ha or 0.3% to the total of 2,000,000 ha of the park. In terms of international IUCN
standards a park could be developed to 10% of its size. This means the claims of over-development
and over commercialisation of the Kruger National Park are exaggerated and unfounded” (Steyn,
2017).
While the argument that only 0.3% of the park is developed has some validity, the point being missed
is that the 1.8 million visitors per annum are restricted entirely to this 0.3% of the park’s surface. If
10% of the park were to be developed, according to the IUCN standards, does this means that the
Kruger National Park could accommodate 60 million visitors per annum? The most visited national
park in the United States of America received 11.338 million visitors in 2017, so such a figure would
have no international precedent (National Park Service).
A survey of a social media group supports the view that visitor numbers, at least during school
holidays and perhaps at other times of the year, have reached levels where they constitute a definite
management problem (Ferreira & Harmse, 2014, 30). A questionnaire conducted amongst 255
members of a social media group reveal that a majority believe that the Kruger National Park is
receiving too many visitors during school holidays (51.7%) while a further 38.8% felt that the park is
receiving too many visitors. Only 5% of respondents believed that the park is not receiving too many
visitors (Figure 12).
However, a total of 308 respondents replied to questions about visitor crowding in the southern
region, where 47.7% of accommodation is concentrated, and 90.9% believed that the region is
carrying too many visitors. Of the total, only 5.5% disagreed with the statement (Figure 13).
17African Journal of Hospitality, Tourism and Leisure, Volume 7 (2) - (2018) ISSN: 2223-814X
Copyright: © 2018 AJHTL - Open Access- Online @ http//: www.ajhtl.com
Are there too many visitors in Kruger?
140 132
120
99
100
80
60
40
20 13
8
3
0
During school Yes No Too many tourists Undecided
holidays
Figure 12: Respondents’ views of current visitor numbers in Kruger National Park
Are there too many visitors in southern Kruger?
300 280
250
200
150
100
50
11 17
0
Yes Undecided No
Figure 13: Respondents’ views of current visitor numbers in the southern region of Kruger National Park
18African Journal of Hospitality, Tourism and Leisure, Volume 7 (2) - (2018) ISSN: 2223-814X
Copyright: © 2018 AJHTL - Open Access- Online @ http//: www.ajhtl.com
Figure 14: Traffic congestion whenever predators were encountered was already reported as early as the 1950s
Source: South African Railways calendar, www.flickr.com/photos/hilton-t/4001704864
Figure 15: Traffic congestion in the southern region of the Kruger National Park during school holidays including
two Open Safari Vehicles (OSV) Source: Author’s own
19African Journal of Hospitality, Tourism and Leisure, Volume 7 (2) - (2018) ISSN: 2223-814X
Copyright: © 2018 AJHTL - Open Access- Online @ http//: www.ajhtl.com
Figure 16: Opened in 1995, Tamboti Tented Camp on the Timbavati River is currently the only exclusive tented
camp in the Kruger National Park Source: Author’s own
Figure 17: Completed in 1984, Berg-en-dal Rest Camp in the south-western corner of the southern region,
represents a departure from the Kruger National Park’s traditional architecture style Source: Author’s own
20African Journal of Hospitality, Tourism and Leisure, Volume 7 (2) - (2018) ISSN: 2223-814X
Copyright: © 2018 AJHTL - Open Access- Online @ http//: www.ajhtl.com
Current developments are adding an additional 550 beds in a region already carrying high visitor
volumes, and an unfenced tented camp is proposed for Nkuhlu, which was not included in the 2018
management plan (Reed, 2017; SANParks, 2018a, 99). The revised management plan of 2011
included the provision of one additional entrance gate and rest camp, five tented camps, four
camping camps, eight overnight hides and nine picnic sites. The camping camps were proposed for
the northern and far northern regions, as were three of the five tented camps. Taking current norms
into account, the proposed facilities would probably have added an additional 12% to the bed
capacity of the park.
In the revised 2018 management plan, there has been a refinement of the proposed developments
and the list has been altered to include one wilderness camp, two platforms, two overnight hides,
two picnics sites, two tented camps, and two lodges on the border of the park. The camping camps
have been omitted and the number of tented camps reduced to two. There has also been a reduction
in the picnic sites proposed for the southern region from five to two, and the proposed peripheral
development at Phalaborwa was not included in the 2011 plan. A tented camp and a rest camp has
been proposed for the central region which has a lower bed density rate than the southern region.
Kruger and Saayman (2014, 6) found that visitors to the northern half of the Kruger National Park
rated “education” as their main motivator for visiting the region, while visitors to the southern half
recorded “escape”. Given the distances from Gauteng and visitor perceptions that there is less
wildlife to be seen in the northen and far northern regions, it impractical to develop the northern half
of the park as an alternative destination to the southern and central regions. This is acknowledged
in the latest management plan, which states, “Kruger North does not have a potential to generate
income comparable with that of the South” (SANParks, 2018a, 39).
Although the current number of visitors entering the Kruger National Park is not high when compared
to certain American national parks, the number is very high for the standards set by nature-based
tourism in Africa (World Bank, 2015; Institute of Economic Affairs, 2016; National Park Service,
2018). The sub-culture which has developed since 1927, where visitors are at liberty to traverse the
park on their own and without a guide, results in a high number of vehicles. Other management
options are available, such as guided drives in larger vehicles during peak holiday periods, but these
could well be met with customer resistance.
Recommendations - proposals for the future
The latest statisitics reveal that 1,817,724 visitors entered the park in the 2016/2017 year, which
represents a doubling in 15 years from 2001/2002 (SANParks, 2017). In three of the last five years,
the annual rate of increase has exceeded 6% per annum. At a 6% rate of increase, visitor numbers
will double to 3.65 million by 2028/2029.
Maps 2 and 3 reveal that in the 57 years since 1961 there has been a considerable increase in both
visitor roads and accommodation in the Kruger National Park. Tarred roads now radiate from five
entrance gates in the southern region and travel north to within seven kilometres of the Zimbabwe
border. Since 1961, the number of accommodation nodes has increased from 14 to 27, and there
are an additional 24 concession lodges in the park. Concurrently, tourism has increased in the
districts adjoining the park, and there has been a significant increase both in the number of private
game reserves and privately-owned lodges. The Lowveld of Mpumalanga and Limpopo has become
one of South Africa’s foremost tourist regions. The latest income statements reveal that the Kruger
National Park generated R825 million in the 2016/2017 financial year (SANParks, 2018a, 29). The
majority of people employed in the park originate from the eight municipal areas bordering the park
(SANParks, 2018a, 29). The direct and indirect economic impact of the park was calculated in 2006
as R496 million (Saayman & Saayman, 2006, 76), and could exceed R1.7 billion now. Tourism
accounts for 5.97% of the GDP of Mpumalanga province, or twice the national average for South
Africa (Saayman & Saayman, 2006, 77).
21African Journal of Hospitality, Tourism and Leisure, Volume 7 (2) - (2018) ISSN: 2223-814X
Copyright: © 2018 AJHTL - Open Access- Online @ http//: www.ajhtl.com
While tourism has increased significantly since 1961, the success of the industry does not detract
from the ongoing problem of poverty in the Lowveld region. Eight municipalities in Mpumalanga and
Limpopo border and include the Kruger National Park, and in 2016 their population was 3,055,319
(Municipalities of South Africa). If the area of the park is excluded, this equates to a population
density of 93.5 people per km² for 32,648 km², or more than twice the average for South Africa of
45.8 people per km². In reality this population density is much higher as the private game reserves
(Map 3) have a very low human population (SANParks, 2018a, 96).
Carruthers (1995) states, “the white public of South Africa has come to regard its national parks with
a considerable degree of pride, and these areas have come to symbolize the morality of protecting
the wildlife heritage of the nation…Moral altruism, however, merely obscures the political and
economic reality of conservation issues and unless the ‘other side’ of conservation is appreciated,
understood and taken into account, there may be little left to conserve – even within national parks”
(89).
SANParks is determined to increase the number of black visitors to national parks, and black visitors
now comprise 41% of South African day visitors, but only 11.7% of South African overnight visitors
to the Kruger National Park (SANParks, 2017). Despite the concentration of more than three million
people in the former homelands of KaNgwane, Gazankulu and Venda on the park’s western border,
black visitors still do not comprise the majority of local day visitors.
The following recommendations could help to alleviate the problems caused by an increasing influx
of visitors to the Kruger National Park:
1. Better management of OSVs
There is considerable opposition on social media to the Open Safari Vehicles (OSVs). Opposition
arises from the tendency of drivers to monopolise sightings of predators, the fact that they are in
radio contact and can quickly access a sighting, and the perception that they disregard other visitors.
Due to the fact that many OSVs originate from private game reserves and towns bordering the Kruger
National Park’s southern and central regions, this concentration is also resulting in conflict between
OSV operators and other visitors in the two regions of the park which are already carrying high visitor
volumes (Ferreira & Harmse, 2014, 28; SANParks, 2017).
However, in 2016/2017 the average OSV carried 6.6 visitors, and the game-viewing trucks operated
by SANParks carry nine or 20 visitors. The problem with driver-led drives may therefore be more
one of management of this sector, rather than to outlaw it. Not only are OSVs currently carrying
13.5% of the visitors entering the Kruger National Park, but the latest reliable statistics indicates an
increase on the previous year of 16.8% (SANParks, 2017). The environmental impact of fewer
vehicles carrying a higher number of visitors will be less than for a large influx of private vehicles
cqarrying an average of 3.4 visitors per vehicle.
2. Park and Ride
The “Park and Ride” scheme is a joint venture between SANParks and Vuswa Fleet Services and is
a recent initiative aimed at empowering communities on the periphery of the park (SANParks,
2018b).
The scheme operates from Numbi, Phabeni and Kruger gates, and will be extended to additional
entrance gates. The duration of each drive is four hours, and two drives depart per day from the
affected gates. The scheme has considerable merit and SANParks should consider “value adds”
such as including meals cooked by local people in the bush, or allowing drivers to access roads
closed to the general public, and other incentives which would encourage visitors to leave their cars
at the entrance gates. A “Park and Ride” scheme will be implemented for the new Malelane Lodge.
22African Journal of Hospitality, Tourism and Leisure, Volume 7 (2) - (2018) ISSN: 2223-814X
Copyright: © 2018 AJHTL - Open Access- Online @ http//: www.ajhtl.com
3. Peripheral developments
The 2018 management plan proposes two peripheral developments at Phalaborwa and at Shangoni
near the Shingwedzi River, and two lodges have been approved at Malelane and Skukuza
(SANParks, 2018a, 99).
There are four, state-owned nature reserves (Map 3) bordering the Kruger National Park. These
protected areas should be incorporated into the Kruger National Park and will add 84,000 hectares
to the park. The 2018 management plan presents a strong case for incorporating these protected
areas into the park (SANParks, 2018a, 103, 232). As these four provincial natuire reserves are
located in former homelands, potential exists for job creation and local poverty alleviaton.
4. Regional branding
The Kruger National Park brand is internationally known but a “one size fits all” approach should be
reconsidered (Kruger & Saayman, 2014, 2, 6). SANParks accepts that the northern and far northern
regions can accommodate fewer tourists, although the construction of the 494-bed Mopani Camp in
1991, which is the 5th largest camp in the park, was out of step with this acknowledgment. This
camp has the lowest occupancy rate of any of the park’s 12 large camps. The bushveld camps in
the northern and far northern regions have a far lower occupancy rates to Biyamiti and Talamati, the
two bushveld camps in the southern and central regions. Biyamiti has the highest unit occupancy
rate in the Kruger National Park at 95.1%, while Sirheni, in the far northern region, has an occupancy
rate of only 54.8% (SANParks, 2017).
Consideration should therefore be given to the separate branding of Kruger’s four regions and the
retention of the far northern region as a remote wilderness. The introduction of the Pafuri Border
house, which accommodates 21 visitors in a former ranger’s house, is in line with such a separate
branding. As part of the separate branding, consideration could be given to the construction of small,
exclusive camps, such as Balule, which could be unfenced and cater for visitors seeking a wilderness
experience. Such camps could be made accessible only by 4x4 vehicles and would cater to the
considerable nostalgia, and an interest in the park’s history, which exists amongst many visiitors
(Saayman and van der Merwe, 2008, 157).
The average overnight length of stay in the Kruger National Park for hutted accommodation is only
1.74 nights per visitor, which is suprisingly low for an internationally recognised tourist destination
(SANParks, 2017). SANParks should consider ways to encourage longer length of stay in the rest
camps, such as Mopani, where occupancy rates are lower than the average for the park. The tourism
industry has much expertise in creating “value adds” and these successes could be applied to the
northern and far northern regions.
Conclusion
The Kruger National Park faces many challenges and its undisputed success over the past 90 years
could well prove to be its downfall. While the park has undoubtedly been a success on many levels,
the natural system has limitations. Electronic word-of-mouth has become increasingly important in
the tourism industry, and the Kruger brand is being damaged by negative word-of-mouth in social
media sites (Litvin, Goldsmith & Pan, 2008, 461). Apart from environmental degradation, water
provision problems and visual pollution, increasing volumes of poorly-managed visitors are going to
damage the Kruger brand (de Bruin, 2011).
23African Journal of Hospitality, Tourism and Leisure, Volume 7 (2) - (2018) ISSN: 2223-814X
Copyright: © 2018 AJHTL - Open Access- Online @ http//: www.ajhtl.com
Map 2: Visitor roads and rest camps in the Map 3: Visitor road and rest camps in the Kruger
Kruger National Park in 1961 Source: Author’s own National ParkPark in 2018, including the
adjoining national park in Mozambique
Source: Author’s own
24African Journal of Hospitality, Tourism and Leisure, Volume 7 (2) - (2018) ISSN: 2223-814X
Copyright: © 2018 AJHTL - Open Access- Online @ http//: www.ajhtl.com
The Kruger National Park currently receives the highest number of visitors for any African national
park where wildlife viewing is the primary attraction. Research by Saayman and van der Merwe
(2008, 157) recorded “escape” followed by “nostalgia” as the two most important motivators amongst
2899 visitors. Given the importance of these motivators, arguing that the Kruger National Park is
not over-developed is unlikely to succeed in avoiding criticism that the park is overcrowded.
The ecotourism market has grown significantly since 1927 and has become highly competitive.
There are national parks located within one to two hours of major cities which offer a high quality
wildlife experience. Considerable improvements in the South African road network also make it now
possible to visit a national park over a weekend. Continuing negative word-of-mouth on social media
poses a potential danger to the Kruger brand. At the same time government regards the national
park as a vital tool for the alleviation of poverty in the Lowveld (Steyn, 2017).
Although poverty remains a serious problem for the park’s neighbours, the success of the Kruger
National Park should not be used as an excuse by provincial and national government to neglect
their obligations to uplift impoverished communities. As the tourism industry contributed R127.9
billion ($10.7 billion) directly - or only 3% of the total – to the South African GDP in 2016, the Kruger
National Park, on her own, cannot be regarded as a panacea for all the socio-economic problems
afflicting 5% of the national population (World Travel and Tourism Council, 2018, 3). If the park is
regarded as being largely responsible for the upliftment of three million people, then considerable
pressure will be exerted on the sustainability of the system. In the 2018 Kruger National Park
Management Plan, the report states, “an Integrated Regional Land Use approach requires a
systemic approach for the integration of National Parks into the broader economic and social
landscapes through appropriate strategies, mechanisms and incentives and through encouraging
complementary economic activity. It promotes and improves conservation and ecosystem services,
transboundary catchment management, allows for sustainable natural resource use, whilst unlocking
direct commercial benefits to communities, and developing the necessary skills and capacity”
(SANParks, 2018a, 103).
The integration of national parks into integrated regional land-use remains highly contested territory.
Since 1961 there have been no fewer than eight boundary adjustments (Map 2) which suggests that
national parks are never inviolate and ultimately depend on the political will of the majority, including
impoverished communities living on the western boundary. In a number of instances, there has
been an increase in the national park’s land area and its adjoining suite of private game reserves,
but such developments are ultimately dependent on political will. Although a national park can never
be viewed as “a world apart”, and attempts were made in the past to market the Kruger National
Park as such (Carruthers, 1995, 86, 87; Carruthers, 1997, 129) but neither is a national park a nature-
based theme park that is open for “Disney-fication” and cannot be developed indefinitely (Ferreira &
Harmse, 2014, 28, 29). For the Kruger National Park to make a meaningful contribution to alleviating
poverty in the region, tourism development must be carefully integrated and part of a basket of
government interventions and development projects (Ferreira & Harmse, 2014, 31). What can be
done to preserve the core asset and at the same time deliver on socio-economic and regional
development objectives?
At current rates, visitors to the Kruger National Park will double within 11 years, but SANParks has
no plans to double roads or accommodation. Balancing the many and often conflicting demands
placed on the park will require considerable foresight and skilled management. More effective
management of visitors, particularly during peak holiday periods, and innovative solutions to the
problems created by visitor overcrowding remain urgent research priorities.
Acknowledgments
I wish to acknowledge the contribution of Joep Stevens, General Manager of Strategic Tourism Operations at SANParks,
who supplied the raw data of visitor statistics.
25You can also read