Workforce Profile: April 2021 - SALLY KIPPING: HR MANAGER - Waverley Borough Council
←
→
Page content transcription
If your browser does not render page correctly, please read the page content below
Workforce Profile: April
2021
SALLY KIPPING: HR MANAGER
Waverley Borough Council Workforce Profile: April 2021
Overview:
As at the 1st January 2021, there were 421 employees working for Waverley Borough Council.
These are split by service as follows:
Avg No. Employees in Q3 % of Waverley
Service employees
2020/21 (Oct – Dec 2020)
Business Transformation 56.67 13%
Commercial Services 65.33 15%
Environmental & Regulatory Services 42.5 10%
Finance & Property 36 9%
Housing Operations 65.67 16%
Housing Delivery & Communities 37 9%
Planning & Economic Development 68.33 16%
Policy and Governance 43.17 10%
Audit 2 0.5%
CE, Directors, PA 6 1%
This profile examines how these staff are grouped by age, gender, those who identify as
having a disability, race and religion.
The report has sections on:
Impact on staff: Covid-19
Flexible working arrangements
Turnover reviewing against local and national trends
Sickness absence trends, patterns and underlying causes.
Finally, it reports on work that is ongoing within the Human Resources Department to combat
the issues identified as a result of this analysis.
1|Page
Waverley Borough Council Workforce Profile: April 2021

Profile by age, gender, disability, race and religion:
AGE

The staff age distribution has been constant over the past 3 years, with a high percentage of
staff at the age between 40 – 60 years. The average age of the staff however has shown a
slight increase of overall 2% from 2018 to 2020.

                          Average Age
                                                           47.2
                                 46.8
           46.1

           2018                  2019                      2020

                    Age distribution over the years
                                                                     140 141
                                                            125             126
                                                     107 110
                                    91 89
                    57                       66
                         47 46                                                      51 49 45

      7 6 5                                                                                    5 8 8

       16 - 20       21 - 30            31 - 40          41 - 50          51 - 60    61 - 70    71+

                                                  2018    2019     2020

GENDER

Waverley Borough Council recorded approximately 64% female and 36% male staff as on 31st
December 2020. The division of gender has been relatively stable over the last few years.

Planning and Economic Development and Housing Operations together employ
approximately 20% of the total female workforce. Other services employing a high percentage
of women are Policy and Governance and Commercial.

2|Page
Waverley Borough Council Workforce Profile: April 2021
Gender Split Gender By Service
Fin & Prop 6% 2%
Env & Reg 7% 3%
36% BT 7% 9%
Hsg Deliv & Comm 7% 2%
Commercial 8% 5%
Female, Pol & Gov 8% 3%
64%
Hsg Ops 10% 5%
Plan & Eco Dev 10% 6%
Female Male
Gender by Grade:
The following chart shows the distribution of gender by grades. It draws attention to the top
few Grades 1, 2 and DIRA (Directors) where Female representation is low or non-existent. It
should be noted that Grades 3 and 4 (which might be expected to be the ‘feeder’ grades into
the Senior Management Team) are predominantly female.
Gender By Grade
75%
100%
100%
17%
29%
42%
44%
35%
26%
28%
26%
45%
26%
60%
100%
50%
57%
29%
50%
50%
83%
74%
74%
74%
72%
71%
71%
65%
58%
56%
55%
50%
50%
50%
43%
40%
25%
Female Male
Gender Pay Gap
As might be expected from the above gender profile, Gender Pay Gap figures recently
published using a snapshot of data from 31 March 2020 indicate
The mean gender pay gap was 14.53%
The median gender pay gap was 11.76%
3|Page
Waverley Borough Council Workforce Profile: April 2021

                Mean                                               Median

           WOMEN EARNED                                             WOMEN EARNED
                0.85£                                                    0.88£
     FOR EVERY £1 EARNED BY MEN                               FOR EVERY £1 EARNED BY MEN

The below table shows the comparison with previous years’ data:

                      Mean          Median
      2017           16.6%           13.6%
      2018           14.5%           11.5%
      2019           15.4%            7.8%
      2020           14.53%         11.76%

The trends in data indicate that the overall trend in the gender gap is gradually decreasing however
progress will continue to be slow whilst there continues to be a lack of diversity within the senior
management team.

POSITION TYPE

          Position Type                                  Position Type By Service
                                               Env & Reg                               49%
                                                                                             51%
                                              Fin & Prop                         42%
                                                                                                   58%
                                               Pol & Gov                        40%
       Part                                                                                        60%
       Time                               Plan & Eco Dev                    38%
                                                                                                    62%
       36%
                                                     BT                     37%
                                                                                                     63%
                                       Hsg Deliv & Comm                    35%
                                                                                                         65%
                          Full
                         Time                Commercial                   33%
                                                                                                          67%
                         64%                                       27%
                                                Hsg Ops                                                    73%
                                                              Part Time     Full Time

4|Page
Waverley Borough Council Workforce Profile: April 2021

Waverley offers many of its employees the ability to work in an agile way and the
impact of the global pandemic has forced the Council to accept and support very
different working practices in 2020. Most employees may work on a flexi time basis in
order to manage their work/life balance in a more effective way.

Data taken as at 31 December 2020 indicate that 36% of Waverley’s staff work on a
part time basis. The above table shows the distribution of staff within each service
employed in full time and part time positions. Housing Operations has 73% of its staff
working full time, whereas Environment and Regulatory Services the distribution of
staff choosing to work full time vs part time is almost equal.

Part time working has been severely impacted nationally by the pandemic and the
ability of the Council to offer meaningful, interesting and well-paid work to part time
workers is a valuable benefit to the wider community.

Workforce Equality, Diversity and Inclusion Data

The data on the below areas is not truly representative as many employees who have
either selected the option of ‘declined to specify’ or have chosen not to record some
aspects of their personal data.

Several communications have encouraged staff to complete the sensitive information
page, including reminders in Cascade. These communications do have an impact on
reporting, however there are still data gaps.

Disability (Data as at 31 December 2020)

                               Not known,
                                  0.5%

                                                         Not stated,
                                                           32.8%

                          Not disabled,
                             59.4%
                                                                        Declined to
                                                                       specify, 2.6%

                                                                Disabled,
                                                                  4.8%

                                Disability Status

5|Page
Waverley Borough Council Workforce Profile: April 2021

Waverley Borough Council is a Disability Confident Employer. This means that as an
employer the Council we challenge attitudes towards disability by removing barriers to
disabled people and those with long term health conditions.
To support this, we use services such as Access to Work and our Occupational Health
Service to identify reasonable adjustments that we can make to the workplace to keep
those people who identify as having a disability in employment and enable them to
reach their potential.

Ethnic Origin (Data as at 31 December 2020)

The data indicates that more than 68% of the staff are White – British by origin. 23%
have not stated their ethnicity. 2% of staff identify as from either Black or Asian
ethnicities (BAME).

                                            Staff By Ethnic Origin

                      White - British                                             68.4%

                          Not Stated                     22.8%

               White - Other White          4.8%

                         White - Irish   1.4%

       Asian or Asian British - Indian   0.7%

   Black or Black British - Caribbean    0.5%

            Mixed - White and Asian      0.2%

               Mixed - Other Mixed       0.2%

        Black or Black British - Other   0.2%

      Black or Black British - African   0.2%

 Asian or Asian British - Other Asian    0.2%

              Any other background       0.2%

Following the Black Lives Matters protests in Summer 2020, the Council reflected on
its own approach. As a result of this, we now have a dedicated Race Equality Focus
Group that works on equality issues with a particular interest in ethnicity. The Group
has worked on three main strands:

               1. Education – providing a programme of education on equality issues to
                  help people reflect, understand and become anti-racist.
               2. Diversity Calendar celebrating and acknowledging important events
                  throughout the year on several equality issues (not wholly race related)

6|Page
Waverley Borough Council Workforce Profile: April 2021
3. Supporting those who encounter micro aggressions – we have just
launched the Active Citizens scheme
Religion (Data as at 31 December 2020)
30% of our employees have chosen to not declare their religion. Around 38% identify
themselves as Christian.
Staff By Religion
37.3%
31.0%
28.3%
2.4%
0.2% 0.2% 0.2% 0.7%
Buddhist Jewish Muslim Hindu Other None Not stated Christian
Corporate Equalities Group
The Council has a Corporate Equalities Group chaired by a Head of Service which
regularly meets to discuss equalities issues. The group also review equalities
policies and processes including Equality Impact Statements. Some of the initiatives
in 2020 are shown below:
Spreading awareness about diversity and inclusion by articles published in
Backstage and cascade about different race, ethnicity, gender, sexual
orientation, socio-economic status, age, physical abilities, religious beliefs, or
other ideologies. These include: Black History month, LGBT+ history,
Holocaust Memorial, Alzheimer’s day, Rosh Hashanah, Yom Kippur, Diwali,
Dyslexia, Navratri, Christmas, Hanukah.
Time to talks for all staff including ‘Being yourself at work’ focussed on
LGBTQ+ month but also encouraging workplace trust and authenticity for all.
Equality group conversations on Teams channel – Human Rights Day, issues
and status of LGBTQ+ rights awareness through popular films, documentaries
and books.
7|Page
Waverley Borough Council Workforce Profile: April 2021
Impact of Covid-19 on staff
Direct impact of the pandemic:
The Council were fortunate in that infection rate for Covid-19 was low and there were
no deaths reported within the work force. There are a low number of reported long
Covid-19 symptoms still being experienced by staff. Long Covid-19 predominantly
impacts on women aged over 45 (which reflects our workforce profile).
The direct impact of Covid-19 however should not be under-estimated as several
officers reported severe impacts within their families including bereavement,
hospitalisation and loss of work/income as a direct result of the pandemic. Many
officers had to juggle their employment and home schooling their children which led to
high levels of stress. Officers also saw their work rapidly change in terms of their
working environments (having to suddenly work from home), their systems usage and
the demand on them. Many Services experienced increases in demand whilst trying
to cope with the changes.
The Council made several initiatives to support people including:
Introducing light breaks, time to talks
Changing policies rapidly including increasing special leave for carers,
developing changes to flexible working, the Return to Office Working policy,
Home Working Guidelines, Site Visit Guidance and Digital Meetings
Guidance.
Redeploying staff to support business critical initiatives such as supporting
shielded and vulnerable people.
Sending out regular communications including FAQs
Increasing wellbeing events across the year.
Absence from work due to sickness
Working Days Lost Due To Sickness
399
376 362
340
322
290 295 289 304
258 250 243 247
241 232
207 219
202
165 170 176
145 254
124
Jan Feb Mar Apr May Jun Jul Aug Sep Oct Nov Dec
2019 2020
8|PageWaverley Borough Council Workforce Profile: April 2021
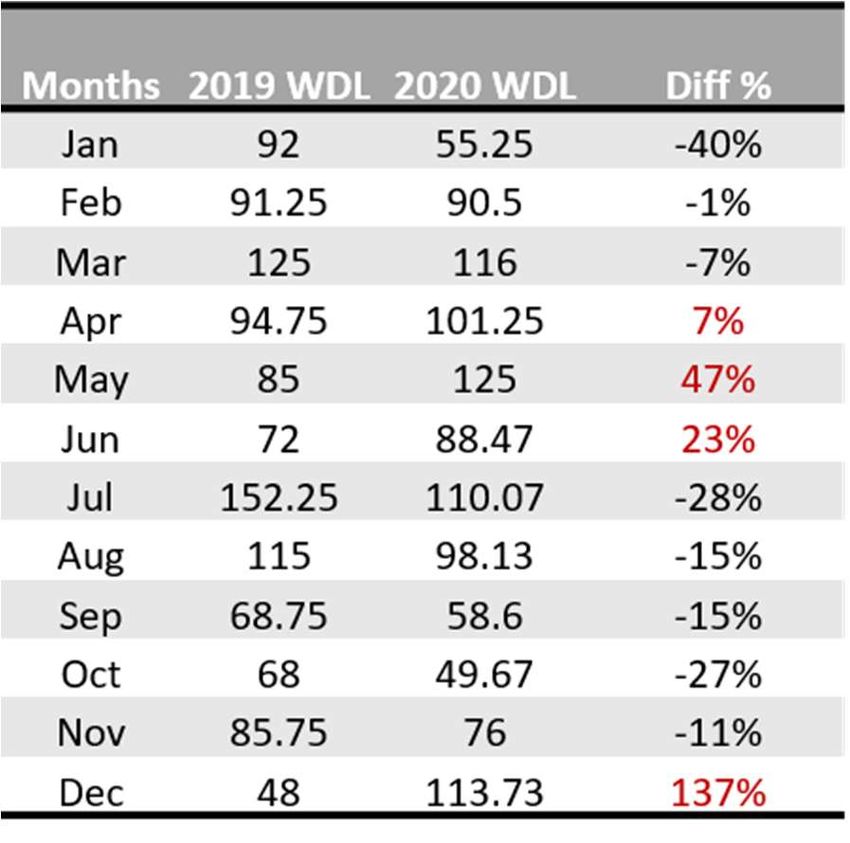
Top 10 sickness absence reasons in 2020
Mental health related sickness contributed to around 39% of the total sickness
absences in the year 2020.
Please note: the reasons marked with an asterisk (*) are reasons which have been
grouped together.
The category ‘Mental Health’* includes the following absence reasons: anxiety;
stress; depression; bipolar; panic attacks and post-traumatic stress disorder.
‘Musculoskeletal’* includes arm; elbow; back; hand/wrist/fingers; heel/foot/toe; hip;
neck; rheumatoid arthritis and sciatica.
‘Gastrointestinal’* includes abdominal pain; diarrhoea; vomiting and nausea.
Sickness (Mental Health)
Mental Health - Work Days Lost
152.25
125 125
101.25 110.07 115 113.73
116
92 94.75 98.13
91.25 85 88.47 85.75
90.5 72 68.75 76
68
55.25 49.67
58.6 48
Jan Feb Mar Apr May Jun Jul Aug Sep Oct Nov Dec
2019 WDL 2020 WDL
9|PageWaverley Borough Council Workforce Profile: April 2021
As could be anticipated, there were two key peaks in mental health over the year
reflecting the lock downs in March and November/December and the concerns about
the pandemic. The lowest period of the year was August/September/October,
possibly reflecting the period of the year in which most annual leave is taken (as this
is the end of the leave year). This underlines the importance of taking regular leave,
even during a time when taking a holiday was difficult.
Mental Health Working days lost comparison:
As part of our wellbeing planning, in April 2020 we ran a mental health survey with
officers. This showed that 58% of responders indicated that the pandemic had
impacted adversely on their mental health.
Has the recent developments around the Covid-19 pandemic affected your
mental health? If yes to what level?
27%
21%
18%
16%
9%
5%
3%
1%
Not Sure Not At All Somewhat Somewhat Moderately Moderately A Great Deal A Great Deal
Worse improved Worse Improved Worse Improved
10 | P a g eWaverley Borough Council Workforce Profile: April 2021
The survey identified that workplace demand was a key factor in poorer mental
health and that the most effective support was given by colleagues, line managers
and HR.
Use of EAP Services
Total 85 EAP sessions were delivered in 2020.
Mental health issues affect men and women equally, yet women are more likely to
seek treatment for a mental health issue. Our EAP providers (Wellbeing Solutions
Management or WSM) confirm that this is reflected in their own usage data and so
they have started reporting on customer specific gender metrics which will enable us
to determine in the future whether this is the case within the Council.
The current data shows that 16 women and 11 men contacted WSM for their
services or a split of 59%/41%. As our workforce is split 64%/36% female/male, this
does not indicate a reluctance to use the service by men, however the data may not
be entirely reflective of experience as the service may be contacted for issues other
than mental health support (the service provides family, legal and financial advice)
and of course the data set is very small. We will need to continually promote the
service and in particular focus on mental health and emotional wellbeing, particularly
if remote working becomes the norm.
Impact of Home Working (Where Work Happens)
In May 2020, the Business Transformation Team surveyed staff to review the
experience of home working. This indicated that 81% of workers could do their job to
a satisfactory standard at home and that 74% of people believed that they were as
productive or more productive than working in the office. 73% wanted to work at home
in the future half, most or all the time. However, it was clear that experience was mixed
and probably better suited people who were longer in service and at higher grades,
who had separate working space and were not so reliant on the space or opportunities
for informal learning and social benefits that an office environment brings.
That survey is now being repeated with the addition of listening panels with a view to
making longer term changes to the working environment and office footprint.
Return to Office Working
The People and Staff project delivered several products to support staff including:
1) Return to Office Working Policy and Plan
2) Home Working Guidance
3) Site Visit Guidance
4) Digital Meeting Guidance
11 | P a g eWaverley Borough Council Workforce Profile: April 2021
These products provided a successful framework for staff to use to manage their
working environment successfully and safely. Feedback on them has been good and
the framework has held up during a number of changes in the pandemic experience.
Turnover
During 2020, turnover has been as follows:
Reporting Total Staff Resignation Public Sector
Period Turnover Turnover Average
Apr 19 - Mar 20 18.72 10.47 15.5
Jul 19 - Jun 20 17.38 8 15.5
Oct 19 - Sept 20 15.53 7.00 15.5
Jan 20 - Dec 20 14.34 6.94 15.5
As can be seen, turnover due to resignation (unplanned turnover) is lower than would
usually be expected and has fallen over 2020. This is due to the reduced opportunities
in the external economy due to the pandemic.
Overall turnover has been slightly higher than the public sector average. This is partly
because there have been several change programmes that have exited people from
the organisation as well as fixed term contracts ending. This has meant that planned
turnover has been higher than the public sector average however this has been
needed to make savings and streamline services.
Exit interview data suggests that 30% of the resignations in the year 2020 were due to pay,
career opportunities or career changes and 7% due to family or personal reasons. Please see
the ‘Work in Progress’ section for information about work that has been started to mitigate
against these reasons.
12 | P a g eWaverley Borough Council Workforce Profile: April 2021
Below graphs show the breakup of turnover in 2020 by reason, service area, grade and length
of service.
Resons For Leaving
Resignation 43%
Retirement 17%
Redundancy 13%
End of fixed term contract 13%
Transfer 5%
Other reason 3%
Retirement - Ill Health 2%
Resignation - Ill Health 2%
Lack of capability 2%
Turnover by Service
Housing Operations 22%
Commercial Services 18%
Business Transformation 17%
Policy and Governance Services 13%
Environmental and Regulatory Services 12%
Planning and Economic Development 10%
PA 5%
Housing Delivery and Communities 2%
Finance and Property 2%
The following charts show the turnover by grade and by length of service in years.
13 | P a g eWaverley Borough Council Workforce Profile: April 2021
Turnover by Grade
18.3%
16.7%
15.0% 15.0%
8.3%
6.7%
5.0%
3.3% 3.3% 3.3%
1.7% 1.7% 1.7%
Turnover by Length of Service (in yrs)
23%
20%
12%
7%
5% 5%
3% 3% 3%
2% 2% 2% 2% 2% 2% 2% 2% 2% 2% 2%
0 1 2 3 4 5 6 7 8 9 10 11 12 13 14 15 16 17 18 19 20 21
The turnover data indicates that higher grades are very stable but that mid-grades (7-
10) experience a higher turnover. This is to be expected as people seek different
employment experiences to advance their career. Turnover at these levels may be
regarded as beneficial as it brings new experience and fresh ideas into the
organisation.
Impact of Business Change
The work done in terms of Business Transformation projects, the streamlining of
services and improvements in delivery will be key factors in controlling costs whilst
improving services. The control of the workforce establishment will be an important
factor in future management as will the ability to be change ready and adaptable.
This will increase in importance over the next year as the Council seeks external as
well as internal opportunities to continuously improve.
14 | P a g eWaverley Borough Council Workforce Profile: April 2021
Outcomes of the workforce profile review and key areas of focus for HR
2021:
This workforce profile has demonstrated the impact of the pandemic on Waverley
Borough Council and has highlighted the following key areas of focus:
1) The future of the working environment and in particular the use of agile working
2) The need for a continued focus on wellbeing and in particular mental health
3) The continued work on equalities, ensuring that the culture of Waverley
Borough Council builds on existing focus on education, communications and
supporting those who are from under-represented groups.
4) The need to maintain control of the workforce establishment, be change ready
and adaptable.
5) The impact of age and gender on the workforce indicates a specific need to
improve talent management at senior/mid manager level.
As part of the performance management process, objectives reflecting these key
areas are being set within the HR Team for 2021.
Conclusion
This report has been prepared to inform Council members and officers. Questions,
observations and feedback are welcomed.
15 | P a g eYou can also read