Your added value. Our values, 2021 Second Quaterly Report - BTB Real Estate Investment Trust
←
→
Page content transcription
If your browser does not render page correctly, please read the page content below

2021
Second Quaterly Report

Our values,
your added value.

BTB’s
Values
         Mission
         BTB’s two main clients are our
         investors and our tenants, who
         both have specific demands and
         requirements. On an investors side,
         our clients are looking to maximize
         their returns and by doing so, they
         intrust BTB to proactively ensure
         that through our management
         philosophy, that we are generating
         stable growth, that we expand
         our real estate assets and in turn,
         optimize the value of our assets
         and therefore, maximize the
         long-term value of our units.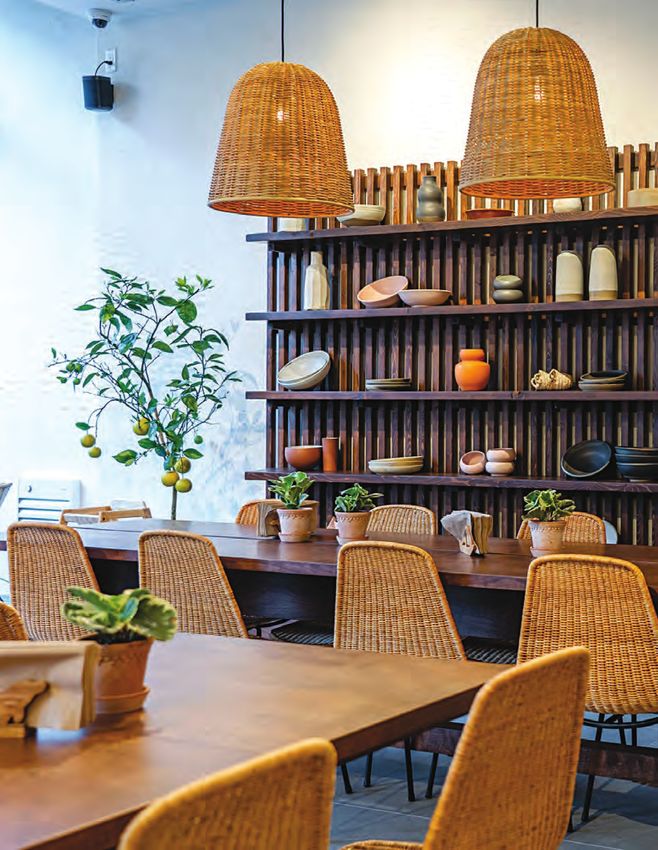
BTB 2021 Page
Reit Second Quaterly Report 3
BTB is dedicated to delivering effective, efficient results and service
to our investors and clients. We are driven by respect, transparency,
collaboration, and integrity. We pride ourselves on promising a personalized
approach to respond to every client need to help them reach their
goals. Our success as a REIT is measured by the value we create for
our investors, clients, and employees. At BTB, we believe actions speak
louder than words; it is at the core and heart of our decision making.
To ensure the achievement of our two-fold client mission, BTB relies
on the implementation of the following core values:
Teamwork Integrity Leadership Respect
People sharing Our ethical As we aim We strive
ideas and principles to be at the to always
fostering an of honesty forefront of ensure a work
environment are ingrained our industry, environment
of collectivity within our we invest in that is positive
allows for values. Without goal-oriented regardless of
quicker problem integrity and employees age, race, sex,
solving, better transparency, who are gender, religion,
results and we would motivated or sexual
fostering an not be able and can take orientation.
environment to ensure charge in We believe
for innovative an honest innovative that we are
ideas. relationship projects all capable of
with our clients. to meet achieving our
our client’s missions if we
requirements. are all accepting
of one another
by showing
compassion and
consideration
for others.
Yaourti
1407 Crescent
Street,
Montréal
Page
4

Highlights   It goes without saying that the past
             year demanded responsiveness,
             agility, and adaptation. As these
             three key elements were already part
             of BTB’s DNA it allowed us, in addition
             to our strong corporate values, to adapt
             to our new normal within a quick time
             frame.

             Throughout the past nineteen months,
             our fellow collaborators demonstrated
             their comprehensiveness, conciliation,
             and accepted sacrifices. Our teamwork
             and collaboration with our suppliers
             greatly contributed to the past years’
             success. As the saying goes: “It’s when
             the tough times come that you know
             who your true friends and allies really
             are”. The past months enabled us to
             validate this saying on a company-wide
             scale. It also showed and reminded us
             of the importance to surround
             ourselves well and to wisely choose
             our collaborators.

             Our results, for the second quarter
             of 2021 are well grounded and we
             are pleased to report the following
             highlights.

                                                              Genius Solutions
                                                        1170 Lebourgneuf Blvd,
                                                                  Quebec City
BTB                       2021                         Page
                            Reit                      Second Quaterly Report       5

65
Properties
                                                     92.2                      %

$26.0                   M                                    Occupancy rate

Rental income

                                                               53.7%

$965
Total assets
                                   M                      Mortgage debt ratio

9.2             M             8.6            M                            5.4             M
Recurring funds                Recurring adjusted funds                    Number of
from operations (FFO)          from operations (AFFO)                      square feet
Geographic Locations

Our assets are located within the primary markets of the Greater Montréal Area, the Greater
Quebec City Area as well as the Greater Ottawa Area.

BTB focuses on primary markets due to the centrality and strategic locations of the assets within
established neighbourhoods and business hubs. By concentrating our geographic spread within
these regions, BTB is able to offer to its client’s various locations within 3 key areas in Eastern
Canada, therefore offering various solutions to our clients.

 Greater                     Greater                   Ottawa
 Montreal area               Quebec city               area

 54.1%                       25.5%                     20.3%

Montréal                             Ontario                           Quebec city

BTB is focused in the greater        BTB pierced the Ontarian          As a complementary strategic
area of the island of Montréal,      market in 2007 with its first     location to the Island of Montréal,
mainly concentrating our             acquisition in the industrial     Quebec City is Québec’s second
assets on the island. BTB’s          hub of Cornwall, Ontario.         most thriving cities. With many
first acquisition in 2006 was        BTB later expanded into           Quebec based and international
a retail property in Laval, still    Ottawa with the acquisition       tenants having dual businesses
owned by BTB today. BTB has          of office properties, therefore   in both Montréal and Quebec
properties in the following          solidifying an important          City, BTB’s expansion to the
primary areas:                       presence in this office           area was imminent. Having
                                     market with national              pierced the market in 2007,
• Downtown Montréal                  tenants. BTB’s Ontario            BTB has established a sound
• Saint-Laurent                      locations are the following:      portfolio in Quebec City primarily
• Laval                                                                composed of Retail and Office
                                     • Cornwall                        properties. BTB’s properties are
• South Shore (Longueuil,                                              in the following neighbourhoods:
                                     • Ottawa
  Brossard, Saint-Bruno,
  Saint-Hilaire, Boucherville,       • Nepean                          • Lebourgneuf
  St-Jean-sur-Richelieu)             • Kanata                          • Lévis
• North Shore (Terrebonne            • Gatineau                        • St-Augustin de Desmaures
  & Ste-Thérèse)
                                                                       • Trois-Rivières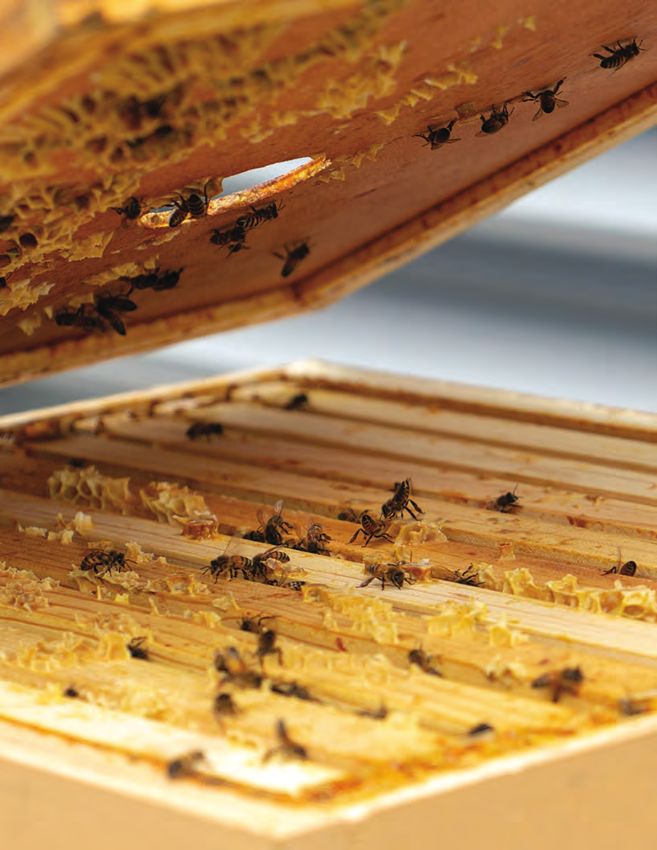
Breakdown by asset type

When searching for new assets, BTB favours those with long-term stability which follow
the following criteria:

• Assets which house tenants with long-term leases.
• Assets with high occupancy rates.
• Assets which contain a tenant mix which is well established such as government institutions
  and national or international enterprises.

Our assets are broken down into three primary categories:

 Office                              Retail                           Industrial

 A single or multiple                A single-story property          A single storey property
 storey property which               which houses only                which contains a large
 primarily houses office             retail tenants. Specific,        floorplate with an
 tenants. These types                to BTB’s portfolio,              incredible ceiling height,
 of assets are usually               these include our                higher than 18 feet.
 leased to multiple                  Power Centers which              These properties allow
 tenants operating                   are occupied by big-box          for maximum vertical
 various businesses                  tenants.                         usage as the raw spaces
 which do not serve                                                   are primarily used for
 a retail client base.*                                               stacking and warehousing
                                                                      solutions.

 * The mixed-use category found
  in previous annual reports has
  been removed from our asset type
  breakdown. Properties previously
  found in this segment have been
  reclassified under the “office”
  category.

  47.7%                               26.1%                            26.2%
Page
8
Evolution*
Rental Net operating
Income(1) income
2021 26,034 2021 15,574
2020 23,063 2020 12,196
201 9 22,347 20 1 9 11,225
201 8 20,803 20 1 8 11,458
201 7 18,392 20 1 7 10,042
Recurring funds from Recurring adjusted funds
operations (FFO)(2) from operations (AFFO)(2)
2021 9,202 2021 8,647
2020 4,710 2020 4,237
201 9 5,446 20 1 9 4,884
201 8 5,279 201 8 4,936
20 1 7 4,884 20 1 7 4,463
* For the quarters ending June 30th (1) Not adjusted to take into account IFRS 15 (2) Non-IFRS financial measures
Performance on the markets
170
BTB’s Total Return
160
S&P/TSX Index Total Return
150
S&P/TSX Capped REIT Index Total Return
140
130
Relative Value
120
110
100
90
80
70
60
June 30th, 2020
July 31st, 2020
Aug. 31st, 2020
Sept. 30th, 2020
Oct. 31st, 2020
Nov. 30th, 2020
Dec. 31st, 2020
Jan. 31st, 2021
Feb. 28th, 2021
March 31st, 2021
April 30th, 2021
May 31st, 2021
June 30th, 2021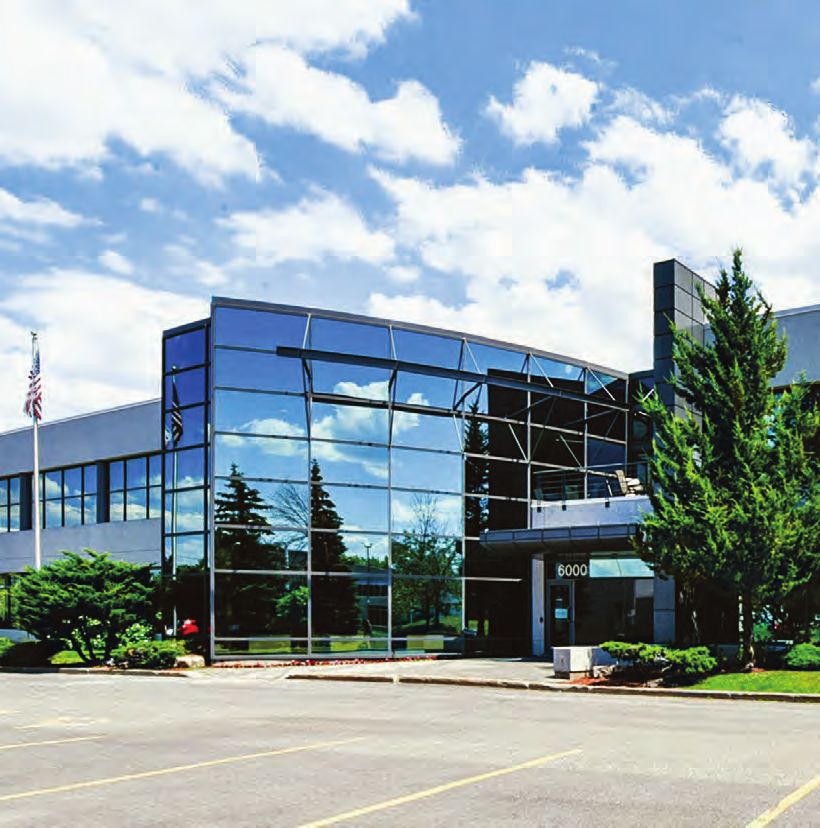
BTB    2021                     Page
Reit   Second Quaterly Report   9
10
          Page

Message
BTB 2021 Page
Reit Second Quaterly Report 11
Message from
the Chair of the Board
of Trustees and the
President and Chief
Executive Officer
The second quarter of 2021 marks the Geared towards growth
halfway point of the year, and we are
proud to report positive results for a On April 28th, 2021, we closed a bought
deal public offering of 7,809,650 trust
second consecutive quarter, all whilst
units for the aggregate gross proceeds
focused on our growth plan. Over the
of $31.6 million. Subsequently, on
past months, we have been focused
June 15th, 2021, we filed and obtained
on solidifying our business foundation
a receipt for a final short form base
and we are hopeful that we have
shelf prospectus providing BTB with
reached the end of the COVID-19
the financial flexibility and efficient
tunnel and have emerged into a
access to Canadian Capital Markets to
brighter future.
pursue strategic initiatives, including
We are continuing adapt to our new acquisitions.
reality and our strong management
On June 29th, 2021, BTB acquired
team has BTB’s success in mind.
industrial property located at
To achieve our goals, it is essential
6000 Kieran Street, in Saint-Laurent
that we align our actions with our
in Montréal, for a total consideration
stakeholders’ needs. It is important
of $15.25 million, excluding transaction
to build upon our growth plan which
costs. With a total leasable area
affirms our commitment to serve our
of 99,000 sq.ft., the property is
three valued groups: investors, clients,
entirely leased to Kore Outdoor Inc,
and employees. We are confident that
a global leader in the manufacturing
we are on the right path and that we
of high-quality paintball products.
can meet your expectations for the
coming years and resume our activities This acquisition increased BTB’s
finding attractive opportunities. property count to 65 at the end
of Q2 2021.
We are continuing to show our
support to our tenants in need An overview of our second
of guidance through their different quarter results
lease negotiations, renewals, and
government subsidies that are BTB's financial results continued
available to them. We pursue our to show improvement and stability
client-centric focus as we have learnt through its diversified portfolio.
over the past nineteen months that Our industrial segment and our
this relationship and transparency Ottawa portfolio continue to show
between both parties is paramount their resilience with respectively
to a positive, trust-based relationship, 96.5% and 94.2% occupancy rates.
which has become a central aspect
of our daily operations.Our office and retail segments have On the search for new opportunities
also shown improvement in their
Finally, through this global crisis,
occupancy rates compared to the
we have been noticing in the markets,
previous quarter with a 1.2% increase
and the industry in general, a collective
in occupancy.
effort to ensure a healthy economic
Our lease renewal activities were status for all Canadians. By working
robust through the quarter showing together and building strong
an 86.2% renewal rate, a 10.2% increase partnerships, we are positive BTB
compared to the prior quarter. Leases has a bright future.
representing a total of 97,193 sq. ft.
The past quarter’s activities have
have been renewed, of which 82,826
demonstrated our determination
were renewed for leases maturing
towards BTB’s strategic growth,
in 2021 and 14,367 maturing in 2022
allowing us to purchase accretive
in subsequent years.
assets, thus offering more attractive
Our leasing activity saw some traction locations for our international and
through the quarter as 78,294 sq. ft. national client base. For the next
were leased to new tenants. Some two quarters, our eyes are peeled
notable transactions of the quarter towards investment opportunities,
include: which will help us reach the important
mark of $1B of asset valuation. With the
• Princess Auto LTD for 38,520 sq.ft.
cash in hand the availability of our line
in Montréal
of credit, BTB can acquire without going
• Intelcom Courrier Canada Inc. to the market.
for 9,340 sq.ft. in Cornwall
We also thank our investors for their
• Orthogone Technologies Inc.
continued confidence in BTB.
for 7,715 sq.ft. in Montréal
Our recurring FFO payout ratio stood
at 59.9% for the quarter, compared to
113.9% for the second quarter of 2020,
while our AFFO payout ratio is 63.7%,
compared to 126.6% for the comparable
quarter of 2020, recording yet another
significant improvement in these Jocelyn Proteau
ratios, for a fourth consecutive
Chair of the Board of Trustees
quarter.
Continuing this trend, our total debt
ratio again declined. At the end of Q2
2020, this ratio stood at 56.0%,
recording a 2.9% improvement since Michel Léonard
last quarter and a 2.6% improvement President and Chief Executive Officer
for the comparable quarter last year.
This improvement is attributable
to the last equity issuance, the
conversion of holders of our Series H
Debenture during the past quarters
and the full repayment of the
outstanding amount owed on
the acquisition line of credit.BTB 2021 Page
Reit Second Quaterly Report 13
Board of
Trustees
Top row Middle row Bottom row
Fernand Perreault Lucie Ducharme Jocelyn Proteau Michel Léonard Daniel Fournier
Chair of the Investment Chair of the Chair of the Board of President and Chief Trustee
Committee and Human Ressources Trustees and trustee Executive Officer
trustee and Governance and Trustee Sylvie Lachance
Committee and Jean-Pierre Janson Trustee
trustee Vice Chair of the
board of Trustees Luc Martin
and trustee Chair of the Audit
Committee and
trustee
Executive
Team
Mathieu Bolté Michel Léonard
Vice President and President and
Chief Financial Officer Chief Executive Officer14
Page
InterviewBTB 2021 Page
Reit Second Quaterly Report 15
An interview with
our new Trustee,
Daniel Fournier
What is your proudest achievement? the notion of being “a man for others”.
Then in a US prep school, the Latin
The first thing that comes to mind
NON SIBI meaning it’s not about
for my wife Caroline and I is our
family. We are most proud of our oneself. Lastly, in college, “in the
four children and the adults that nations service and in the service of
they have become. all nations” stressing the importance
of public service in the largest sense.
From a business perspective,
I am most proud of the accumulation If I had to choose a favourite poem,
of knowledge gained from the very it would be “The Road Not Taken” by
different experiences that I have had Robert Frost which is a metaphor in
from an entrepreneurial Montréal which the road less traveled symbolizes
oriented beginning, a period involving the path of nonconformity, which is
more governance-oriented activities usually the hardest, most challenging
(Canadian Tire, Genivar-WSP) and road to take, but often comes with
finally an institutional and international the best result and avoids any sense
focus with Ivanhoe Cambridge. of regret of a missed opportunity.
What inspires you; Where do you see BTB in 1 year,
what are you passionate about? 5 years & 10 years?
I have always been interested in I have tremendous respect for
history. Nowadays, we underestimate Michel and Mathieu, their discipline
its importance in our daily lives. It is and passion for BTB is undeniable.
has always made sense to me that as They have surrounded themselves
an individual, a corporation, a people, with a talented, hardworking team.
or a country that unless you know
where you have been in the past it In the short term, BTB is growing
will be difficult to understand where in a very disciplined manner with
you should be heading in the future. constant improvement in the quality
of the portfolio, and I believe it will
I am passionate about Montréal, move forward in a very similar way.
Québec, and Canada.
There is a constant desire to be
I am also very passionate about the prepared for the opportunities that
privilege and responsibility of giving will arise.
back to the community.
On my end, I am proud to have joined
If you were a quote which one, the Trustees and assist in the best
would it be? way I can to help achieve the long-
I don’t have a specific quote, term five- and ten-year objectives.
but I have been heavily influenced It is inspiring to see that people like
by the three mottos of the schools Jocelyn Proteau and Fernand Perrault
that I was fortunate to have been and the other trustees all with different
given the opportunity to attend. talents and impressive experience
First at a Jesuit high school, have been so dedicated to BTB.16
Page
Our
PropertiesBTB 2021 Page
Reit Second Quaterly Report 17
Montréal South Shore of Montréal Quebec City Area
• 1327-1333 Ste-Catherine Street • 4890-4898 Taschereau Blvd, • 6655 Pierre-Bertrand Blvd,
West and 1405-1411 Crescent Brossard Quebec City
Street, Montréal • 2340 Lapinière Blvd, Brossard • 6700 Pierre-Bertrand Blvd,
• 5810 Sherbrooke Street East, • 204 De Montarville Blvd, Quebec City
Montréal Boucherville • 909-915 Pierre-Bertrand Blvd,
• 5878-5882 Sherbrooke Street Quebec City
• 32 Saint-Charles Street West,
East, Montréal Longueuil • 825 Lebourgneuf Blvd,
• 7001-7035 St-Laurent Blvd Quebec City
• 50 Saint-Charles Street West,
and 25 Mozart Avenue, Montréal Longueuil • 815 Lebourgneuf Blvd,
• 2101 Sainte-Catherine Street Quebec City
• 85 Saint-Charles Street West,
West, Montréal Longueuil • 1170 Lebourgneuf Blvd,
• 3761-3781 des Sources Blvd, Quebec City
• 2111 Fernand-Lafontaine Blvd,
Dollard-des-Ormeaux Longueuil • 625-675 De la Concorde Street,
• 11590-11800 de Salaberry Blvd, Lévis
• 2350 Chemin du Lac, Longueuil
Dollard-des-Ormeaux • 1200-1252 De la Concorde
• 1939-1979 F.-X. Sabourin Street, Street, Lévis
• 1325 Hymus Blvd, Dorval St-Hubert
• 191 D’Amsterdam Street,
• 4105 Sartelon Street, St-Laurent • 145 Saint-Joseph Blvd, St-Augustin-de-Desmaures
• 208-244 Migneron Street St-Jean-sur-Richelieu
• 175 De Rotterdam Street,
and 3400-3410 Griffith Street, • 315-325 MacDonald Street, St-Augustin-de-Desmaures
St-Laurent St-Jean-sur-Richelieu
• 505 Des Forges Street
• 7777 Transcanada Highway, • 1000 Du Séminaire Blvd North, and 1500 Royale Street,
St-Laurent St-Jean-sur-Richelieu Trois-Rivières
• 2250 Alfred-Nobel Blvd, • 340-360, 370-380, 375 and • 2059 René-Patenaude Street,
St-Laurent 377-383 Sir-Wilfrid-Laurier Blvd, Magog
• 7150 Alexander-Fleming Street, Mont-Saint-Hilaire
St-Laurent • 1465-1495 and 1011-1191 Saint- Ottawa Area, Ontario
• 2425 Pitfield Blvd, St-Laurent Bruno Blvd and 800 de l’Étang • 80 Aberdeen Street, Ottawa
• 2665-2673 and 2681, Côte Street, Saint-Bruno-de-
• 245 Menten Place, Ottawa
Saint-Charles, Saint-Lazare Montarville
• 1-9 and 10 Brewer Hunt Way
• 6000 Kieran Street, Saint-Laurent and 1260-1280 Teron Rd, Ottawa
• 400 Hunt Club Rd, Ottawa
North Shore of Montréal
• 2200 Walkley Street, Ottawa
• 2900 Jacques-Bureau Street, • 2204 Walkley Street, Ottawa
Laval
• 2611 Queensview Drive, Ottawa
• 4535 Louis B. Mayer Street, Laval
• 7 and 9 Montclair Blvd, Gatineau
• 3695 Des Laurentides
• 705 Boundary Road, Cornwall
(Highway-15), Laval
• 725 Boundary Road, Cornwall
• 3111 Saint-Martin Blvd West, Laval
• 805 Boundary Road, Cornwall *
• 3131 Saint-Martin Blvd West, Laval
• 2901 Marleau Avenue, Cornwall
• 81-83 Turgeon Street,
Ste-Thérèse
• 5791 Laurier Blvd, Terrebonne
• 2175 Des Entreprises Blvd,
Terrebonne
• 2205-2225 Des Entreprises Blvd,
Terrebonne * Considered as two properties
• 2005 Le Chatelier Street, LavalPage
18
Recent
Acquisition
6000 Kieran Street, Saint-Laurent, Montréal
Acquisition date: June 29th, 2021
Acquisition price: 15.25 million
Gross leasable area: 99,000 square feet
Property type: IndustrialBTB 2021 Page
Reit Second Quaterly Report 19
Located in the borough of Saint-Laurent in Montréal, 6000 Kieran Street
is an industrial property of 99,000 square feet.
The property is entirely leased to Kore Outdoor Inc., a global leader in the
manufacturing of high-quality paintball products, ranging from paintballs
and gear, marketed to all levels of play, from entry-level to competitive
market segments.Page 20 This beehive on the rooftop of our head office located at 1411, Crescent Street in Montréal, is one of the 13 hives on the rooftops of some of our properties.
BTB                      2021                         Page
                                      Reit                     Second Quaterly Report       21

Management
Discussion
and Analysis
Quarter ended June 30, 2021

                        TABLE OF CONTENTS
                        22    Introduction                      36    Funds from Operations (FFO)

                        22    Forward-Looking Statements –      37    Adjusted Funds
                              Caveat                                  from Operations (AFFO)

                        23    COVID-19                          38    Cash Flows

                        23    Non-IFRS Financial Measures       39    Segmented Information

                        23    The Trust                         40    Assets

                        24    Objectives and Business           41    Capital Resources
                              Strategies

                                                                46    Sustainable Development
                        24    Highlights of the Second
                              Quarter Ended June 30, 2021
                                                                47    Income Taxes

                        26    Selected Financial Information
                                                                48    Taxation of Unitholders

                        27    Selected Quarterly Information
                                                                48    Accounting Policies
                                                                      and Estimates
                        27    Real Estate Portfolio

                                                                49    Risks and Uncertainties
                        28    Real Estate Operations

                                                                50    Disclosure Controls and
                        31    Operating Results                       Procedures and Internal Control
                                                                      Over Financial Reporting

                        35    Operating Results –
                              Same-Property Portfolio           50    Appendix 1 – Performance
                                                                      Indicators

                        36    Distributions
                                                                51    Appendix 2 – Definitions
Page 22 Introduction The purpose of this Management Discussion and Analysis (“MD&A”) is to allow the reader to evaluate the operating results of BTB Real Estate Investment Trust (“BTB” or the “Trust”) for the quarter ended June 30, 2021 as well as its financial position on that date. The report also presents a summary of the Trust’s business strategies and the business risks it faces. This MD&A dated August 6, 2021 should be read together with the unaudited condensed consolidated financial statements and accompanying notes for the quarter ended June 30, 2021. It discusses significant information available up to the date of this MD&A. The Trust’s consolidated annual financial statements were prepared in accordance with International Financial Reporting Standards (“IFRS”), as issued by the International Accounting Standards Board (“IASB”). Unless otherwise indicated, all amounts are in thousands of Canadian dollars, except for per unit and per square foot amounts. Additional information about the Trust, including the 2020 Annual Information Form, is available on the Canadian Security Administrators (“CSA”) website at www.sedar.com and on our website at www.btbreit.com. The Audit Committee reviewed the contents of this Management Discussion and Analysis and the quarterly financial statements and the Trust’s Board of Trustees has approved them. Forward-Looking Statements – Caveat From time to time, written or oral forward-looking statements are made within the meaning of applicable Canadian securities legislation. Forward-looking statements in this MD&A are made, in other filings with Canadian regulators, in reports to unitholders and in other communications. These forward-looking statements may include statements regarding BTB’s future objectives, strategies to achieve the Trust’s objectives, as well as statements with respect to BTB’s beliefs, outlooks, plans, objectives, expectations, forecasts, estimates and intentions. The words “may,” “could,” “should,” “outlook,” “believe,” “plan,” “forecast,” “estimate,” “expect,” “propose,” and the use of the conditional and similar words and expressions are intended to identify forward-looking statements. By their very nature, forward-looking statements involve numerous factors and assumptions, and are subject to inherent risks and uncertainties, both general and specific, which give rise to the possibility that predictions, forecasts, projections, and other forward-looking statements will not be achieved. Readers must we warned not to place undue reliance on these statements as several important factors could cause the Trust’s actual results to differ materially from the expectations expressed in such forward looking statements. These factors include general economic conditions in Canada and elsewhere, the effects of competition in the markets where we operate, the impact of changes in laws and regulations, including tax laws, successful execution of the Trust’s strategy, the ability to complete and integrate strategic acquisitions successfully, potential dilution, the ability to attract and retain key employees and executives, the financial position of lessees, the ability to refinance our debts upon maturity, the ability to renew leases coming to maturity, and to lease vacant space, the ability to complete developments on plan and on schedule and to raise capital to finance the Trust’s growth, as well as changes in interest rates. The foregoing list of important factors likely to affect future results is not exhaustive. When relying on forward-looking statements to make decisions with respect to BTB, investors and others should carefully consider these factors and other facts and uncertainties. Additional information about these factors can be found in the “Risks and Uncertainties” section. BTB cannot assure investors that actual results will be consistent with any forward-looking statements and BTB assumes no obligation to update or revise such forward-looking statements to reflect new events or circumstances, except as required under applicable securities regulations.
BTB                                    2021                                    Page
                                                          Reit                                   Second Quaterly Report                  23

COVID-19
BTB continues to monitor its business operations and is aware of the impacts that the COVID-19 pandemic
has on the global economy as its duration remains uncertain. BTB may take further action in response to the
directives of government and public health authorities or actions that are in the best interests of employees,
tenants, suppliers, or other stakeholders, as necessary.

BTB will continue to work with its tenants that are participating in the Canada Emergency Rent Subsidy (“CERS”)
program that was enacted to cover the period ranging from October 2020 to September 25, 2021. It is important
to note that tenants are responsible to apply for subsidies and that the Trust is not obliged to make financial
concessions as it was under the CECRA program. The full extent and the financial impact of COVID-19 on
communities and the economy remain uncertain.

Non-IFRS Financial Measures
“Net operating income” (“NOI”), “net operating income of the same-property portfolio” (“SPNOI”), “funds from
operations” (“FFO”), “adjusted funds from operations” (“AFFO”), “adjusted net income and comprehensive
income” and “net property income” and per unit information, if applicable, are non-IFRS performance measures
and do not have standardized meanings prescribed by IFRS. These measures are used by BTB to improve the
investing public’s understanding of operating results and the Trust’s performance. IFRS are International Financial
Reporting Standards defined and issued by the IASB, in effect as at the date of this MD&A.

These measures cannot be compared to similar measures used by other issuers. However, BTB presents its FFO
in accordance with the Real Property Association of Canada (REALPAC) White Paper on Funds from Operations,
as revised in February 2019.

Securities regulations require that these measures be clearly defined, that they be readily comparable to the
most similar IFRS measures, and that they not be assigned greater weight than IFRS measures.

The Trust
BTB is an unincorporated open-ended real estate trust formed under and governed by the laws of the Province
of Québec pursuant to a trust agreement (as further amended). BTB began its real estate operations on
October 3, 2006, and as of June 30, 2021, it owns 65 retail, office and industrial properties located in primary
markets of the Provinces of Québec and Ontario. Since its inception, BTB has become an important property
owner in the province of Québec and in Eastern Ontario. The units and Series G and H convertible debentures
are traded on the Toronto Stock Exchange under the symbols “BTB.UN”, “BTB.DB. G” and “BTB.DB.H”, respectively.

BTB’s management is entirely internalized, and no service agreements or asset management agreements are
in force between BTB and its officers. The Trust therefore ensures that the interests of management and of its
employees are aligned with those of the unitholders. Only two properties are managed by third party managers
dealing at arm’s length with the Trust. Management’s objective is, when favourable circumstances will prevail,
to directly manage the Trust’s remaining properties to possibly achieve savings in management and operating
fees through centralized and improved property management operations.

The following table provides a summary of the real estate portfolio:

                                                                                                       Leasable area                     Fair value
                                                              Number of properties                           (sq. ft.)             (thousands of $)
 As at June 30, 2021(1)                                                              65                     5,402,224                         922,035

(1) These figures include a 50% interest in a 17,114 sq. ft. building in a Montréal suburb and a 50% interest in a building totaling 74,940 sq. ft.
in Gatineau, Québec.
Page
24
Objectives and Business Strategies
BTB’s primary objective is to maximize total return to unitholders. Returns include cash distributions
and long-term appreciation of the value of its units. More specifically, the objectives are as follows:
(i) Generate stable monthly cash distributions that are reliable and fiscally beneficial to unitholders.
(ii) Grow the Trust’s assets through internal growth and accretive acquisitions to increase distributable income
and therefore fund distributions.
(iii) Optimize the value of its assets through dynamic management of its properties to maximize the long-term
value of its properties.
Strategically, BTB seeks to acquire properties with high occupancy rates, good tenant quality, superior locations
or low potential lease turnover and properties that are well maintained and require fewer capital expenditures.
BTB’s management regularly performs strategic portfolio reviews to determine whether it is financially advisable
to dispose of certain investments. BTB may dispose of certain assets if their size, location and/or profitability
no longer meet the Trust’s investment criteria.
In such cases, BTB expects to use the proceeds from the sale of assets to reduce debt thereon and/or redeploy
capital in accretive acquisitions.
Highlights of the Second Quarter Ended June 30, 2021
• During the quarter, BTB showed improved financial results and stability through its retail, office and industrial
operating segments. The industrial segment performed extremely well during the last year. The fundamentals
of the suburban office segment and the food anchored retail properties remained strong. The Trust has collected
98.4% of its invoiced rents for the year 2021. As a reminder, the second quarter of last year was impacted
by the financial effect of Canada’s Emergency Commercial Rent Assistance “CECRA” program, by the rent
concessions the Trust granted to its tenants that impacted the 2020 net operating income by $0.5 million,
by taking a higher allowance for expected credit losses of $1.1 million, and by a reduction of the fair value of
properties of $10.5 million for the cumulative 6-month period. Further to the 2020 one-time charges related
to COVID-19, revenues have improved. The Trust’s results for the second quarter were not similarly affected
hence the improvement in the financial performance.
• BTB’s leasing activity remained active with 97,193 sq. ft. of leases renewed of which, 82,826 sq. ft. were renewed
before the end of their term and 14,367 sq. ft. were renewed in anticipation of the end of their term in the years
2022 and later. BTB was able to lease 78,000 sq. ft. to new tenants including Princess Auto (38,520 sq. ft.) to
replace approximately 85% of the leasable area previously leased by Sportium. The leasing activity resulted
in a 1.2% increase in the occupancy rate to 92.2%, compared to last quarter.
• NOI margin was 59.8% (56.5% for the cumulative 6-month period) compared to 53.8% for the same period last
year (53.7% for the cumulative 6-month period). The Trust recorded additional recoveries of $1.4 million related
to prior years and not taking this amount into account, the NOI margin would be 57.5%, still representing
a 3.7% increase compared to the same period last year. SPNOI margin was 59.7% for the quarter (56.1% for
the cumulative 6-month period) compared to 54.2% for the same period last year (54.0% for the cumulative
6-month period). Excluding the non-recurring items, SPNOI increased by 3.3% compared to the same quarter
last year.
• Recurring FFO was 12.5¢ per unit (21.7¢ per unit for the cumulative 6-month period) compared to 7.5¢ per unit
for the same period last year (17.5¢ per unit for the cumulative 6-month period) and recurring AFFO was 11.8¢
per unit (20.5¢ per unit for the cumulative 6-month period) compared to 6.7¢ per unit for the same period last
year (15.5¢ per unit for the cumulative 6-month period). Recurring FFO payout ratio was 59.9% (69.2% for
the cumulative 6 month period) compared to 113.9% for the same period last year (108.8% for the cumulative
6 month period) and recurring AFFO payout ratio was 63.7% (73.0% for the cumulative 6-month period)
compared to 126.6% for the same period last year (122.5% for the cumulative 6-month period). The negative
impact of the COVID-19 pandemic on the second quarter of last year’s results were $1.6 million on recurring
FFO and recurring AFFO ($1.6 million for the cumulative 6-month period), and 2.5¢ per unit (2.5¢ per unit for
the cumulative 6-month period).BTB 2021 Page
Reit Second Quaterly Report 25
• On April 28, 2021, BTB announced that it closed a bought deal public offering and the concurrent closing of the
exercise of the over-allotment option granted to the underwriters. Including the exercise of the over-allotment
option, BTB sold an aggregate of 7,809,650 units at a price of $4.05 per unit for aggregate gross proceeds of
$31.6 million.
• On June 29, 2021, BTB announced the acquisition of an industrial property located at 6000 Kieran Street in
Montréal, Québec. Acquired for the price of $15.25 million (excluding transaction costs) and with a total leasable
area of 99,000 sq. ft., the property is entirely leased to Kore Outdoor Inc., a global leader in the manufacturing
of high-quality paintball products. The property purchased at the end of June 2021 will start generating revenue
during the next quarter.
• BTB concluded the quarter on June 30, 2021 with a cash position of $25.3 million. The $19.0 million increase
in cash since last quarter is mainly due to the proceeds of the equity issuance of $31.6 million combined
with the repayment of the full outstanding amount of the line of credit of $15.0 million. The operating
and the acquisition lines of credit were 100% available at the end of the quarter and ready to be deployed
for the Trust’s growth strategy ($23.0 million).
• Debt metrics continued to demonstrate the Trust’s commitment to maintain its total debt ratio below 60%.
It concluded the quarter at 56.0%, recording an improvement of 2.6% compared to the same quarter last year.
The improvement is essentially attributable to the equity issue mentioned above, to the conversion by holders
of Series H debentures through the quarter, combined with the full repayment of the outstanding amount on
the acquisition line of credit.
• On June 15, 2021, BTB announced that it filed and obtained a receipt for a final short form base shelf prospectus
from the securities regulatory authorities in each of the provinces and territories of Canada. The base shelf
prospectus was filed to provide BTB with financial flexibility and efficient access to Canadian capital markets to
pursue strategic initiatives, which may include acquisitions. The final base shelf prospectus is valid for a period
of 25 months, during which BTB may offer: trust units, debt securities, subscription receipts, warrants or any
combination thereof, having an aggregate offering price of up to $200 million. Any issue of securities under
the base shelf prospectus will require the filing of a prospectus supplement that will include specific terms
of the securities being offered and the details regarding the plan of distribution.
Summary of significant items as at June 30, 2021
• Total number of properties: 65
• Total leasable area: approximately 5.4 million sq. ft.
• Total asset value: $965 million
• Market capitalization: $299 millionPage
26
Selected Financial Information
The following table presents highlights and selected financial information for the quarter ended June 30, 2021
compared to the quarter ended June 30, 2020:
Periods ended June 30 (in thousands of dollars, Quarter Cumulative (6 months)
except for ratios and per unit data) 2021 2020 2021 2020
Reference (page) $ $ $ $
Financial information
Rental revenue 31 26,034 23,063 49,566 46,931
Net operating income (1)
32 15,574 12,419 27,988 25,185
Net income and comprehensive income 34 7,161 (1,101) 9,671 (6,688)
Adjusted net income(1) 34 8,030 3,757 12,634 9,073
Net property income from the same-property
portfolio(1) 35 10,983 7,173 18,513 14,722
Distributions 36 5,508 5,375 10,336 11,983
Recurring funds from operations (FFO)(1) 36 9,202 4,710 14,932 10,987
Recurring adjusted funds from operations (AFFO)(1) 37 8,647 4,237 14,153 9,754
Cash flow from operating activities 38 8,162 10,534 21,311 21,208
Total assets 40 965,051 934,776
Investment properties 40 922,035 894,679
Mortgage loans 42 503,075 495,599
Convertible debentures 43 43,542 49,367
Mortgage debt ratio 43 53.7% 52.8%
Total debt ratio 44 56.0% 58.6%
Weighted average contractual interest rate 42 3.77% 3.75%
Market capitalization 298,703 192,864
Financial information per unit
Units outstanding (000) 45 73,391 62,822
Class B LP units outstanding (000) 45 347 397
Weighted average number of units outstanding (000) 45 73,088 62,681 68,532 62,390
Weighted average number of units and Class B LP
units outstanding (000) 45 73,435 63,115 68,895 62,887
Net income and comprehensive income 34 9.8¢ (1.7)¢ 14.1¢ (10.6)¢
Adjusted net income(1) 34 10.9¢ 6.0¢ 18.3¢ 14.4¢
Distributions 36 7.5¢ 8.5¢ 15.0¢ 19.0¢
Recurring FFO(1) 36 12.5¢ 7.5¢ 21.7¢ 17.5¢
Payout ratio on recurring FFO(1) 36 59.9% 113.9% 69.2% 108.8%
Recurring AFFO(1) 37 11.8¢ 6.7¢ 20.5¢ 15.5¢
Payout ratio on recurring AFFO(1) 37 63.7% 126.6% 73.0% 122.5%
Market price of units 4.07 3.07
Tax on distributions
Revenue 48 0.0% 0.0% 0.0% 0.0%
Tax deferral 48 100% 100% 100% 100%
Operational information
Number of properties 27 65 64
Leasable area (thousands of sq. ft.) 27 5,402 5,330
Occupancy rate 29 92.2% 92.9%
Increase in average lease renewal rate 29 0.2% (1.4)% 3.2% 2.3%
(1) Non-IFRS financial measures.BTB 2021 Page
Reit Second Quaterly Report 27
Selected Quarterly Information
The following table summarizes the Trust’s selected financial information for the last eight quarters:
(in thousands of dollars except 2021 2021 2020 2020 2020 2020 2019 2019
for per unit data) Q-2 Q-1 Q-4 Q-3 Q-2 Q-1 Q-4 Q-3
$ $ $ $ $ $ $ $
Rental revenue 26,034 23,532 22,455 23,583 23,063 23,868 25,558 23,973
Net operating income(1) 15,574 12,414 12,767 13,308 12,419 12,766 14,174 13,476
Net income and comprehensive
income 7,161 2,510 3,850 5,757 (1,101) (5,587) 41,552 5,632
Net income and comprehensive
income per unit 9.8¢ 3.9¢ 6.1¢ 9.1¢ (1.7)¢ (8.9)¢ 66.2¢ 9.0¢
Adjusted net income 8,030 4,604 5,066 5,963 3,757 5,116 6,445 5,813
Adjusted net income per unit 10.9¢ 7.2¢ 8.0¢ 9.4¢ 6.0¢ 8.1¢ 10.3¢ 9.3¢
Cash from operating activities 8,162 13,149 15,954 8,983 10,534 10,674 17,235 9,875
Recurring funds from operations
(FFO)(1) 9,202 5,730 6,322 6,920 4,710 6,277 7,421 6,747
Recurring FFO per unit (1)
12.5¢ 8.9¢ 9.9¢ 10.9¢ 7.5¢ 10.0¢ 11.8¢ 10.8¢
Recurring adjusted funds from
operations (AFFO)(1) 8,647 5,506 6,253 6,139 4,237 5,517 6,795 6,087
Recurring AFFO per unit (1)
11.8¢ 8.6¢ 9.8¢ 9.7¢ 6.7¢ 8.8¢ 10.8¢ 9.7¢
Distributions(2) 5,508 4,828 4,778 4,752 5,375 6,618 6,584 6,563
Distributions per unit 7.5¢ 7.5¢ 7.5¢ 7.5¢ 8.5¢ 10.5¢ 10.5¢ 10.5¢
(1) Non-IFRS financial measures. See appropriate sections for definition and reconciliation to the closest IFRS measure.
(2) Includes distributions on Class B LP units.
Performance Indicators
The performance indicators used to measure BTB’s financial performance are presented and explained
in Appendix 1.
Real Estate Portfolio
At the end of the second quarter of 2021, BTB owned 65 properties, totalling a fair value of $922 million.
The properties generated approximately $26.0 million in rental revenue and represented a total leasable area
of approximately 5.4 million sq. ft. A description of the properties owned by the Trust as at December 31, 2020
can be found in the Trust’s Annual Information Form available at www.sedar.com.
Summary of investment properties held as at June 30, 2021
Number of Leasable area Committed In Place
Operating segment properties (sq. ft.) occupancy rate (%) occupancy rate (%)
Office 34 2,575,684 89.5 88.8
Retail 12 1,411,257 92.9 89.7
Industrial 19 1,415,283 96.5 95.9
Total 65 5,402,224 92.2 90.9
Acquisition of investment properties
On June 29, 2021, the Trust acquired an industrial property located at 6000 Kieran Street in Montréal, Québec,
for a total consideration of $15.25 million, increasing BTB’s total leasable area by 99,000 sq. ft.Page
28
Real Estate Operations
Portfolio occupancy
The following table summarizes the changes in occupied area for the periods ended June 30, 2021 and 2020:
Periods ended June 30 Quarter Cumulative (6 months)
(in sq. ft.) 2021 2020 (3)
2021 2020(3)
Occupied area at the beginning of the period (1)
4,846,980 4,967,154 4,910,877 5,194,894
Purchased (sold) assets 99,000 (85,352) 99,000 (283,392)
Signed new leases 78,294 26,391 88,045 51,386
Tenant departures (20,596) (28,447) (94,277) (83,150)
Other(2) (20,452) — (20,419) 8
Occupied leasable area at the end of the period(1) 4,983,226 4,879,746
Vacant leasable area at the end of the period 418,998 374,604
Total leasable area at the end of the period 5,402,224 5,254,350
(1) The occupied area includes in place and committed agreements.
(2) Other adjustments on the occupied area represent mainly area remeasurements.
(3) The vacant leasable area and the total leasable area exclude a property of 75,340 sq. ft. that was in redevelopment in 2020.
Renewal activities
The following table summarizes details the renewal rate for the periods ended June 30, 2021 and 2020:
Periods ended June 30 Quarter Cumulative (6 months)
(in sq. ft.) 2021 2020 2021 2020
Leases expired at term 96,089 76,609 162,468 215,851
Renewed leases at term 82,826 48,318 123,520 144,836
Renewal rate 86.2% 63.1% 76.0% 67.1%
In addition to the renewed leases at term during the quarter, the Trust Quarterly lease renewals per
renewed 14,367 sq. ft. leased to existing tenants with lease terms ending operating segment (sq. ft.)
in 2022 and after (68,844 sq. ft. for the cumulative 6-month period).
This activity has no impact on the occupied leasable area or renewal 30,172
31%
rate but demonstrates the Trust’s strategy to proactively manage its
lease renewals to retain its solid tenant base.
Considering renewed leases at term and renewed leases with terms
ending in 2022 and after, the Trust renewed a total of 97,193 sq. ft.
53,539
during this quarter (192,364 sq. ft. for the cumulative 6-month period). 55%
Out of the total leasable area of renewed leases, 53,539 sq. ft. or 55% 13,481
were concluded with office tenants, confirming the tenants needs for 14%
physical office space. 30,172 sq. ft. or 31% of renewed leases were
concluded with industrial tenants and 13,482 sq. ft. or 14% were Office Retail Industrial
concluded with retail tenants.BTB 2021 Page
Reit Second Quaterly Report 29
Increase in average lease renewal rate
The following table shows the breakdown of the average increase of rental rates per operating segment:
Cumulative
Quarter (6-month period)
Renewals Increase Renewals Increase
Operating segment (sq. ft.) % (sq. ft.) %
Office 53,539 (1.7) 93,729 0.7
Retail 13,482 5.1 62,639 4.6
Industrial 30,172 6.1 35,996 14.6
Total 97,193 0.2 192,364 3.2
Since the beginning of the year, the Trust achieved a cumulative average increase in renewal rate of 14.6% in the
industrial operating segment, which is essentially attributable to buoyant market conditions for this segment.
The Trust has been able to capitalize on the opportunity to negotiate attractive rent increases for industrial tenants.
The quarterly decrease in the average renewal rate of 1.7% in the office operating segment is explained by a
tenant who expanded its occupied area and renewed for a seven-year term on a “as is, where is” basis further
ensuring revenue on a long-term basis.
Quarterly new leases per
Signed new leases operating segment (sq. ft.)
During the quarter, the Trust leased 78,294 sq. ft. to new tenants, 24,566
leaving 418,998 sq. ft. of leasable area available at the end of the 31%
quarter. Out of the 78,294 sq. ft., 67,298 sq. ft. are committed 13,224
17%
agreements and 10,996 sq. ft. are in occupancy. As the Trust’s
industrial leasable areas are already almost fully occupied at 96.5%,
40,504 sq. ft. or 52% of the new leases were concluded with retail
tenants and 24,566 sq. ft. or 31% were concluded with office tenants.
40,504
52%
Office Retail Industrial
Occupancy rates
The following tables detail the Trust’s committed occupancy rates by operational segment and geographic sector,
including committed lease agreements:
June 30, March 31, December 31, September 30, June 30,
2021 2021 2020 2020 2020
% % % % %
Operating segment
Office 89.5 89.3 89.9 89.5 91.1
Retail 92.9 90.0 93.3 95.3 95.6
Industrial 96.5 95.6 95.8 93.9 93.6
Total portfolio 92.2 91.0 92.2 92.1 92.9
June 30, March 31, December 31, September 30, June 30,
2021 2021 2020 2020 2020
% % % % %
Geographic sector
Montréal 93.1 91.3 93.3 93.9 94.1
Quebec City (1)
88.8 89.0 89.1 89.2 90.0
Ottawa 94.2 93.0 93.3 91.2 93.2
92.2 91.0 92.2 92.1 92.9
(1) Excluding the Trois-Rivières property, the occupancy rate of the Quebec City portfolio is 92.3%.Page
30
The occupancy rate at the end of the second quarter of 2021 stood at 92.2%, a 1.2% increase compared to the prior
quarter, or a 0.7% decrease compared to the same period for 2020.
The Trust improved its occupancy rates in each operating segment compared to the prior quarter. Compared to
the same period in 2020, both office and industrial’s occupancies improved. The decrease in the retail occupancy
compared to the same period of 2020 is mainly due to the departure of a retail tenant located in the Montréal
sector at the end of 2020 that was occupying 30,452 sq. ft. Please refer to the “Segmented information” section
for more detail on operating segment’s performance.
The 1.8% occupancy increase in the Montréal sector compared to prior quarter is mainly explained by a lease for
38,520 sq. ft. concluded with Princess Auto Ltd. Excluding the Trois-Rivières property, BTB’s Quebec City’s portfolio
has also seen a positive increase, reaching an occupancy rate of 92.3%, that includes two large retail properties
(Carrefour Saint-Romuald and Méga Centre Rive-Sud) showing occupancy rates of respectively 100% and 97.7%.
The Ottawa portfolio continues to demonstrate its stability as it consists of office and industrial properties.
Lease maturities
The following table summarizes the Trust’s lease maturity profile for the next five years:
2021 2022 2023 2024 2025
Office
Leasable area (sq. ft.) 167,718 302,510 301,742 259,220 242,228
Average lease rate/square foot ($) $11.98 $15.21 $15.32 $13.74 $14.23
% of office portfolio 6.5% 11.7% 11.7% 10.1% 9.4%
Retail
Leasable area (sq. ft.) 67,886 270,768 165,258 80,387 234,718
Average lease rate/square foot ($) $13.38 $11.08 $8.86 $15.59 $15.93
% of retail portfolio 4.8% 19.2% 11.7% 5.7% 16.6%
Industrial
Leasable area (sq. ft.) 11,927 252,942 41,599 108,691 80,000
Average lease rate/square foot ($) $9.29 $4.62 $5.71 $8.57 $7.50
% of industrial portfolio 0.8% 17.9% 2.9% 7.7% 5.7%
Total portfolio
Leasable area (sq. ft.) 247,531 826,220 508,599 448,298 556,946
Average lease rate/square foot ($) $12.23 $10.62 $12.43 $12.82 $13.98
% of total portfolio 4.6% 15.3% 9.4% 8.3% 10.3%
Weighted average lease term
For the quarter ended June 30, 2021, the Trust maintained an average lease term of 5.2 years. In addition to
securing future revenues for the Trust and solidifying its tenant base, the Trust’s leasing renewal strategy is also
focused on ensuring longevity in the lease term when appropriate. These results further demonstrate the Trust’s
efforts to secure its tenant base and revenues in the years to come.
Top 10 tenants
The Trust’s three largest tenants are the Government of Québec, the Government of Canada, and Walmart
Canada Inc., representing respectively 6.7%, 6.0% and 2.8% of rental revenue. These revenues are generated by
multiple leases with these tenants whose maturities are spread over time. 35% of the Trust’s total revenue is
generated by leases signed with government agencies (federal, provincial, and municipal) and public companies,
thus generating stable and high-quality cash flow for the Trust’s operating activities.BTB 2021 Page
Reit Second Quaterly Report 31
The following table shows the contribution of the Trust’s top 10 tenants as a percentage of revenue as
at June 30, 2021. Their contribution accounts for 25.4% of annual rental revenue and 23.4% of leased area:
Client % of revenue % of leased area Leased area (sq. ft.)
Government of Québec 6.7 5.5 299,763
Government of Canada 6.0 4.7 255,323
Walmart Canada inc. 2.8 4.9 264,550
WSP Canada Inc. 1.6 0.9 48,478
Mouvement Desjardins 1.6 1.1 61,576
Intrado Life & Safety Canada, Inc. 1.6 1.0 53,767
Groupe BBA Inc. 1.6 1.3 69,270
Strongco 1.4 1.5 81,442
Germain Larivière Laval Inc. 1.1 1.9 101,194
Satcom Direct Avionics 1.0 0.6 32,000
25.4 23.4 1,267,363
Operating Results
The following table summarizes the financial results for the periods ended June 30, 2021 and 2020. The table should
be read in conjunction with the interim condensed consolidated financial statements and the accompanying notes:
Periods ended June 30 Quarter Cumulative (6 months)
(in thousands of dollars) 2021 2020 2021 2020
Reference (page) $ $ $ $
Rental revenue 31 26,034 23,063 49,566 46,931
Operating expenses 32 10,460 10,644 21,578 21,746
Net operating income (1)
32 15,574 12,419 27,988 25,185
Net financial expenses and financial income 32 6,575 6,518 14,811 15,945
Administration expenses 33 1,838 2,513 3,506 3,712
Transaction costs 35 — 882 — 1,711
Fair value adjustment on investment properties 34 — 3,607 — 10,505
Net income and comprehensive income 7,161 (1,101) 9,671 (6,688)
(1) Non-IFRS financial measure.
Rental revenue
For the quarter, rental revenue increased by $3.0 million or 12.9% compared to the same period last year. The
same period last year was affected by the COVID-19 impact of $0.8 million attributable to the CECRA program
and free rents granted. Also, the Trust invoiced $1.4 million of additional recoveries this quarter related to prior
years and $0.9 million for 2021. Since Q2 2020, two properties were sold and two were purchased. The net
negative impact on revenue caused by these transactions was $0.4 million for the quarter. The purchase of the
new industrial property at the end of June 2021 did not impact BTB’s results, but a positive impact on revenue
will be realized in the next quarter. In addition, an indemnity of $0.3 million has been recognized this quarter.
On a cumulative basis, the increase in rental revenue was $2.6 million or 5.6%. In addition to the second quarter
variance discussed above, in Q1 2021, the rental revenue was negatively impacted by $0.5 million compared to
the same period last year due to COVID-19.Page
32
Operating expenses
The following table summarizes the operating expenses for the periods ended June 30, 2021 and 2020:
Periods ended June 30 Quarter Cumulative (6 months)
(in thousands of dollars) 2021 2020 2021 2020
$ $ $ $
Operating expenses
Maintenance, repairs and other operating costs 3,926 3,594 7,733 7,316
Energy 1,042 1,368 2,754 2,981
Property taxes and insurance 5,492 5,682 11,091 11,449
Total operating expenses 10,460 10,644 21,578 21,746
% of rental revenue 40.2 46.2 43.5 46.3
Overall, operating expenses remained stable during the quarter compared to the same period last year.
Maintenance, repairs and other operating costs increased due to businesses returning to normal operations as
opposed to the governmental imposed shut down during the second quarter last year. In addition, property taxes
have benefitted from a reduction in school taxes in Québec and a reduction in consumption of energy was also
noted this quarter compared to the same period last year due to favorable weather conditions and productivity.
Net operating income
Periods ended June 30 Quarter Cumulative (6 months)
(in thousands of dollars) 2021 2020 2021 2020
$ $ $ $
Net operating income (1)
15,574 12,419 27,988 25,185
% of rental revenue 59.8 53.8 56.5 53.7
(1) Non-IFRS financial measure. See appropriate sections for definition and reconciliation to the closest IFRS measure.
Financial expenses and income
The following table summarizes the financial expenses for the periods ended June 30, 2021 and 2020:
Periods ended June 30 Quarter Cumulative (6 months)
(in thousands of dollars) 2021 2020 2021 2020
$ $ $ $
Financial income (262) (116) (396) (229)
Interest on mortgage loans 4,606 4,683 9,152 9,494
Interest on convertible debentures 669 831 1,626 1,668
Interest on bank loans 88 281 308 464
Other interest expense 61 138 129 234
Interest expense 5,162 5,817 10,819 11,631
Distributions on Class B LP units 26 45 56 97
Early repayment fees 188 — 188 79
Net financial expenses before non-monetary items 5,376 5,862 11,063 11,807
Accretion of effective interest on mortgage loans and convertible
debentures 428 287 787 672
Accretion of non-derivative liability component of convertible
debentures 90 — 186 —
Net financial expenses before the following items 5,894 6,149 12,036 12,479
Net adjustment to fair value of derivative financial instruments 733 330 2,547 4,427
Fair value adjustment on Class B LP units (52) 39 228 (961)
Net financial expenses 6,575 6,518 14,811 15,945BTB 2021 Page
Reit Second Quaterly Report 33
Financial income mainly consists of interest income generated from a balance of sale granted by the Trust in
the principal amount of $6.0 million pursuant to the sale in 2019 of a retail property located in Delson, Québec.
Interest expense decreased by $0.7 million during the current quarter compared to the same period last year,
mainly due to the recent conversions of the Series H debentures, the repayment of bank loans following the
equity issuance in April 2021, and benefits from refinancing. On June 30, 2021, the average weighted contractual
rate of interest on mortgage loans outstanding was 3.52%, 19 basis points lower than the average rate as
at June 30, 2020 (3.71%). Interest rates on first-ranking mortgage loans ranged from 2.37% to 6.80% as at
June 30, 2021 and, for the comparable period in 2020. The weighted average term of mortgage loans in place
as at June 30, 2021 was 4.5 years (4.8 years as at June 30, 2020).
Net financial expenses described above include non-monetary items. These non-monetary items include the
accretion of effective interest on mortgage loans and on convertible debentures, the accretion of non-derivative
liability component of convertible debentures and fair value adjustments on derivative financial instruments and
on Class B LP units. BTB recognized a fair value adjustment resulting in a non-monetary expense of $1.3 million
compared to $0.7 million for the same period last year.
Administration expenses
Periods ended June 30 Quarter Cumulative (6 months)
(in thousands of dollars) 2021 2020 2021 2020
$ $ $ $
Administration expenses 1,666 1,205 2,859 2,437
Expected credit losses 12 1,257 (158) 1,397
Unit-based compensation 160 51 805 (122)
Trust administration expenses 1,838 2,513 3,506 3,712
Administrative expenses increased by $0.5 million or 38% for the quarter compared to the same period last
year. The Trust incurred additional costs related to its growth strategy (key employee additions, investment in
technology and marketing). BTB managed to maintain a stable level of administration expenses at 6% of rental
revenue, due to continuous cost control efforts. This also explains the variance on a cumulative basis.
Expected credit losses decreased by $1.2 million for the quarter compared to the same period last year. A higher
provision was recorded last year to address the uncertainty related to the COVID-19 pandemic. However, the
constant efforts to collect receivables considerably reduced the balance of accounts receivable and therefore
reduced the provision previously recorded for credit losses. This also explains the variance on a cumulative basis.
Unit-based compensation increased by $0.1 million for the quarter compared to the same period last year. The
increase is partly attributable to the remeasurement of amounts owing under the deferred unit compensation
($4.07 at the end of the current quarter compared to $3.07 per unit at the end of the same quarter last year),
therefore increasing the deferred liability and the unit-based compensation expense accordingly.
Fair value adjustment of investment properties
Under IAS 40, the Trust accounts for its investment properties at fair value and recognizes the gain or loss
arising from a change in the fair value in profit or loss for the period in which it arises. Based on the assessment
of capitalization rates and market conditions, the Trust did not deem it appropriate to make any fair value
adjustment to its portfolio during the quarter.
On an annual basis, the Trust retains the services of independent external appraisers to evaluate the fair value
of a significant portion of its portfolio. Pursuant to its policy, the 10 most important properties and approximately
a third of the remaining properties are annually appraised by independent external appraisers. In addition, as part
of financing or refinancing and at the request of lenders, other properties may also be independently appraised
during the year.
For its properties that were not subject to independent appraisals, management receives quarterly capitalization
rate and discount rate market data reflecting real estate market conditions from independent external appraisers
and independent experts. The capitalization rate reports provide a range of rates for various geographic regions
and for various types and qualities of properties within each region. The Trust utilizes capitalization and discount
rates within ranges provided by external appraisers. To the extent that the externally provided capitalization rate
ranges change from one reporting period to the next or should another rate within the provided ranges be more
appropriate than the rate previously used, the fair value of the investment properties would increase or decrease
accordingly.You can also read