KARNATAKA THE SILICON VALLEY OF INDIA - LOTUS MAHAL IN HAMPI, KARNATAKA - IBEF

Page created by Diana Sullivan
 
CONTINUE READING
KARNATAKA THE SILICON VALLEY OF INDIA - LOTUS MAHAL IN HAMPI, KARNATAKA - IBEF
LOTUS MAHAL IN HAMPI, KARNATAKA

 KARNATAKA
 THE SILICON VALLEY OF INDIA

For updated information, please visit www.ibef.org                         April 2018
KARNATAKA THE SILICON VALLEY OF INDIA - LOTUS MAHAL IN HAMPI, KARNATAKA - IBEF
Table of Content

   Executive Summary……………….….…….3

   Advantage State………………………..…...5

   Karnataka Vision 2020……………………..6

   Karnataka – An Introduction….…….……...7

   Karnataka Budget 2018-19…………..……20

   Infrastructure Status..................................23

   Business Opportunities…………...............44

   Doing Business in Karnataka……………...79

   State Acts & Policies..................................80
KARNATAKA THE SILICON VALLEY OF INDIA - LOTUS MAHAL IN HAMPI, KARNATAKA - IBEF
EXECUTIVE SUMMARY … (1/2)

                                                 At current prices, the Gross State Domestic Product (GSDP) of Karnataka is estimated to be about Rs12.69
                                                  trillion (US$ 196.88 billion) in 2017-18F.
     Strong growth in GSDP
                                                 The per capita GSDP increased to Rs 193,409 (US$ 3,001) growing at a CAGR of 14.32 per cent between 2011-
                                                  12 & 2017-18F.

                                                 Karnataka is the IT hub of India & home to the 4th largest technology cluster in the world*. Karnataka has 19
                                                  operational IT/ITeS SEZs, 5 software technology parks & dedicated IT investment regions.
     IT hub of India                             Exports of electronics and computer software from the state reached US$ 62.66 billion 2016-17. Exports of IT &
                                                  electronic products accounted for around 38.99 per cent share in India's electronics and computer software
                                                  exports & 76.36 per cent share in Karnataka’s overall exports.

                                                 Karnataka has vibrant automobile, agro, aerospace, textile & garment, biotech & heavy engineering industries.
     Vibrant industrial base                      The state has sector-specific SEZs for key industries such as IT, nanotechnology, biotechnology, engineering,
                                                  food processing and aerospace.

                                                 The cumulative FDI inflows in the state from April 2000 to December 2017 were recorded at US$ 28.82 billion, the
     One of the preferred
                                                  3rd highest in India after Maharashtra and New Delhi and accounted for a share of 8.0 per cent in India’s
     investment destinations                      cumulative FDI inflows.

    Note: F – Forecast, *As per latest data available
    Source: DIPP, Visvesvaraya Trade Promotion Centre, Karnataka Economic Survey 2017-18 Department of Industrial Policy & Promotion

3        KARNATAKA                                                                                                   For updated information, please visit www.ibef.org
KARNATAKA THE SILICON VALLEY OF INDIA - LOTUS MAHAL IN HAMPI, KARNATAKA - IBEF
EXECUTIVE SUMMARY … (2/2)

                                                 During 2017-18*, the total exports of the state were recorded at US$ 39.38 billion. During 2016-17, exports
     Strong growth in export                      contributed about 47 per cent in the state’s economy. Sectors such as biotechnology, computer software and
                                                  electronics are major contributors in the overall exports from the state.

                                                 Karnataka has 52 universities, 4,519 pre-university colleges, 535 Technical Institutions, 206 engineering colleges
     Strong knowledge                             & 314 polytechnics, 47 medical colleges & 38 dental colleges.
     infrastructure                              The state also houses 401 R&D centres; around 400 of the Fortune Global 500 companies outsource their IT
                                                  services to firms in Bengaluru.

                                                 Sugarcane is the major crop of the state with production of about 31.5 million tonnes in 2017-18#. The
     Significant agriculture
                                                  state’s total food grain production is estimated to be 10.77 million tonnes in 2017-18. Karnataka is also the
     base                                         third largest producer of plantation crops in the country.

                                                 Karnataka boasts of a diverse flora & fauna & a 320 km natural coast line, which makes it a nature tourist's
     Strong growth in tourism                     paradise. Tourist arrivals in the state increased from 36.7 million in 2006 to 102.3 million in 2017^. The state
     sector                                       has world heritage sites at Hampi & Pattadakal. The sector contributes 14.8 per cent to GSDP of Karnataka;
                                                  plans are afoot to expand to 26 per cent by 2020.

    Source: Indian Minerals Yearbook 2014, Economic Survey of Karnataka 2017-18 Karnataka State Budget 2018-19,2017-18* - (April-Sept),
    # Advance Estimates of Agriculture Dept,2017^ up to November 2017

4        KARNATAKA                                                                                                   For updated information, please visit www.ibef.org
KARNATAKA THE SILICON VALLEY OF INDIA - LOTUS MAHAL IN HAMPI, KARNATAKA - IBEF
ADVANTAGE: KARNATAKA

         March                              High economic growth                                                      Rich talent pool                                       2022
         2018                 GSDP expanded at a CAGR of 14.32 per cent between                    Karnataka is termed as the Knowledge Capital of India.                 target
                               2011-12 and 2017-18.                                                 The state has successfully attracted skilled labour,
        Capacity              Buoyant services (IT, tourism) and industries driving                 especially, in the knowledge sector. Karnataka is                Solar energy
      allocated for            economic growth.                                                      among the states that produce a large number of                  share in total
      solar energy-           Sector specific SEZs and SIRs facilitating growth.                    doctors, engineers and medical technicians in the                    energy
      8561.48MW                                                                                      country.                                                         consumption
                                                                                                                                                                       is expected
                                                                                                                                                                        to reach 3
                                                                                                                                                                         per cent

                                                                                      Advantage
                                                                                      Karnataka
                                                  Infrastructure                                                       Policy support
                              Well-developed social, physical and industrial                       Wide range of fiscal and policy incentives for
                               infrastructure.                                                       businesses under the Karnataka Industrial Policy,
                                                                                                     2014-19.
                              Good road, rail, water and air connectivity and
                               substantial port infrastructure.                                     Investor-friendly sector-specific policies to promote
                                                                                                     industries such as IT, biotechnology, tourism and
                              Well-developed telecom infrastructure.
                                                                                                     manufacturing.
                              Excellent healthcare facilities.
                                                                                                    Simplified procedures for investment.
                                                                                                    In January 2017, Karnataka department of Commerce
                                                                                                     and Industries introduced an NRI policy to attract
                                                                                                     investments from non-resident Kannadigas.
                                                                                                    Karnataka i4 policy to incentivise the new IT / ITeS to
                                                                                                     set up their facility in Tier 2/3 cities across Karnataka

    Source: Karnataka Udyog Mitra, D&B Cluster State Overview, Karnataka Vision 2020, Department of Industrial Policy and Promotion, Visvesvaraya Trade Promotion Centre.

5        KARNATAKA                                                                                                     For updated information, please visit www.ibef.org
KARNATAKA THE SILICON VALLEY OF INDIA - LOTUS MAHAL IN HAMPI, KARNATAKA - IBEF
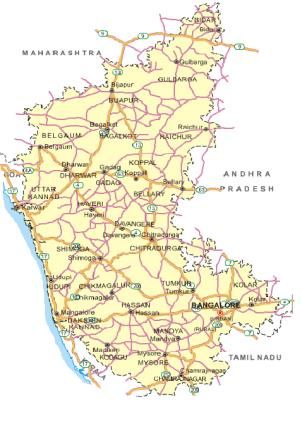
KARNATAKA VISION 2020

                                                                                                      Develop the state as a vibrant knowledge
                                                       Build infrastructure to boost productive
                                                                                                       society.
                                                        potential of the economy.
                                                                                                      Focus on job oriented growth through
                                                       Various metro rail and mono rail projects
                                                                                                       skill development of the workforce.
                                                        are in progress.

              Increase rural incomes through
                                                                                                        Education/                             Better governance through wider
               greater viability of agriculture and                              Infrastructure     Skill Development
               allied activities.                                                                                                               participation and deep democratic
                                                                                                                                                decentralisation.
              Bridge the gap between socially
               backward and vulnerable groups                                                                                                  Encourage transparency and
                                                                Poor and                                              Governance
               and rest of the people.                                                                                                          accountability.
                                                             Backward Classes
                                                                                           Vision 2020
                                                                Healthcare/                                           Industry                  Build and sustain Bangalore’s
                                                              Social Amenities                                                                   leadership in science, technology
               Improve access and availability of                                                                                               and knowledge based industries.
                                                                                                       Women
                quality healthcare for all.                                           Tourism                                                   Achieve a sustainable and orderly
                                                                                                     Empowerment
                                                                                                                                                 process of industrialisation and
                                                                                                                                                 urbanisation.

                                                       Preserve and promote Karnataka’s rich
                                                        heritage.                                        Enhance opportunities and empower
                                                                                                          women across economic, social and
                                                       Karnataka Tourism Vision Group (KTVG)
                                                                                                          political spheres.
                                                        was set up in October 2013 to advise on
                                                        promoting tourism in state.

    Source: State Planning Department

6        KARNATAKA                                                                                                         For updated information, please visit www.ibef.org
KARNATAKA THE SILICON VALLEY OF INDIA - LOTUS MAHAL IN HAMPI, KARNATAKA - IBEF
KARNATAKA FACT FILE

                                                                                                 Some of the prominent cities in the state are Ankola, Bengaluru,
                                                                                                  Bagalkot, Belgaum, Bidar, Bijapur, Chikmagalur, Chitradurga,
                                                                                                  Dandeli, Hubli-Dharwad, Mangalore, Mysore and Shimoga.

                                                                                                 Karnataka has a tropical climate with three major seasons: warm
                                                                                                  and dry from February to May, monsoon from June to October and
                                                                                                  winter from November to January.

                                                                                                    Parameters                                         Karnataka
                                                                     Source: Maps of India
                                                                                                    Capital                                            Bengaluru

                                                                                                    Geographical area (sq km)                           192,000
      Karnataka is located in the southern region of India. The state is
                                                                                                    Administrative districts (No)                          30
       surrounded by the Arabian Sea in the west, Goa in the northwest,
       Maharashtra in the north, Andhra Pradesh in the east, Tamil Nadu in                          Population density (persons per sq km)                319
       the southeast, and Kerala in the southwest.
                                                                                                    Total population (million)                            61.1
      Languages spoken are Kannada, Tulu, Kodava, Hindi and English.
                                                                                                    Sex ratio (females per 1,000 males)                   973

                                                                                                    Literacy rate (%)                                     75.6

                                                                                                       Male literacy rate                                 82.5

                                                                                                       Female literacy rate                               68.1

    Source: Economic Survey of Karnataka 2017-18, Census 2011 Office of Registrar General, India.

7        KARNATAKA                                                                                                      For updated information, please visit www.ibef.org
KARNATAKA THE SILICON VALLEY OF INDIA - LOTUS MAHAL IN HAMPI, KARNATAKA - IBEF
KARNATAKA IN FIGURES … (1/2)

     Parameter                                                               Karnataka               All states         Source

     Economy                                                                   2017-18                2017-18

                                                                                                                        Directorate of Economics & Statistics of Karnataka,
         GSDP as a percentage of all states’ GSDP                                 7.6                  100.0
                                                                                                                        Central Statistics Office
                                                                                                                        Directorate of Economics & Statistics of Karnataka,
         GSDP growth rate (in Rs) (%)                                           13.11                    9.8
                                                                                                                        Central Statistics Office
                                                                                                                        Directorate of Economics & Statistics of Karnataka,
         Per capita GSDP (US$)                                                  3,001                 1,975.05
                                                                                                                        Central Statistics Office

     Physical Infrastructure

         Installed power capacity (MW)                                        24,612.77             340,526.58          Central Electricity Authority, as of March 2018

                                                                                                                        Telecom Regulatory Authority of India - as of January
         Wireless subscribers (No)                                           67,277,163           1,151,936,422
                                                                                                                        2018
                                                                                                                        Telecom Regulatory Authority of India - as of
         Internet subscribers (Mn)                                            29,97,000            445,960,000
                                                                                                                        December 2017

         National Highway length (km)                                           6,791                 115,435           NHAI - as of June 2017

         Major and minor ports (No)                                             1 + 10                13+187            India Ports Association

         Airports (No)                                                             5                     125            Airports Authority of India

    Note: GSDP, per capita GSDP figures are taken at current prices, exchange rates used is average of 2017-18 i.e. 64.45

8         KARNATAKA                                                                                                         For updated information, please visit www.ibef.org
KARNATAKA THE SILICON VALLEY OF INDIA - LOTUS MAHAL IN HAMPI, KARNATAKA - IBEF
KARNATAKA IN FIGURES … (2/2)

     Parameter                                                            Karnataka                All states   Source

     Social Indicators

         Literacy rate (%)                                                    75.6                   73.0       Census, 2011

         Birth rate (per 1,000 population)                                    18.1                   21.6       Karnataka Economic Survey 2016-17

     Investment

                                                                                                                Department of Industrial Policy & Promotion, April
         FDI equity inflows (US$ billion)                                     28.82                 368.10
                                                                                                                2000 to December 2017

     Industrial Infrastructure

                                                                                                                Department of Economic Affairs, Ministry of Finance,
         PPP projects completed & operational (No)                             24                     740
                                                                                                                Government of India, July 2016
                                                                                                                Department of Commerce, Ministry of Commerce &
         Operational SEZs (No)                                                 26                     204
                                                                                                                Industry, December 2017

    PPP: Public-Private Partnership, SEZ: Special Economic Zone, SRS: Sample Registration System

9        KARNATAKA                                                                                              For updated information, please visit www.ibef.org
ECONOMIC SNAPSHOT – GSDP

      At current prices, the Gross State Domestic Product (GSDP) of                                             GSDP of Karnataka at current prices
       Karnataka stood at about Rs12.69 trillion (US$ 196.88 billion) in
       2017-18F.
                                                                                                   250.00                                                                                                               14.0
                                                                                                                                        CAGR (in Rs) 13.11%
      The GSDP (in Rs) of the state grew at a CAGR of 13.11 per cent
       between 2011-12 and 2017-18F.

                                                                                                                                                                                                                12.69
                                                                                                                                                                                                                        12.0
                                                                                                   200.00
      Growth has been mainly driven by secondary and tertiary sectors.

                                                                                                                                                                                           11.32

                                                                                                                                                                                                   196.88
                                                                                                                                                                                                                        10.0

                                                                                                                                                                         10.13

                                                                                                                                                                                 168.79
                                                                                                                                                         9.13
                                                                                                   150.00

                                                                                                                                                                   154.72
                                                                                                                                                                                                                        8.0

                                                                                                                                                    149.25
                                                                                                                                            8.17
                                                                                                                                        134.99
                                                                                                                             127.72
                                                                                                                 126.38

                                                                                                                              6.95
                                                                                                                                                                                                                        6.0
                                                                                                   100.00

                                                                                                                6.06
                                                                                                                                                                                                                        4.0
                                                                                                    50.00
                                                                                                                                                                                                                        2.0

                                                                                                     0.00                                                                                                               0.0

                                                                                                                2011-12

                                                                                                                            2012-13

                                                                                                                                        2013-14

                                                                                                                                                    2014-15

                                                                                                                                                                   2015-16

                                                                                                                                                                                 2016-17

                                                                                                                                                                                                   2017-2018F
                                                                                                                                      US$ billion             Rs trillion

 Note: F- Forecast, exchange rates used are averages of each year, provided on page 56
 Source: Directorate of Economics & Statistics of Karnataka, Central Statistics Office NSDP# -Karnataka Socio Economic Survey 2017-18

10      KARNATAKA                                                                                                         For updated information, please visit www.ibef.org
ECONOMIC SNAPSHOT – NSDP

      The Net State Domestic Product (NSDP) of Karnataka was recorded                                           NSDP of Karnataka at current prices
       at about Rs 11,45 trillion (US$ 177.68 billion) in 2017-18.

      The NSDP (in Rs) of the state grew at a CAGR of 12.83 per cent                              200.00                                                                                                       14.0
                                                                                                                                       CAGR (in Rs) 12.83%
       between 2011-12 and 2017-18F.
                                                                                                   180.00
                                                                                                                                                                                                                12.0

                                                                                                                                                                                                       177.68
                                                                                                   160.00

                                                                                                                                                                                                     11.45
                                                                                                                                                                                           152.30
                                                                                                   140.00                                                                                                       10.0

                                                                                                                                                                                           10.22
                                                                                                                                                                                 139.53
                                                                                                                                                                    134.83

                                                                                                                                                                                 9.13
                                                                                                   120.00

                                                                                                                                                        123.40
                                                                                                                                                                                                                8.0

                                                                                                                                                                  8.25
                                                                                                                                    116.79
                                                                                                                115.74
                                                                                                   100.00

                                                                                                                                                      7.47
                                                                                                                                                                                                                6.0

                                                                                                                                             6.36
                                                                                                    80.00

                                                                                                                          5.55
                                                                                                    60.00                                                                                                       4.0

                                                                                                    40.00
                                                                                                                                                                                                                2.0
                                                                                                    20.00

                                                                                                     0.00                                                                                                       0.0

                                                                                                                2011-12

                                                                                                                                   2012-13

                                                                                                                                                      2013-14

                                                                                                                                                                  2014-15

                                                                                                                                                                                 2015-16

                                                                                                                                                                                           2016-17

                                                                                                                                                                                                     2017-18F
                                                                                                                                                    US$ billion             Rs billion

 Note: F- Forecast, exchange rates used are averages of each year, provided on page 56
 Source: Directorate of Economics & Statistics of Karnataka, Central Statistics Office NSDP# -Karnataka Socio Economic Survey 2017-18

11      KARNATAKA                                                                                                                For updated information, please visit www.ibef.org
ECONOMIC SNAPSHOT – PER CAPITA GSDP

      The state’s per capita GSDP was Rs 193,409 (US$ 3,001) in 2017-                                      GSDP per capita of Karnataka at current prices
       18.

      The per capita GSDP (in Rs) increased at a CAGR of 11.89 per cent                            3,500                                                                                                                         250000.00
                                                                                                                                              CAGR (in Rs) 11.89%
       between 2011-12 and 2017-18.

                                                                                                    3,000

                                                                                                                                                                                                                          3,001
                                                                                                                                                                                                                                  200000.00

                                                                                                                                                                                                                    193,409
                                                                                                    2,500

                                                                                                                                                                                                            2,601
                                                                                                                                                                                                       174,483
                                                                                                                                                                                               2,410
                                                                                                                                                                      2,350
                                                                                                                                                                                                                                  150000.00

                                                                                                                                                                                          157,755
                                                                                                                                                              2,149
                                                                                                    2,000

                                                                                                                2,056

                                                                                                                                   2,055

                                                                                                                                                                                143,701
                                                                                                                                                       129,986
                                                                                                    1,500

                                                                                                                                             111,891
                                                                                                                                                                                                                                  100000.00

                                                                                                                          98,567
                                                                                                    1,000

                                                                                                                                                                                                                                  50000.00
                                                                                                      500

                                                                                                        -                                                                                                                         0.00

                                                                                                                2011-12

                                                                                                                                   2012-13

                                                                                                                                                       2013-14

                                                                                                                                                                      2014-15

                                                                                                                                                                                          2015-16

                                                                                                                                                                                                       2016-17

                                                                                                                                                                                                                    2017-18F
                                                                                                                                                                      US$                 Rs

 Note: F- Forecast, exchange rates used are averages of each year, provided on page 56
 Source: Directorate of Economics & Statistics of Karnataka, Central Statistics Office Per Capita GSDP^ - calculated using GSDP million US$/Population in million

12      KARNATAKA                                                                                                                  For updated information, please visit www.ibef.org
ECONOMIC SNAPSHOT – PER CAPITA NSDP

      The state’s per capita NSDP& in 2017-18 was Rs1,74,551 (US$                                           NSDP per capita of Karnataka at current prices
       2,708.32).

      The per capita NSDP (in Rs) increased at a CAGR of 11.62 per cent                            3000.00                                                                                                                200000.0
                                                                                                                                                             CAGR: (in Rs) 11.62%
       between 2011-12 and 2017-18.
                                                                                                                                                                                                                           180000.0

                                                                                                                                                                                                                2,708.32
                                                                                                    2500.00

                                                                                                                                                                                                               174,551
                                                                                                                                                                                                                           160000.0

                                                                                                                                                                                                     157,436
                                                                                                                                                                                                    2,346.64
                                                                                                                                                                                                                           140000.0

                                                                                                                                                                                         2,173.34
                                                                                                    2000.00

                                                                                                                                                                                         142,267
                                                                                                                                                                         2,123.03
                                                                                                                                                           1,964.12

                                                                                                                                                                       129,823
                                                                                                                                                                                                                           120000.0

                                                                                                                   1,882.44

                                                                                                                                              1,879.14

                                                                                                                                                         118,829
                                                                                                    1500.00                                                                                                                100000.0

                                                                                                                                         102,319
                                                                                                                              90,263
                                                                                                                                                                                                                           80000.0
                                                                                                    1000.00
                                                                                                                                                                                                                           60000.0

                                                                                                                                                                                                                           40000.0
                                                                                                      500.00
                                                                                                                                                                                                                           20000.0

                                                                                                        0.00                                                                                                               0.0

                                                                                                                   2011-12

                                                                                                                                         2012-13

                                                                                                                                                         2013-14

                                                                                                                                                                       2014-15

                                                                                                                                                                                         2015-16

                                                                                                                                                                                                    2016-17

                                                                                                                                                                                                               2017-18
                                                                                                                                                                      US$           Rs

 Note: exchange rates used are averages of each year, provided on page 56
 Source: Directorate of Economics & Statistics of Karnataka, Central Statistics Office per capita NSDP& -calculated using NSDP million US$/Population in million

13      KARNATAKA                                                                                                                      For updated information, please visit www.ibef.org
ECONOMIC SNAPSHOT – PERCENTAGE
                  DISTRIBUTION OF GSVA

      In 2017-18F, the tertiary sectorµ contributed 66.63 per cent to the                                 Visakhapatnam
                                                                                                                 GSVA composition
                                                                                                                         port trafficby
                                                                                                                                     (million
                                                                                                                                        sectortonnes)
       state’s GSVA at current prices, followed by the secondary sector
       (21.75 per cent) and the primary sector (11.62 per cent).
                                                                                                  100%
      At a CAGR* of 19.17 per cent, the tertiary sector has been the                                                  56.84%            CAGR*            66.63%
       fastest growing among the three sectors from 2011-12 to 2017-18F.                           90%
       The growth has been driven by trade, hotels, real estate, finance,
       insurance, transport, communications and other services.                                    80%

      The secondary sectorµ grew at a CAGR* of 9.24 per cent between                              70%
       2011-12 and 2017-18F. This was driven by manufacturing,                                                                           19.17%
       construction and electricity, gas & water supply.                                           60%

      The primary sectorµ grew at a CAGR* of 10.45 percent between
                                                                                                   50%
       2011-12 and 2017-18F.
                                                                                                   40%                 28.67%            9.24%

                                                                                                   30%                                                    21.75%

                                                                                                   20%
                                                                                                                                         10.45%
                                                                                                   10%                 14.50%
                                                                                                                                                          11.62%

                                                                                                    0%
                                                                                                                       2011-12                           2017-18F

 Note: F- Forecast,*CAGR in Rs term
 Source: Directorate of Economics & Statistics of Karnataka, Central Statistics Office, Aranca Research Sector-wise %share of GSDPµ -Karnataka Socio Economic Survey 2017-18

14      KARNATAKA                                                                                                   For updated information, please visit www.ibef.org
ECONOMIC SNAPSHOT – AGRICULTURAL
                   PRODUCTION

     Production of major crops in Karnataka (lakh tonnes)                                      Sugarcane is a major crop of the state with production estimates of
                                                                                                about 31.5 million tonnes in 2017-18*. The state’s total food grain
                                                                                                production is estimated to be 10.7 million tonnes during 2017-18*.
     Crop                              2016-17**                      2017-18*
                                                                                               During 2017-18*, major oilseeds production in the state was
     Cereals                              79.58                         87.37                   0.97million tonnes. Production of cereals and pulses in the state is
                                                                                                estimated to be 8.73 million tonnes & 2.03 million tonnes,
     Pulses                               20.41                         20.28
                                                                                                respectively, in 2017-18.
     Total food grains                    99.99                        107.65
                                                                                               In 2017-18*, total production of major fruits in the state was 7.55
     Oilseeds                              8.05                          9.7                    million tonnes.
     Cotton                               10.24                         12.24
     Sugarcane                           273.78                          315
     Tobacco                               0.65                          0.89

 Source: Department of Agriculture & Corporation, Government of Karnataka, ** Final Estimates of DE&S, *Advance Estimates of Agriculture Dept

15      KARNATAKA                                                                                                    For updated information, please visit www.ibef.org
ECONOMIC SNAPSHOT – EXPORTS…(1/3)

      During 2017-18*, exports from the state contributed about 47 per                                  Exports from Karnataka (in US$ billion)
       cent to the state’s economy, with biotechnology, computer software
       and electronics being the major exports.
                                                                                               90.00                        CAGR: 15.84%
      In 2017-18*, total exports from the state aggregated to US$ 39.38                       80.00

                                                                                                                                                          82.06
       billion. Karnataka’s exports increased at a CAGR of 15.84 per cent

                                                                                                                                               79.76
                                                                                                                                       78.43
                                                                                               70.00
       during 2010-11 to 2016-17.
                                                                                               60.00
      Electronics and software exports from the state reached US$ 62.67                       50.00
       billion in FY17.                                                                        40.00

                                                                                                                               45.08
                                                                                                                    40.10

                                                                                                                                                                   39.38
                                                                                               30.00

                                                                                                         33.97
                                                                                               20.00
                                                                                               10.00
                                                                                                  -
                                                                                                       2011-12 2012-13 2013-14 2014-15 2015-16 2016-17 2017-18*

     Karnataka exports by commodity (US$ million)

     Commodity                                                                      2015-16                         2016-17                            2017-18*

     Electronics & computer software                                               60,503.00                       62,666.37                           30,413.21
     Readymade garments                                                            2,273.72                         2,231.81                            1,161.28
     Petroleum & petroleum products                                                1,841.34                         1,713.51                            652.57
     Engineering goods                                                             3,082.71                         4,093.65                            2,718.46
     Iron ores & minerals (incl granites)                                           122.89                            136.17                             97.60

 Source: Visvesvaraya Trade Promotion Centre, Government of Karnataka,* up to September 2018

16      KARNATAKA                                                                                                For updated information, please visit www.ibef.org
ECONOMIC SNAPSHOT – EXPORTS…(2/3)

     Karnataka exports by commodity (US$ million)

     Commodity                              2011-12            2012-13            2013-14            2014-15              2015-16    2016-17        2017-18*

     Silk products                          139.83             120.42             107.83              91.90                74.19      58.54           23.23

     Coffee products                        659.26             650.71             596.88             824.98               480.54      507.33         319.99

     Basic chemicals,
                                           1,054.85           1,331.80           1,376.91            978.10               1,680.65   1,994.13       1,005.06
     pharmaceuticals and cosmetics
     Agriculture & processed food
                                            158.53             211.56             215.66             229.43               803.54      650.51         301.37
     products

     Gems and jewellery                    4,929.98           4,508.01           4,010.45           3,649.30              5,119.41   5,430.03       1,547.27

     Cashew and cashew kernels              183.25             155.96             199.07             249.67                111.60     155.61          98.39

     Handicrafts                             55.47              68.86              85.60              90.91                194.48     172.18          93.93

     Leather products                        66.49              83.23              74.65              90.08                55.10       57.29          49.08

     Chemicals and allied products           99.73              90.41              93.23             158.43                74.50       80.12          39.56

     Marine products                        125.70             116.37             177.01             217.82                118.58     162.52          79.37

     Plastic goods                          125.49             145.09             116.12              62.38                121.53     137.88          69.32

     Spices                                 145.44             166.45             190.78             186.79                50.13       49.18          29.47

     Wool & woollen products                 26.80              27.62              29.20              31.69                 0.93       0.15            0.94

     Miscellaneous                         1,001.04            881.79             923.19             958.36               3214.48    1292.85         683.23

 Source: Visvesvaraya Trade Promotion Centre, Government of Karnataka, Economic Survey 2017-2018,* up to September 2018

17      KARNATAKA                                                                                              For updated information, please visit www.ibef.org
ECONOMIC SNAPSHOT – EXPORTS…(3/3)

     Incentives & concessions for export in Karnataka
      Exemption from entry tax

      Refund of certification charges

      Refund of cost incurred for export consultancy / market Intelligence studies

      Brand promotion and quality assurance

      Support for the establishment of CFS and other export infrastructure

      Compensation of export Credit.

      Support for development of exports in gherkins, rose onions and floriculture.

      Market development assistance for trade promotion and overseas trade delegations.

     Policies for export promotion

     Industrial Policy 2014-19                                                   Karnataka Tourism Policy 2009
     Karnataka State Mineral Policy 2008                                         Karnataka Semi Conductor Policy 2010
     Grape Processing & Wine Policy 2007                                         Karnataka Solar Policy 2011
     Karnataka Renewable Energy Policy 2009                                      Karnataka Integrated Agribusiness Development policy 2011

     Karnataka SEZ Policy 2009                                                   Karnataka Animation Visual Effects & Comic Policy 2012

     Karnataka Pharmaceutical Policy 2013                                        Karnataka New Infrastructure Policy 2013

 Source: Economic Survey of Karnataka 2015-16

18      KARNATAKA                                                                                   For updated information, please visit www.ibef.org
ECONOMIC SNAPSHOT – FDI INFLOWS &
                   INVESTMENTS

      The state has a stable political environment. Successive state                                      FDI equity inflows, 2008-09 to 2017-18 (US$ billion)
       governments have recognised the importance of industries in the
       state and have provided a conducive business environment to attract                        7.00
       domestic as well as foreign entities. Karnataka is ranked 5th in terms
                                                                                                  6.00

                                                                                                                                                                                                                                   6.44
       of attracting private sector investments in India. According to the
                                                                                                  5.00
       Department of Industrial Policy & Promotion (DIPP), the cumulative
                                                                                                  4.00
       FDI inflows from April 2000 to December 2017 were recorded at US$

                                                                                                                                                                                                       4.12
                                                                                                  3.00

                                                                                                                                                                                             3.44
       $ 28.82 billion, the 3rd highest in India after Maharashtra and Delhi
       and accounted for a share of 8.0 per cent in India’s cumulative FDI                        2.00

                                                                                                                                                                                                                      2.13
                                                                                                                  2.02

                                                                                                                               1.09

                                                                                                                                            1.12

                                                                                                                                                          1.53

                                                                                                                                                                    1.02

                                                                                                                                                                               1.89
       inflows.                                                                                   1.00
                                                                                                  0.00
      With a private equity & venture capital investment of US$ 2.51 billion

                                                                                                                                                                                                                                 2017-181
                                                                                                                  2008-09

                                                                                                                               2009-10

                                                                                                                                            2010-11

                                                                                                                                                          2011-12

                                                                                                                                                                    2012-13

                                                                                                                                                                               2013-14

                                                                                                                                                                                             2014-15

                                                                                                                                                                                                                      2016-17
                                                                                                                                                                                                       2015-16
       from 280 deals, Karnataka stood at the 2nd position, among all other
       states.

                                         Investment intentions in terms of IEMs filed, LOIs/DILs issued in Karnataka

       300

                                                                                                                                               285.0
       250
       200
                  217

                                                                                                                                                                              194.0
       150
                                       169

       100
                                                            110

                                                                                                         106.0
                                                                                 89

         50               14.54                                                                                                                          23.93                           23.50                   14
                                                7.33                 1.54                3.34                           4.84
                                                                                                                                                                                                                                0.24
          0
                        2011                 2012                 2013                2014                       2015                                  2016                           2017                            2018
                                                       Number of Investment Intentions           Proposed Investments (US$ Billion)

 Note: 1During April to December 2017
 Source: Department of Industrial Policy & Promotion Directorate of Economics and Statistics, Government of Karnataka

19      KARNATAKA                                                                                                                        For updated information, please visit www.ibef.org
ANNUAL BUDGET 2018-19 … (1/3)

      Total consolidated budget size for 2018-19 was US$ 32.44 billion.
      Budget highlights:
        •   For the second successive year Karnataka has occupied the first position in attracting industrial investments.
        •   Rs 2,500 crore (US$ 386.16 million) has been allocated for development of Bengaluru.
        •   Setting up of 11 new industrial townships has been proposed by the state government
        •   Creation of a Detailed Project Report (DPR) for 105.55 km long phase-III of Namma Metro will be soon be undertaken
        •   The state government is going to come out with a new logistics policy to create a Multi-Modal Transportation Network. Also, a logistics park
            will be set up on 400 acres of land near Bengaluru and 50 acres near Hubbali.
        •   To promote innovation culture in the state, setting up of Karnataka Innovation Authority under the chairmanship of the chief minister has been
            announced.

 Source: Government of Karnataka, Budget 2016-17

20      KARNATAKA                                                                                      For updated information, please visit www.ibef.org
ANNUAL BUDGET 2018-19 … (2/3)

     Primary & Secondary education :                                            Major sector-wise allocations as per budget, 2016-17,2017-18
                                                                                and 2018-19
      The state government has taken various initiatives such as,
       “Athyuthama S.D.M.C.” award in each taluk to the best performing                                  Annual           Annual          Annual
       School Development and Management Committee at Government                                        allocation       allocation      allocation
                                                                                Sector
       Primary and High schools.                                                                       (US$ million)    (US$ million)   (US$ million)
                                                                                                         2016-17          2017-18         2018-19
      The state government, along with Agasthya Foundation, is going to
       undertake establishment of Science Committee’s at all high schools       Primary &
       and pre-university colleges.                                             secondary                2,653.98         2,835.13        3,452.27
                                                                                education
     Higher education:
                                                                                Higher education          710.51           683.10         697.25
      To encourage women in post graduation ,government has given
                                                                                Energy                   1,929.72         1,594.36        2,183.50
       exemption to all girls taking admission in      Government Pre-
       University, Degree and Post Graduation courses.                          Water resources          2,211.57         2,472.4         2,471.12

      To excellence in higher education , government has facilitate with the   Urban
                                                                                                         2,269.01         2,131.39        2,656.16
       grant of Rs.1 crore (US$0.02 million) for each to establish post         development
       graduate centre at Chikkamagaluru under Kuvempu University and a         Social welfare            834.70           987.62         1008.34
       post graduate centre at Jamakhandi of Bagalkote under Rani
       Channamma University.                                                    Health and family
                                                                                                          768.71           794.38         1026.41
                                                                                welfare
                                                                                Agriculture               663.61           788.49         903.46
                                                                                Horticulture              115.03           169.34         153.69
                                                                                Sericulture               56.06            66.59           70.59
                                                                                Fisheries                 46.13             52.3           38.92
                                                                                Forest,
                                                                                environment               245.79           268.83         301.05
                                                                                and Ecology

21      KARNATAKA                                                                                   For updated information, please visit www.ibef.org
ANNUAL BUDGET 2018-19 … (3/3)

     Agriculture:

      The state has come up with the a scheme “Raitha Belaku” to give direct income assistance to mitigate the miseries of dryland farmers. Under this
       scheme US$77.23 per hectare subject to maximum of US$154.46 for each farmer who cultivates rain fed crops , would be directly transferred to
       the bank account, due to which 70 lakhs farmer would be benefited.

      To encourage and nurture innovations in the agriculture sector , an Agri-Innovation Centre would be set up in association with the Centre for
       Cellular and Molecular Platforms (C-CAMP).

      Full interest of amount of Rs.124.70 crore (US$192.62 million) has been waived off in respect of farm loans overdue as on 30-09-2015 and also
       for who have paid the principal amount within 31st March 2017.

      Implementation of online market system to 157 markets in states to ensure fair price to farmers and to prevent the hindrance caused by middle
       men has become model to country.

     Energy:

      From 2018-19, electricity consumption expenses of 7 hours per day will be reimbursed to consumers in respect of private HT and LT Community
       Lift Irrigation units of cooperative societies of members with a capacity of 10 HP and less.

      During the year 2018-19, to strengthen the transmission network, 35 power sub-stations will be established through Karnataka Power
       Transmission Corporation.

     Water Resources:

      Upper Krishna Project Stage-2 would be taken up at a cost of Rs.750 crore (US$ 115.85 million) for Modernization of Narayanpura right bank
       canal from 0.00 km to 95.00 km .

      As per state budget 2018-19, US$ 2.47 billion has been allocated for the Water Resource Department.

22      KARNATAKA                                                                                  For updated information, please visit www.ibef.org
PHYSICAL INFRASTRUCTURE – ROADS

                                                                                             Up to September 2017, under NABARD loan assistance scheme, an
                                                                                              amount of Rs 182.32 crore (US$ 28.36 million) has been sanctioned
                                                                                              in RIDF-XXIII.
                                                                                             Public Works Department (PWD) of the state is using hi-tech
                                                                                              vehicles to help in improvement of roads. The vehicles will be used
                                                                                              to check the status of 20,000 km of core roads in the state according
                                                                                              to the department.
                                                                                             In November 2017,the central government has given permission to
                                                                                              upgrade 6,233 km of State Highways as National Highways
                                                                 Source: Maps of India
                                                                                            Road infrastructure in Karnataka (km)

      As per budget 2018-19, the state government is going to establish
       eight separate quality control sub-divisions for protecting the quality              Road type                                        2016-17
       of management and development of rural roads.
                                                                                            National highways                                 6,572
      Completion of construction of five roads of 300 km through KRDCL
       with the assistance of World Bank
                                                                                            State highways                                    27,163
      In May 2017, the state government revealed its plans for widening
       and redeveloping four roads on the city outskirts to bring down traffic              Major district roads                              55,515
       congestion. The Karnataka Road Development Corporation Ltd. has
       estimated the cost for improving 155Km of roads at US$ 216.42                        Municipal roads                                   8,366
       million.
                                                                                            Rural roads                                      177,542

 Source: Ministry of Road Transport & Highways, Government of Karnataka, State Budget, 2018-19

23      KARNATAKA                                                                                                  For updated information, please visit www.ibef.org
PHYSICAL INFRASTRUCTURE – RAILWAYS

      Karnataka is well connected to other parts of the country through the   Karnataka railway network
       railways. The state has a railway network of 3,250 km.

      Karnataka Rail Infrastructure Development Corporation (K-RIDE)                                                MG          NG       Total
                                                                               Type of railway          BG (km)
       has been set up with the objective of developing and implementing                                            (km)        (km)      (km)
       rail infrastructure projects in Karnataka with private sector           South Central
                                                                                                           268        0          0         268
       participation wherever feasible. K-RIDE has a chief executive officer   Railways
       deputed from the Railways Department and principal secretary,           South Western
       Infrastructure Development Department, as its chairman.                                            2,516       97         84       2,697
                                                                               Railways
      As of September 2017, 42.3 km of Karnataka’s metro network is           Southern Railways           37         0          0          37
       operational.
                                                                               Konkan Railways             248        0          0         248
      Further, the state government granted contracts for two reaches of
                                                                               Total                      3,069       97         84       3,250
       phase II, which are slated for completion by 2020.

      Commencement of Rail Coach Factory in Kolar district at a cost of       Status of major railway projects in Karnataka (2016-17)
       Rs.1,461 crore(US$225.67) wherein , 50 per cent of the cost along
       with the land would be contributed by state. An MoU for this project
                                                                               Railway project                      Status
       was signed with Ministry of Railways in 2014.
                                                                               Ramanagara-Mysuru doubling track     Commissioned for transport
      In the Union Budget 2018-19, the government has approved for the
                                                                               Bidar-Kalaburagi new railway line    Completed
       160km rail network sum of Rs. 17,000 crore (US$ 2.53 billion) for
       the growth of the Bengaluru metropolis and is expected to be            Bengaluru-Hasana railway line        Commissioned
       executed by both State and Central government in the 50:50 ratio.       Bagalakote-Kuduchi railway line
                                                                               Ginigera-Rayachuru railway line      Approved by Government of
                                                                                                                    Karnataka; amount released for
                                                                               Gadaga-Wadi railway line             land acquisition
                                                                               TumakuruRayadurga railway line

 Source: Economic Survey of Karnataka, 2017-18, State Budget 2017-18

24      KARNATAKA                                                                                For updated information, please visit www.ibef.org
PHYSICAL INFRASTRUCTURE – AIRPORTS

                                                                                Upgradation works were undertaked for Belagavi airport in 2015.
                                                                                 The upgraded Belagavi airport was inaugurated in September 2017.
                                                                                 Modernisation of the airport was done at a cost of US$ 18.67 million
                                                                                 and it now has capacity to handle over 300 passengers.

                                                                                The state has five domestic airports. These are located in
                                                                                 Bengaluru, Mangalore, Hubli, Mysore and Belgaum. International
                                                                                 flights operate from the airports at Bengaluru (Kempegowda
                                                                                 International Airport) and Mangalore (Mangalore International
                                                                                 Airport).

                                                                                Bengaluru International Airport; the country’s first greenfield
                                                                                 international airport, has been developed at Devanahalli in
                                                                                 Bengaluru as a passenger and cargo department hub. This was
      Work on planning and preparation of terminal 2 and second parallel
                                                                                 developed under PPP and started operations in May 2008.
       runway of Kempegowda International Airport has been initiated. This
       construction will enable the airport to handle around 35 million        Karnataka airport statistics (2016-17)
       passengers per year. The construction work is expected to be
       completed by September 2019.                                                            Passenger           Aircraft              Freight
                                                                                 Airport
      Further, work on development of Kalaburagi airport by PWD is                            traffic (No.)    movement (No.)          (tonnes)
       expected to be concluded by February 2018.                              Bengaluru        22,881,392          177,271             319,344
      In March the government gave ‘in principle’ approval for construction   Mangalore        1,734,810            15,405               1,242
       of an airport at Shimoga.                                               Karnataka airport statistics (2017-18)1
                                                                               Bengaluru        24,360,908          177,687             316,407
                                                                               Mangalore        2,054,005            17,813               2,326

 Note: 1From April to January 2018
 Source: AAI, Global Investors Meet, Budget 2017-18

25      KARNATAKA                                                                                For updated information, please visit www.ibef.org
PHYSICAL INFRASTRUCTURE – PORTS… (1/2)

                                                                                     Cargo handled by New Mangalore port (in ‘000 tonnes)

                                                                                   45000
                                                                                   40000

                                                                                                                                                                      42,055
                                                                                                                                                            39,940
                                                                                                                              39,365
                                                                                   35000

                                                                                                                    37,036

                                                                                                                                        36,566

                                                                                                                                                  35,590
                                                                                   30000

                                                                                                       32,941
                                                                                             31,350
        Karwar Port                                                                25000
                                                                                   20000
                                                                                   15000
                                                                                   10000
                                                                                    5000
                          New Mangalore Port                                           0
                                                                                           FY11       FY12      FY13         FY14      FY15      FY16      FY17      FY18 1

      There are 13 ports in Karnataka, of which New Mangalore is a major        Ports
       port. New Mangalore Port is the ninth major port in India with the
       deepest inner harbour on the west coast.                                    Major ports                   New Mangalore Port
      The work on development of the second stage of Karwar port has                                                Karwar
       been initiated under the concept of D-BOOST in PPP mode.                                                      Belekeri
       However, the bid document issue is under consideration by the state                                           Tadri
       government.                                                                                                   Honavar
                                                                                                                     Bhatkal
      As per budget 2017-18, in order to promote Import/Export activities in      Minor ports
                                                                                                                     Kundapur
       Karwar Port, a detailed project report will be prepared to construct an
                                                                                                                     Hangarkatta
       additional dock measuring 1508 meter for stationing 5 ships of 14
                                                                                                                     Malpe
       metres depth.
                                                                                                                     Padubidri
                                                                                                                     Old Mangalore
 Note: 1From April to February 2018
 Source: Indian Port Association

26      KARNATAKA                                                                                     For updated information, please visit www.ibef.org
PHYSICAL INFRASTRUCTURE – PORTS… (2/2)

     Cargo handled by various minor ports in Karnataka (‘000 MT)

                                                                                                                                   2017-18 (up to
     Minor Port                              2012-13           2013-14           2014-15           2015-16          2016-17
                                                                                                                                     Nov 2017)

     Old Mangalore                            165.93            120.26            115.89            98.00            121.67            25.61

     Karwar                                   441.19            377.10            525.07           714.00            582.80            349.35

     Malpe, Belekeri, Hangarkatta &
                                                4.74             3.00              2.31             3.00              3.05              0.72
     Kundapur

     Total                                    611.86            500.36            643.27           815.00            707.52            375.68

      The state government has initiated the work on development of Pavinakurve port, under PPP mode, in the district of Uttar Kannada. The draft
       concessional agreement and pre-feasibility report preparations related to the port are under process.
      Additionally, the Infrastructure Development Department (IDD) has initiated the development of Tadri sea port at a projected amount of US$
       458.29 million.

 Source: Karnataka Economic Survey 2017-18

27      KARNATAKA                                                                              For updated information, please visit www.ibef.org
PHYSICAL INFRASTRUCTURE – POWER

      As of February 2018, the state had an installed power generation                               Installed Power Capacity (GW)
       capacity of 24,612.77 MW. Out of this, central utilities contributed
       3,527.20 MW, private utilities contributed 12,182.52 MW and
                                                                                  30.0
       8,903.05 MW was under state utilities.
                                                                                  25.0
      Of the total installed power generation capacity, 9,960.82 MW was                                                                                              24.6
                                                                                  20.0
       contributed by thermal power. Capacities of 698.00 MW and                                                                                              21.3
       10,354.15 MW were contributed by nuclear & renewable power,                15.0                                                                17.3
                                                                                                                              13.9    14.0    15.1
       respectively, while hydropower contributed 3,599.80 MW.                    10.0                             12.1
                                                                                                           11.4
                                                                                           8.5     8.7
      Karnataka Renewable Energy Development Limited (KREDL) was                  5.0
       established in 1996 to promote the development of renewable energy          0.0

                                                                                            FY09

                                                                                                    FY10

                                                                                                            FY11

                                                                                                                       FY12

                                                                                                                               FY13

                                                                                                                                       FY14

                                                                                                                                               FY15

                                                                                                                                                       FY16

                                                                                                                                                               FY17

                                                                                                                                                                       FY18*
       sources in the state.

      In July 2017, commercial production started from an 800 MW unit at
       Kudgi plant of NTPC in Karnataka.
                                                                               Note: *As of February 2018
                                                                               Source: Central Electricity Authority
      As of March 2018, the installed capacity for solar power in the state
       reached 4,835.56 MW
                                                                                As per the budget 2018-19, the state government has allocated US$
                                                                                 2.18 billion for enhancement of the power sector in the state.

                                                                                The establishment work of a gas-based power plant in Yelahanka is
                                                                                 estimated to be initiated during 2016-17 by the state government.
                                                                                 Further, KPCL is expected to create a 200 MW solar power plant
                                                                                 during 2016-17.

 Source: Central Electricity Authority, News Articles

28      KARNATAKA                                                                                      For updated information, please visit www.ibef.org
PHYSICAL INFRASTRUCTURE – TELECOM

      The state government is planning to provide technology at the gram     Telecom Infrastructure (As of January 2018)
       panchayat level by providing free Wi-Fi to the youth. Moreover it
       would provide 1GB free Wi-Fi to every user with in 1sqkm of the        Wireless subscribers                                        67,277,163
       service provider.
                                                                              Wire-line subscribers                                       2,239,531
      According to Telecom Regulatory Authority of India (TRAI), there                                  (1)
       were 67.27 million wireless subscribers and 2.23 million wire-line     Internet subscribers                                        29,970,000
       subscribers in Karnataka, as of January 2018.                          Post offices
                                                                                             (2)
                                                                                                                                            9,666
      The entire state is networked through optical fibre cables (OFCs) of
                                                                              Teledensity (in %)                                            109.66
       the state-owned company, Bharat Sanchar Nigam Limited (BSNL),
       as well as private companies such as Bharti, Reliance, VSNL and
       TATA Tele Services.
                                                                              Performance status of NOFN Project (As of November 2017)
      Last mile access is provided by BSNL as well as Tata Tele Services
       in various parts of the state. Bharti and Reliance Communications
       provide the last-mile access directly to the customers in all major    No. of GPs in Phase-I                                         6,092
       cities of Karnataka.                                                                        (3)
                                                                              Pipe laid (km)                                                11,784
      By the end of January 2018, 35,273,397 subscribers had submitted
                                                                              Cable laid (km)                                               12,914
       requests for mobile number portability in Karnataka.
                                                                              GPs for which cable laid                                      6,062
      Out of the total allocated amount of US $91.65 million in Bharat Net
                                                                                              (3)
       project, BSNL invested US $61.10 million to increase the speed of      No of GPs lit                                                 4,835
       gram panchayat connectivity in Karnataka, through high-speed
       broadband and FTTH (fibre-to-the-home).

 Note: (1) As of December 2017, (2) As of March 2017, (3)As of July 2017
 Source: Telecom Regulatory Authority of India,Economic Survey of Karnataka

29      KARNATAKA                                                                                        For updated information, please visit www.ibef.org
DEVELOPMENT PROJECTS: URBAN
                  INFRASTRUCTURE… (1/2)

      Karnataka is among the top ten most urbanised states in India. The        Water supply                              Sewerage system
       state is projected to reach an urban population proportion of 50 per
                                                                                  KUWSDB has implemented                   The Bengaluru Water
       cent by 2026. Some of the key areas of development are roads and
                                                                                   surface-based drinking water supply       Supply and Sewerage
       flyovers, water supply, storm-water drainage, sewerage and urban
                                                                                   schemes in 187 urban areas to             Board (BWSSB) is
       transport.
                                                                                   provide assured safe drinking water.      responsible for providing
      The Karnataka Urban Water Supply and Drainage Board (KUWSDB)                                                          water supply, sewerage
                                                                                  KUWSDB is implementing 26
       is responsible for providing water supply & sewerage facilities in 218                                                system & sewage
                                                                                   schemes for shifting the source of
       urban areas of the state, except the areas serviced by the Bruhath                                                    disposal in the
                                                                                   water from ground water to assured
       Bengaluru Mahanagar Palike (provides services in Bengaluru city &                                                     Bengaluru Metropolitan
                                                                                   surface water. They are to be
       surrounding areas).                                                                                                   area.
                                                                                   completed by 2013.
      Karnataka has ten city corporations, 57 city municipal councils, 113                                                 42 urban areas have
                                                                                  Cauvery Water Supply Scheme
       town municipal councils, 90 town panchayats & 4 notified area                                                         been provided with
                                                                                   (CWSS) Stage IV, Phases I–IV are
       committees.                                                                                                           Underground Drainage
                                                                                   being implemented to supply 810
      As per budget 2018-19, an amount of US$ 2.66 billion has been               MLD of water to about 600,000             (UGD) facilities in the
       proposed for urban development.                                             connections.                              state.

      In August 2017, the third phase of Nagorathna scheme was
                                                                                  In December 2017, the Central Government asked NICDIT to
       launched. The objective of the scheme is to provide infrastructure in
                                                                                   expedite the process of Chennai-Bengaluru Industrial Corridor. The
       towns and cities in the state. It also aims to free the state of open
                                                                                   project is expected to boost commerce by enabling quicker
       defecation by October 2018. An amount of US$ 386.85 million has
                                                                                   movement of goods and generate investment, industrial units and
       been allocated for this phase.
                                                                                   employment.
      As of March 2017, Nabard is planning to help the state with
                                                                                  Moreover, the state government finished 42.3-km network of Metro
       technologies at a low cost, for conservation and efficient use of water
                                                                                   Rail under phase-1 of the Metro Rail project and two lines have been
       in the drought-affected districts, with the help of modern technologies
                                                                                   made operational.
       such as water management practices, micro irrigation (more crop per
       drop) & adopting improved packages of agronomic practices.
 Source: JNNURM, Ministry of Urban Development

30      KARNATAKA                                                                                  For updated information, please visit www.ibef.org
DEVELOPMENT PROJECTS: URBAN
                  INFRASTRUCTURE … (2/2)

     Development projects under Directorate of Municipal Administration:

      Construction of 22,133 houses (DUs) at a cost of US$ 85.37 million under Rajeev Awas Yojana will be completed by the authority during 2017-18.

      Infrastructure works for drinking water supply scheme for citizens for small and medium towns will be started during 2017-18 at a cost US$ 447.95
       million.

      Under “Housing for all”, construction of 60,000 houses at a cost of US$ 405.42 million will be implemented through urban local bodies and Rajeev
       Gandhi Rural Housing Corporation during 2017-18.

      During 2017-18, it is targeted to construct 0.33 million personal toilets, 9,104 capacity community toilets, 4,522 capacity public toilets under Solid
       Waste Management Scheme.

      As per Budget 2017-18, master plans will be prepared for all of the 274 urban local bodies of the state.

      To mitigate the scarcity of drinking water in Mangalore, a desalination plant will be established with public-private-participation (PPP).

      During 2018-19 , to encourage increased cycle distribution schemes and commuting by pedestrians, Government of Karnataka is planning to
       develop cycling infrastructure in tier-2 cities at a cost of Rs.25 crore (US$3.86 million).

 Source: : Budget 2017-18

31      KARNATAKA                                                                                       For updated information, please visit www.ibef.org
DEVELOPMENT PROJECTS: KEY PUBLIC-PRIVATE
                   PARTNERSHIP (PPP) PROJECTS … (1/2)

     Under construction PPP projects - Karnataka

     Project name                                                           Sector                 Status             Total cost (US$ million)

     Road Upgradation (Karnataka) Project                                  Transport          Under construction               108.66

     Setting up of mechanized iron ore handling facilities at deep
                                                                           Transport          Under construction               45.97
     draft multi-purpose berth of NMPT

     Six laning of Belgaum - Dharwad Section Road                          Transport          Under construction               79.63
     Sports City cum International Convention Centre cum Star        Social and commercial
                                                                                              Under construction               149.3
     Hotel cum Shopping Complex cum Residential Complex                  infrastructure
     Airport (Hassan) Project                                              Transport          Under construction               497.68

     Waste to Energy Project Mandur                                    Water sanitation       Under construction                9.95

     Bus Terminal-cum-Commercial complex at Puttur                         Transport          Under construction                1.21

     Water Supply Scheme (Mysore)                                      Water sanitation       Under construction               32.27

                                                                     Social and commercial
     Construction and Maintenance of Public Toilets in Bengaluru                              Under construction                1.99
                                                                         infrastructure

     Water Supply Scheme (Nanjangud)                                   Water sanitation       Under construction                4.74

 Source: Department of Economic Affairs, Government of India

32      KARNATAKA                                                                            For updated information, please visit www.ibef.org
DEVELOPMENT PROJECTS: KEY PUBLIC-PRIVATE
                   PARTNERSHIP (PPP) PROJECTS … (2/2)

     PPP Projects – Karnataka

     Project name                                                     Sector                 Status             Total cost (US$ million)
     Development of integrated solid Waste Treatment (100
                                                                 Water sanitation       Under construction                0.85
     TPD) and Landfill Facilities at Belgaum
     Development of International Convention Centre at         Social and commercial
                                                                                        Under construction               174.19
     Devanahalli                                                   infrastructure

     Integrated Disposal Facility (Mysore)                       Water sanitation       Under construction                4.62

     Integrated Municipal solid waste treatment Kannahalli       Water sanitation       Under construction                4.15

     Integrated Municipal solid waste treatment Mavalipura       Water sanitation       Under construction                6.64

     Karnataka Urban Water Sector Improvement Project            Water sanitation       Under construction               11.61

     Kudgi TPS Transmission Line Project                              Energy            Under construction               223.95

                                                               Social and commercial
     Malleshwaram Market - Re-development                                               Under construction                21.9
                                                                   infrastructure
                                                               Social and commercial
     New Puttanna Theatre and Parking                                                   Under construction               41.85
                                                                   infrastructure
     Road Upgradation (Goa/Karnataka Border-Kundapur)
                                                                     Transport          Under construction               437.79
     Project

     Road Upgradation (Hoskote-Dobespet) Project                     Transport          Under construction               191.27

 Source: Department of Economic Affairs, Government of India

33      KARNATAKA                                                                      For updated information, please visit www.ibef.org
DEVELOPMENT PROJECTS: SEZs AND INDUSTRIAL
                  CLUSTERS … (1/4)

      The state has 26 operational, 51 notified SEZs and 62 formally          Sector-wise Operational SEZs In Karnataka (as of
       approved SEZs as of December 2017. The Karnataka Industrial                            December 2017)
       Areas Development Board has developed 141 industrial areas
       spread across the state. The state plans to develop and upgrade                                      IT/ITeS
       eight clusters around Bengaluru with an investment of US$ 348.4
       million in coming years.                                                                             Biotechnology
      The Karnataka State Industrial & Infrastructure Development
       Corporation has promoted more than 135 start-up ventures in the                                      Hi-tech Engineering Products
                                                                                                            and related services
       state through equity participation and has provided debt to core              4%4%
                                                                                   4%
                                                                                 4%                         Electronics Hardware and
       industries such as steel, cement, mining and textiles, as well as new
                                                                                4%                          Software/ITES
       sectors such as IT, aerospace and telecom.                              4%
                                                                                                            Aerospace and Industry
      In October 2017, the government approved the setting up of a new        4%
                                                                               3%
       industrial park in Harohalli. The proposed multi-product industrial                                  Pharmaceuticals
                                                                                                69%
       park will be built by Karnataka Industrial Areas Development Board
       (KIADB) on an area of about 904.86 hectares. The park is expected                                    Textile
       to entail an investment of US$ 242.8 million and generate more than
       23,500 jobs.                                                                                         Multi Product

      Karnataka is the first in the country to provide bespoke policy
                                                                                                            Precision Engineering Product
       ecosystem for automobile sector .The state has introduced a
       comprehensive and well-designed Electric Vehicle and Energy
       Storage Policy.

 Source: : Department of Commerce, Ministry of Commerce & Industry

34      KARNATAKA                                                                       For updated information, please visit www.ibef.org
DEVELOPMENT PROJECTS: SEZs AND INDUSTRIAL
                  CLUSTERS … (2/4)

     Some of the operational SEZs in Karnataka

     Name/Developer                                                         Location                                      Primary industry

     Biocon Special Economic Zone                              Anekal Taluk, Bangalore, Karnataka                           Biotechnology

     Shyamaraju and Company (India)
                                                                 Kundalahalli Village, Karnataka                       IT/ITES enabled services
     Pvt. Ltd.
     Manyata Embassy Business park SEZ                                Bangalore, Karnataka                                     IT/ITeS
                                                                  Varthur Hubli, Electronic City,
     Wipro Limited (Electronic City)                                                                                              IT
                                                                      Banglore, Karnataka
                                                                  Varthur Hobli, Sarjapur Road,
     Wipro Limited (Sarjapur)                                                                                                     IT
                                                                           Karnataka

     Vrindavan Tech Villages SEZ                              Devarabeesanahalli Village, Karnataka                            IT/ITeS

     RMZ Ecoworld Infrastructure Pvt.
                                                                 Devarabeesanahalli, Karnataka                                 IT/ITeS
     Ltd.
                                                                               Varthur
     Cessna Business Park Pvt. Ltd.                                                                                            IT/ITeS
                                                                Hobli, District Banglore, Karnataka

     Tanglin Development Ltd.                               Pattengere/Mylasandra Villages, Karnataka                          IT/ITeS

     Infosys Technologies Limited                      Hebbal Industrial area, District Mysore, Karnataka                      IT/ITES

 Source: Department of Industries and Commerce, Karnataka

35      KARNATAKA                                                                                       For updated information, please visit www.ibef.org
DEVELOPMENT PROJECTS: SEZs AND INDUSTRIAL
                   CLUSTERS … (3/4)

     Some of the operational SEZs in Karnataka

     Name/Developer                                                        Location                                      Primary industry

     Information Technology Park                            Sadaramangala and Pattandur Agrahara
                                                                                                                              IT/ITeS
     Limited                                                 Village, District Bangalore, Karnataka

     Karnataka Industrial Area Development Board
                                                               Village Perumenahally, Karnataka                                Textile
     (KIADB)

                                                            Hebbal Industrial area, District Mysore,
     Infosys Technologies Limited                                                                                             IT/ITeS
                                                                         Karnataka
     HCL Technologies Ltd.                                           Bangalore Karnataka                                      IT/ITeS
     Pritech park Sez (Primal Projects Ltd)                          Bangalore Karnataka                                      IT/ITeS
     Karnataka Industrial Area Development Board
                                                                  District Hassan, Karnataka                              Pharmaceuticals
     (KIADB)

     Aspen Infrastructures Limited (formerly Synefra
                                                                                                              Hi-tech engineering, products and related
     Engineering construction Ltd. (Suzlon                          Udupi Taluk, Karnataka
                                                                                                                              services
     Infrastrucutre Ltd.)

     Karle Infra Pvt. Ltd.                                           Bangalore Karnataka                                      IT/ITeS
     Mangalore Special Economic Zone                                 Bangalore Karnataka                                    Multi product

     Bagmane Construction Pvt. Ltd                          K R Puram, Bangalore North, Karnataka                             IT/ITES

     Bagmane Construction Pvt. Ltd                          K R Puram, Bangalore North, Karnataka                             IT/ITES

 Source: Department of Industries and Commerce, Karnataka

36      KARNATAKA                                                                                      For updated information, please visit www.ibef.org
DEVELOPMENT PROJECTS: SEZs AND INDUSTRIAL
                  CLUSTERS … (4/4)

     Some of the operational SEZs in Karnataka

     Name/Developer                                                          Location                                    Primary industry

                                                                                                                       Precision engineering
     Quest special Economic Zone                                     Belgaum district, Karnataka
                                                                                                                             Products

     Gopalan Enterprises (India) Private Limited.                      Bengaluru, Karnataka                                   IT/ITES

     Karnataka State Electronics Development
                                                                    District Shimoga, Karnataka               Electronics Hardware and Software/ ITES
     Corporation Limited (KEONICS)

     Larsen & Toubro Limited                                          District Mysore,Karnataka                               IT/ITeS

     Karnataka Industrial Areas Development Board                      Bengaluru, Karnataka                           Aerospace and industry

                                                            Village Chokkanahalli, Taluka Yelahanka Hobli
     Milestone Buildcon Private Limited                                                                                       IT/ITES
                                                                     Bangalore North, Karnataka

 Source: Department of Industries and Commerce, Karnataka

37      KARNATAKA                                                                                      For updated information, please visit www.ibef.org
SOCIAL INFRASTRUCTURE – EDUCATION … (1/2)

      The state has a literacy rate of 75.6 per cent, the male literacy rate is   Literacy rates (%)
       82.8 per cent and the female literacy rate is 68.1 per cent.
                                                                                   Literacy rate                                       75.6
      In terms of the number of universities, Karnataka ranks fifth among
       all Indian states and union territories, with 44 universities. Of these,    Male literacy                                       82.5
       24 are state public universities and 11 are private deemed
                                                                                   Female literacy                                     68.1
       universities.

      The state has 4,519 pre-university colleges to impart general
       education. There are more than 1 million students in the                    Educational infrastructure (2017-18)
       pre-university colleges.

      There are 293 polytechnics and 206 engineering colleges to provide          Institute type                           Number            Enrolments
       technical education in the state.                                           Medical colleges                            53               6,786
      For the development of basic facilities such as – laboratory, library,
                                                                                   Ayurvedic colleges                          72               4,675
       new buildings, toilets, drinking water facility in government schools
       and colleges, an amount worth US$ 18.25 million would be provided.          Homoeopathic colleges                       11                950

      Under Shikshakara Shikshana scheme, DSERT, DIETs and CTE                    Unani colleges                              5                 290
       would be upgraded. Under this scheme, Shaikshanika Adhalath and
                                                                                   Naturopathy & Yogic Sciences
       TESS education centers would be opened in the offices of BEOs,                                                          5                 420
                                                                                   (BNYS)
       DIETs, DDPIs and CTEs in the state.
                                                                                   Dental colleges                             38               2,719

                                                                                   Pharmacy colleges                           61               4,784

                                                                                   Nursing colleges                           294              17,369

 Source: Economic Survey of Karnataka 2017-18 Census 2011

38      KARNATAKA                                                                                       For updated information, please visit www.ibef.org
SOCIAL INFRASTRUCTURE – EDUCATION … (2/2)

      As per economic survey 2016-17, the state participation in primary    Karnataka education statistics (2016-17)
       education is significant as 81.23 per cent of the lower primary and
       63.40 per cent of the higher primary schools are managed by                                                 Lower primary: 26,696
                                                                             Number of schools                     Higher primary: 35,498
       Department of Education.
                                                                                                                   Secondary schools: 15,773
      As per Budget 2018-19, an amount of US$ 697.25 million has been
                                                                                                                   Lower primary: 1.03
       proposed for higher education.                                        School dropout rate (in %)
                                                                                                                   Higher primary: 2.30
      In November 2017, foundation stone for a new government medical                                             Average: 23.18:1
       college was laid in Bengaluru. The cost of the project is pegged at   Pupil-teacher ratio                   Private Aided schools: 55.48:1
       US$ 31.11 million and the college is expected to be functional from                                         Unaided schools: 31.61:1
       2018 itself.

      Karnataka is home to several premier institutions:

        •   Indian Statistical Institute.

        •   Indian Institute of Science.

        •   Indian Institute of Management.

        •   National Law School of India University.

        •   Institute for Social and Economic Change.

        •   University of Agricultural Sciences, Bengaluru.

        •   Kannada University, Hampi.

 Source: Economic Survey of Karnataka 2017-18

39      KARNATAKA                                                                                  For updated information, please visit www.ibef.org
SOCIAL INFRASTRUCTURE – HEALTH... (1/2)

      In February 2018, the state government announced Universal Health                     Health indicators (2016)
       Coverage (UHC) scheme which aims to bring all government health
       schemes under one roof . The objective is to bring the entire population              Birth rate                                                    17.6
       of state under this scheme without any cap on the medical expenditure
                                                                                             Death rate                                                      6.7
       on the patient.
      The policy of the Government is to establish 1 primary health centre for              Infant mortality rate                                           24
       every 30,000 inhabitants, 1 dispensary for every 15,000–20,000
                                                                                             Natural Growth Rate                                           10.9
       inhabitants & 1 sub-centre for every 5,000 inhabitants.
      As of February 9, 2018, the state has 12,695 active health institutions
                                                                                             Life expectancy at birth (years)
       out of total 13,121 health institutions in the state.
      Under the assistance of National Health Mission, at a cost of US$ 8.09                Male (2015)                                                   63.6
       million, trauma centres will be established across 5 places, under the
       scheme of Aapathbandhava for offering emergency treatment to                          Female (2015)                                                 67.1
       highway accident victims.
      In June 2017, the state government announced an initiative to install RO              No of institutions                      Total Facilities (February 2018) 3
       systems in 147 taluk & 20 district hospitals across the state. The plants             Subcenters                                               9,589
       will be jointly set up by the state health & rural development and
       panchayat raj departments. An amount of US$ 1.49 million has been                     Community health centres                                  317
       allocated for the project.
                                                                                             Primary health centres                                   2,633
      In December 2017, the state government initiated a digital
       transformation drive by ensuring complete use of electronic medical                   Sub district hospital                                     539
       records (EMR) which is a single documentation that contains complete                  District hospital                                          43
       and accurate information of a patient. The initiative is expected to enable
       seamless flow of information for better healthcare delivery and co-                   Total institutions                                      13,121
       ordination.

 Source: Economic Survey of Karnataka 2015-16,Ministry of Health & Family Welfare Sample Registration System (SRS) Bulletin Sep, 2014 , 1Per thousand persons,2Per thousand live
 births, 3As of 9th February 2018

40      KARNATAKA                                                                                                    For updated information, please visit www.ibef.org
SOCIAL INFRASTRUCTURE – HEALTH ... (2/2)

      Various other programmes to be included under the National Health Mission during 2017-18 include:

        •   Establishment of dialysis centres in 114 taluks of the state.

        •   Establishment of Intensive Care Units having 3 bedded capacity with ventilator facility in all taluk hospitals to provide treatment in cases having
            respiratory problem, serious illness and accidents

        •   Commencement of DNB post graduate course in government colleges.

        •   Establishment of Ayush Treatment Centres in all taluk hospitals to provide integrated, comprehensive health service.

      As per Budget 2017-18, RO+UV drinking water facility will be provided in all district hospitals, taluk hospitals and community health centres.

      Under National Free Diagnosis Programme, free diagnosis facility will be provided in all Government hospitals.

      Blood Transfusion Units will be established in 10 district hospitals of Bagalkot, Vijayapura, Chamarajnagar, Chickmagaluru, Chitradurga, Haveri,
       Kodagu, Kolar, Tumkuru and Uttara Kannada at a cost of US$ 0.93 million.

      Integrated Ayush Hospitals having 50 beds will be established in Chitradurga and Chickmagaluru District hospitals at a total cost of US$ 0.93
       million.

 Source: Economic Survey of Karnataka 2015-16,Ministry of Health & Family Welfare Sample Registration System (SRS) Bulletin Sep, 2014 , 1Per thousand persons,2Per thousand live
 births

41      KARNATAKA                                                                                                   For updated information, please visit www.ibef.org
CULTURAL INFRASTRUCTURE

      There are several sports complexes in Bengaluru, Mysore, Mangalore & other cities. Cricket, hockey & football are the major sports, although
       other games are also popular. The main sports arenas are the M. Chinnaswamy Stadium & the Sree Kanteerava Stadium in Bengaluru,
       Chamundi Vihar Stadium in Mysore & the Mangala Stadium in Mangalore. The Bengaluru Golf Course & the Karnataka Golf Association are
       well-known golf courses in the state.

      Karnataka is also home to numerous convention centres used for exhibitions, both indoor & outdoor, such as Palace Grounds & the Bengaluru
       International Exhibition Centre.

      Under the Rural Tourism Project, Anegundi, Kokkare Bellur, Attivari Bird Sanctuary, Gokarna & Kodagu have been developed. Schemes are
       being prepared to develop rural tourism at other places also to showcase the rural life, art & culture and heritage.

      Ranga Shankara & Karnataka Chitrakala Parishath form the cultural nexus of Bengaluru & are the performing spaces for dance, music & theatre
       artists. An international mega convention centre, with a seating capacity of 6,000, is being planned near the Bengaluru International Airport.

      To conserve and popularize the Bayalata artform, a separate Bayalata Academy will be established in North Karnataka.

      The monuments of Srirangapatna & Hoysalas along with the monuments and forts of Deccan Sultanate have been registered in the provisional list
       of World Heritage sites during 2015-16.

      As per the budget 2017-18, US$ 3.104 million will be provided to organize World Kannada Conference to commemorate 60 years of unification of
       Karnataka State.

      Also, complete literary works of Sri M.M. Kalaburgi will be published through Fa.Gu. Halakatti Research Centre of Vijayapura.

      Indian tennis star Rohan Bopanna was honoured by the state government on winning the maiden Grand Slam title of his 14 year career at the
       French Open in June 2017, becoming the 4th Indian to win a Grand Slam title.

      In 2017-18, US$ 65.8 million has been allocated to Kannada and culture department.

42      KARNATAKA                                                                                   For updated information, please visit www.ibef.org
You can also read