Regulation of snow-fed rivers affects flow regimes more than climate change
←
→
Page content transcription
If your browser does not render page correctly, please read the page content below
ARTICLE
DOI: 10.1038/s41467-017-00092-8               OPEN

Regulation of snow-fed rivers affects flow regimes
more than climate change
B. Arheimer        1,   C. Donnelly      1   & G. Lindström1

River flow is mainly controlled by climate, physiography and regulations, but their relative
importance over large landmasses is poorly understood. Here we show from computational
modelling that hydropower regulation is a key driver of flow regime change in snow-
dominated regions and is more important than future climate changes. This implies that
climate adaptation needs to include regulation schemes. The natural river regime in snowy
regions has low flow when snow is stored and a pronounced peak flow when snow is melting.
Global warming and hydropower regulation change this temporal pattern similarly, causing
less difference in river flow between seasons. We conclude that in snow-fed rivers globally,
the future climate change impact on flow regime is minor compared to regulation
downstream of large reservoirs, and of similar magnitude over large landmasses. Our study
not only highlights the impact of hydropower production but also that river regulation could
be turned into a measure for climate adaptation to maintain biodiversity on floodplains under
climate change.

1 SwedishMeteorological and Hydrological Institute (SMHI), 60176 Norrköping, Sweden. Correspondence and requests for materials should be addressed to
B.A. (email: berit.arheimer@smhi.se)

NATURE COMMUNICATIONS | 8: 62      | DOI: 10.1038/s41467-017-00092-8 | www.nature.com/naturecommunications                                         1
ARTICLE                                                                       NATURE COMMUNICATIONS | DOI: 10.1038/s41467-017-00092-8

T
       oday’s global society is dependent on water resources for         natural variability. Previous studies comparing climate change
       sustainable development1, but water security is under             and regulations have therefore been limited to single reservoirs or
       severe threat from combined pressures; human actions              rivers25, 26. In this study, on the contrary, we calculated the effects
have become the main driver of global environmental change2, 3.          on river regimes from hydropower regulation and climate change
This calls for better understanding of the cause and effect              over a large landmass.
relationships and co-evolution between water resources and                  Here, by using a detailed numerical modelling approach,
humans4–6. We may soon be approaching the planet’s boundaries            we systematically quantify and compare hydropower impact
for global freshwater use7 and there is empirical evidence               with the effects of climate change across multiple rivers, from
for ongoing intensification of the water cycle due to climate             sources to the sea. We conclude that at the large scale and
change8, 9. For parts of the globe, however, direct human impacts        for floodplains in snow-dominated regions globally, hydropower
on the water cycle still exceed impacts from global warming10, 11.       regulations and climate change have about the same effect on
   A large part of the Earth’s land surface receives precipitation       flow regimes. Downstream of large reservoirs, however,
in the form of snow. During the cold part of the year in high            hydropower regulations affect flow regimes much more than
latitudes or high altitudes, the water is stored as snow and ice,        climate change. Overall, flow regulation should thus be key in
which fully or partly melts during the spring. The seasonality in        adaptation measures for a sustainable future of snow-fed
flow from such snow-fed rivers is therefore characterised by low          rivers and deserves much more attention by policy makers and
flow during the winter followed by a high spring peak flood event.         climate-impact scientists. Our findings show that climate-change
The hydromorphology, ecosystems and societies along flood-                impact on flow regime is relevant in floodplains, which experi-
plains, lakes and shorelines in these regions have evolved over          ence less impact from hydropower regulation (being further
time to benefit from these flow dynamics. Examples are migratory           downstream from reservoirs). In line with the findings, we might
fish, ecosystems and cultivation practices, which have evolved to         need to reconsider the relative importance of on-going global
benefit from the natural spring flood.                                     changes and adjust adaptation measures and research
   Several studies of climate-change impacts on rivers show that         accordingly.
the annual peak flood event may be less distinct and even
disappear in some snow-dominated areas12, 13 as global warming
will decrease snow fall14 and/or the snow storage period by              Results
the end of this century15. More precipitation falling as rain in         Hydropower regulation vs. climate change impact. In a detailed
snow-dominated regions and shorter freezing periods will thus            reconstruction of natural flow regimes across Sweden, we found
give less differences in river flow between seasons. Hydropower           that current hydropower production has a significant impact on
production can have the same effect on the flow regime. During            the seasonal distribution of flow, not only locally but also at the
spring, the river water is stored in dams and reservoirs often to be     national scale (Fig. 1a). The flow peak (mean annual maximum
released throughout the year whenever electricity is needed most.        flow) was found to be reduced by 15% and the seasonal
Thus, the high flow of the snowmelt season is dampened                    redistribution of total river flow to the sea amounts to 19% for an
and redistributed to other times of the year. It is known that the       average year. This number includes runoff from the whole
main drivers of change in river-flood regime include river                country (also unregulated rivers) and is caused by the storage of
channel engineering, land use and climate change16 but there are         snowmelt in reservoirs, especially in the mountains. The flow
knowledge gaps about their relative importance17 and for                 duration curve also shifts towards smaller differences between
upscaling to large domains18. Therefore, sufficient information on        high and low flow for regulated conditions27. The rivers
disturbance of flow regime is often missing in present assessments        of Sweden have been exploited for large-scale hydropower
on ecological status for adaptation measures19, 20.                      productions since the early 20th century. The development of
   More than 20 years ago it was noted that 77% of the river             hydropower production capacity was a major contribution to
discharge from the northern part of the world is affected by             the industrialisation of Sweden and amounts today to half of
fragmentation of the river channels by dams and water regula-            the electricity supply for the country, as well as an additional
tion21. It is recognised that this water regulation has severe effects   value in terms of meeting energy-demand peaks. There are ~1800
on ecosystems and societies close to the reservoirs, for instance        hydropower plants in Sweden, of which some 200 produce
due to dry river channels, flow obstacles, changed flow patterns           >10 MW, providing 94% of the total hydropower production.
and short-term fluctuations of water level22–24. However, the             The total annual production varies from 50 to 75 TWh due to
accumulated effect on large-scale flow regime further downstream          variability in the annual water inflows, with an average of
remains unknown as it is difficult to measure and separate from           65 TWh/year.

                          a                                              b
                                        Hydropower regulation                              Climate change impact
                           m3/s                                            m3/s
                         16,000                                          16,000
                                                  Naturalised flow                                  End of 20th century
                         12,000                                          12,000                         End of 21st century
                                                     Regulated flow
                           8,000                                          8,000

                           4,000                                          4,000

                               0                                               0
                                   J F M A M J J A S O N D                          J F M A M J J A S O N D

Fig. 1 Impact from hydropower and climate change on river-flow regime for entire Sweden. Seasonal distribution of total river runoff from Sweden
(450,000 km2), with and without impact of: a extensive hydropower regulation, and b projected climate change (using a climate-model ensemble of
18 members, where the mean is bold). Smoothed 30-yr means of daily values are shown. The climate impact modelling was based on CMIP5 projections
for the representative concentration pathways (RCP) 4.5 and 8.5 from: CanESM2, CNRM-CM5, GFDL-ESM2M, EC-EARTH, IPSL-CM5A-MR, MIROC5,
MPI-EMS-LR, NorESM1-M, HadGEM2-ES. Each ensemble member was downscaled using RCA62 and bias adjusted using DBS63

2                                            NATURE COMMUNICATIONS | 8: 62         | DOI: 10.1038/s41467-017-00092-8 | www.nature.com/naturecommunications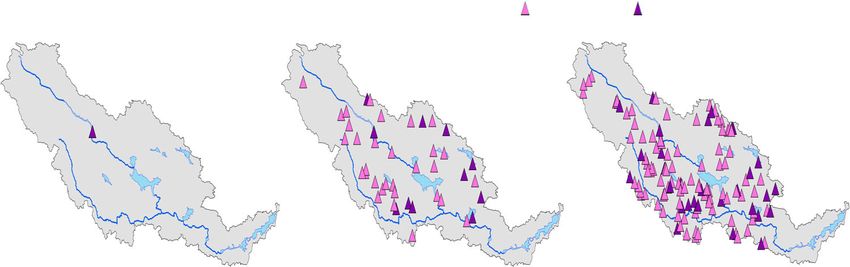
NATURE COMMUNICATIONS | DOI: 10.1038/s41467-017-00092-8 ARTICLE
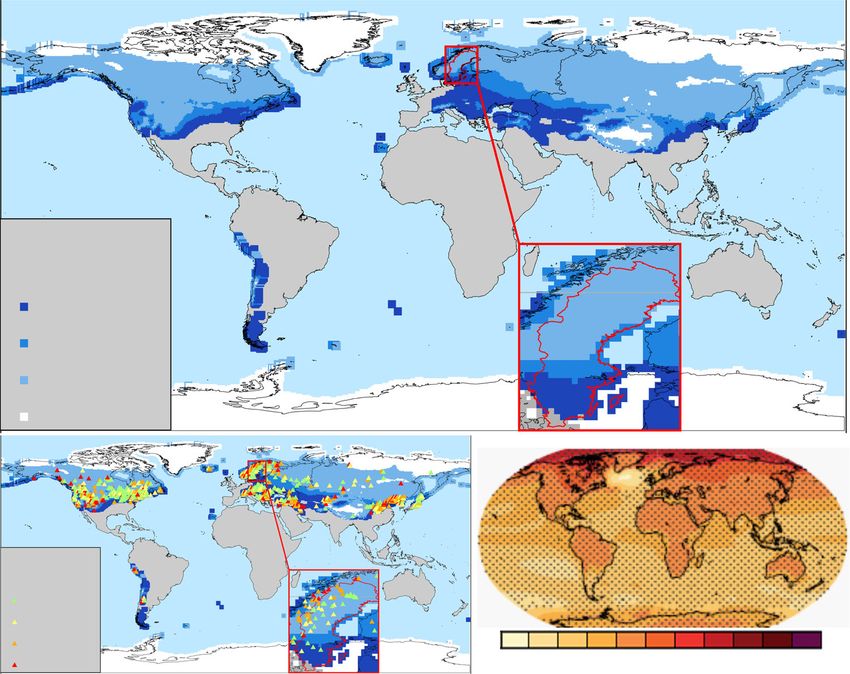
a
Snow fraction
< 10 %
10 to 20 %
20 to 30 %
30 to 60 %
> 60 %
b c
Local degree
of regulation
0.0–0.3
0.3–1.0
1.0–3.0
> 3.0 0 0.5 1 1.5 2 3 4 5 7 9 11 °C
Fig. 2 Regions with similarities in snow, hydropower regulation and temperature change. Global regions with: a snow fraction in precipitation, b the degree
of regulation in hydropower dams for these regions, and c global warming at RCP4.5 according to IPCC, Fig. 12.1131. Details are highlighted for Sweden
A surprisingly similar pattern of change is found when hydropower and temperature change (Fig. 2). We assume similar
projecting climate change impact for the same geographical water management for the snow-dominated parts of the world
domain (Fig. 1b), using a climate model ensemble with because hydropower production is favourable and there
18 members (including RCPs of 4.5 and 8.5). By the end of the are similarities in climate, hydrology and energy demand.
century (2069–2098), 19% of the total river flow is again Snowmelt is stored in hydropower reservoirs, to be released at
seasonally redistributed by a changed climate, due to less snow other times of the year. The snow-dominated part include
storage and more precipitation falling as rain. However, the flow mountains, which have the best energy potential for hydropower
peak is reduced by only 5% due to global warming, which gives (most precipitation and head) where the snow storage thus
a combined total effect for surface runoff (both regulated and contains a lot of accumulated energy. We found the fraction of
non-regulated rivers) of flow peak reduction of at most 20%, if precipitation falling as snow to be indicative of flow regime
the hydropower dams are operated similarly in the future as changes due to hydropower (see Methods section). The country
they are today. of Sweden (450,000 km2) in Northern Europe, represents regions
Additional changes to the flow regime resulting from climate with 10–60% of the precipitation falling as snow. Globally, we
change are that the spring peak starts about 1 month earlier found that a large part of the Earth’s land surface also has 10–60%
and there will be about 10% more discharge on an annual basis. of precipitation falls as snow (Fig. 2a). Hence, the river regime in
These trends have been documented in previous studies of these areas is controlled by snowmelt as in Sweden. In these
Sweden28–30 and this shift in timing of the snow peak due to snow-dominated regions of the world, the river flow is regulated
temperature rise seems coherent across the globe12, 13, 31. by some 2200 major hydropower reservoirs36 (Fig. 2b) according
However, the increase in annual flow cannot be extrapolated to to global data, while the actual regulation (including small dams)
all snow-dominated regions. These changes are caused by more may be much higher. Sweden has an average or below average
precipitation in total over Sweden, but also vary spatially degree of regulation (i.e., altered capacity to store the water
within Sweden with some areas getting dryer30, 32. For parts of runoff, see Methods section). Most of Northern USA, Canada,
the snow-dominated regions, changes to the water balance may Europe and some isolated areas of the Asian continent have
thus result in less river flows, which some authors attribute to similar degrees of regulation as Sweden.
increase in evapotranspiration33, 34. It should be noted that the Regarding climate change, the largest temperature rises are
projected climate changes in temperature, governing evapotran- expected in the Northern hemisphere (Fig. 2c). The temperature
spiration and timing of snowmelt, are much more robust than the in snow-dominated regions is projected to rise by 2–4 °C by the
predictions of future precipitation (including snowfall35), which end of the century, assuming stabilising green-house gas
are uncertain and show large variability in space and time. emissions (RCP = 4.5)37. The projected temperature increases in
Sweden are similar to the projected average temperature rises for
other snow-dominated regions according to IPCC. In accordance
Global regions of snow and hydropower. The changes observed with previous findings, we assume that increasing temperatures
in Sweden are also significant on a global scale, for landmasses are more important than precipitation changes for snowpack
where river-flow generation is controlled by snowmelt, seasonality in a changing climate38. In summary, the conclusions
NATURE COMMUNICATIONS | 8: 62 | DOI: 10.1038/s41467-017-00092-8 | www.nature.com/naturecommunications 3
ARTICLE NATURE COMMUNICATIONS | DOI: 10.1038/s41467-017-00092-8
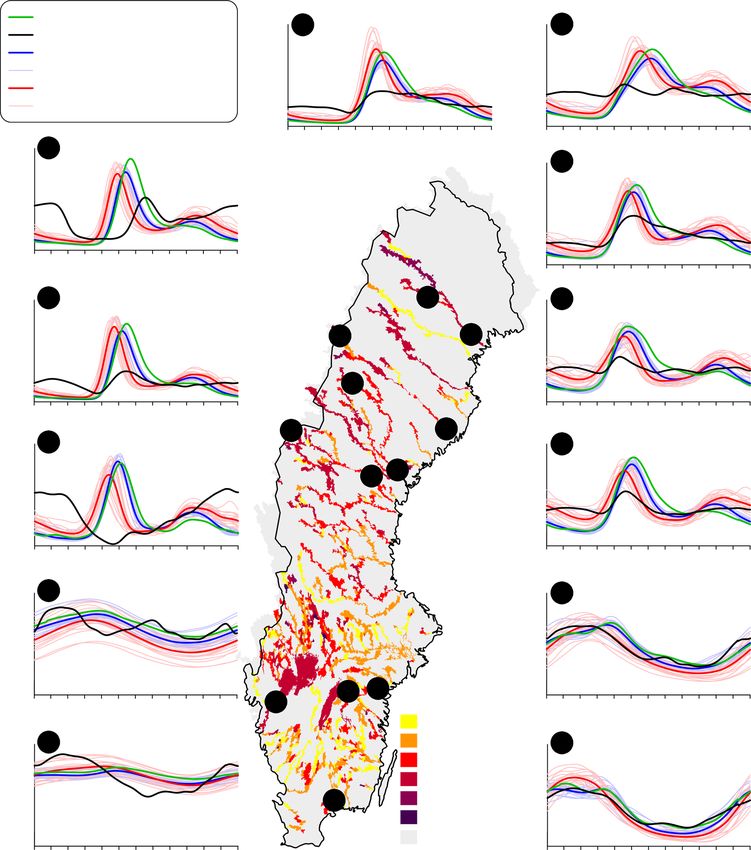
m3/s m3/s
Naturalised flow (obs climate) Lilla
800 1 1,600 2
Regulated flow (obs climate) Luleälven Luleälven
Ensemble mean (1981–2010) 600 1,200
18 ensembles (1981–2010) 400 800
Ensemble mean (2069–2098)
18 ensembles (2069–2098) 200 400
0 0
m3/s Upper Umeälven J F M A M J J A S O N D m3/s J F M A M J J A S O N D
80 3
1,600 4
60 Umeälven
1,200
40
800
20
400
0
J F M A M J J A S O N D 0
m3/s m3/s J F M A M J J A S O N D
250 5 Upper 1 1,600 6 Ångerman
200 Ångermanälven -älven
1,200
150 3 2
800
100
50 400
5
0 0
J F M A M J J A S O N D J F M A M J J A S O N D
3 3
m /s 7 4 m /s
160 7 Upper 1,200 8 Indals-
Indalsälven älven
120
8 6
800
80
400
40
0 0
J F M A M J J A S O N D J F M A M J J A S O N D
3 3
m /s m /s
9 Upper Motala ström
60 200 10
(L. Vättern) Motala ström
160
40
120
80
20
40
0 9 10 0
11 Regulation (%)
J F M A M J J A S O N D
J F M A M J J A S O N D
m3/s 1–10
Göta älv m3/s
800 11 11–25 80 12
(L. Vänern)
26–50 Mörrumsån
600 60
51–100
400 12 101–150 40
200 151–300 20
Unregulated
0 0
J F M A M J J A S O N D J F M A M J J A S O N D
Fig. 3 Spatial variability of impact from regulation and climate change on local flow regime. Seasonal flow regimes in 12 regulated Swedish Rivers under
present conditions (black line) and under naturalised conditions with observed climate (green) or projections from climate models (blue and red). Smoothed
daily mean values are shown for 30-yr period and the sites have an average regulation degree of 48% (range 25–75%). The map shows the calculated
accumulated degree of hydropower regulation in Swedish rivers. The climate impact modelling was based on CMIP5 projections for the RCP 4.5 and 8.5
from: CanESM2, CNRM-CM5, GFDL-ESM2M, EC-EARTH, IPSL-CM5A-MR, MIROC5, MPI-EMS-LR, NorESM1-M, HadGEM2-ES. Each ensemble member
was downscaled using RCA62 and bias adjusted using DBS63
from the detailed modelling of Sweden are deemed representative completely by regulation (Fig. 3) and these rivers are associated
for regions of snow and hydropower globally, when comparing with dry reaches and time-spells without any river flow, also at
changes of the natural flow regime caused by global warming and the time of the snowmelt (e.g., site No. 7 in Fig. 3). The river
river regulation, respectively. response to regulation shows similarities and dissimilarities across
the country and can be categorised into four distinct regions,
as follows.
Spatial variability and site-specific changes. In the more detailed The first region is the rivers in the mountains (northwest),
analysis, we found that the effects of hydropower regulation which show most radically changed flow patterns with
on flow regimes vary spatially and that this spatial variation can some completely reversed regimes, e.g. the Upper Indalsälven
be linked to the main processes controlling river flow in different River (no. 7 in Fig. 3). These reservoirs have relatively small
regions. At the local scale, the snowmelt peak vanishes often drainage areas and often regulation degrees of more than 100%,
4 NATURE COMMUNICATIONS | 8: 62 | DOI: 10.1038/s41467-017-00092-8 | www.nature.com/naturecommunicationsNATURE COMMUNICATIONS | DOI: 10.1038/s41467-017-00092-8 ARTICLE
Reservoirs with local degree of regulation: 0 – 30 % 30 – 100 %
Global data (GranD) National data (S-HYPE) Local data (water board)
Regulated lakes/reservoirs: 1 Regulated lakes/reservoirs: 42 Regulated lakes/reservoirs: 125
Regulate volume: 880 Mm3 Regulated volume: 2,468 Mm3 Regulated volume: 2,739 Mm3
Degree of regulation: 7.6 % Degree of regulation: 21.3 % Degree of regulation: 23.5 %
Fig. 4 Information of hydropower regulation in Dalälven River using different data sources
which means that more than a year’s discharge can be stored on the hydrological impact of reservoirs exist on the global
and released according to energy demand. The natural peak flow scale11, 42, 43, because the degree of regulation is normally not well
from snowmelt has disappeared completely as regulation controls documented in a transparent way and local water management
basically all river flow. remains unknown, especially in open national and global
The second region is the area downstream of the mountains at databases. Hence, there is currently a knowledge gap in under-
the floodplains near the outlet to the sea (east and southwest) standing the impact of this factor on large-scale river flow and in
where the rivers show less radical changes in flow regime, as there scientific analysis on global change. For instance, when
is a contribution also from unregulated discharge with natural going from the global database GranD36 to the national database
peak flow. One exception is Luleälven River (No. 2 in Fig. 3), of S-HYPE44 for Dalälven River in Sweden, the number of
which has a total regulation degree of 67% at the outlet and an regulated lakes and reservoirs shifted from 1 to 42, which
almost constant river flow over the year. increased the degree of regulation by a factor of three (Fig. 4). An
The third region includes large lakes (No. 9 and 11 in Fig. 3), even more detailed local database further raised the degree of
encompassing the largest and 6th largest lakes in the EU. The regulation from 21 to 23% when including many small
lakes control the flow by naturally damping and storing much of constructions. The implications of this are that regulations are
the peak flow from snowmelt. A more variable flow regime has neglected in most large-scale assessments of climate change
thus been introduced by regulation of these large lakes, which impacts on water resources45–47, or that reservoir alterations
normally would show rather constant flow. are simulated with constant outflows11, 48, which are not
The fourth region is the southern plains with an annual snow representative for dynamics of hydropower regulation. More
fraction of only 10–20%, which show less pronounced snow peaks attention must thus be put on documenting and sharing
also under natural unregulated conditions30. The regulation of information on reservoir regulation and including these processes
rivers here is mainly linked to natural lakes, which already control in large-scale modelling studies, to better judge their relative
and dampen the seasonal flow peaks (No. 10 and 12 in Fig. 3). impacts on water security in a global change context.
The seasonal change in river flow from both climate change and
regulation is thus low in this region. Discussion
This example of spatial analysis in Sweden helps us to identify Our findings clearly demonstrate that the common assumption of
the regions that are more or less influenced by climate change and pristine hydrological conditions leads to wrong conclusions
hydropower regulations, respectively. Such mapping can help regarding on-going global changes and the impacts on large-scale
decision makers to allocate measures for climate adaptation river flow. We therefore show the benefits from using dynamic
where they would be most effective. Climate adaptation should be models that integrate both climate variability and detailed
targeted to where it can make a difference, and for instance reservoir regulation. Climate change is not the main driver
floodplains are identified as areas retaining relatively high but regulations have significant control of river regime in snow-
ecological status in a European perspective, worth protecting20. dominated regions, not only locally but also at the landmass scale.
Hydropower regulation could be used in these areas for artificial The ignorance among climate and hydrological scientists
flooding of floodplains to secure biodiversity in a future climate. is because the degree of regulation is normally not well
The spatial mapping also identifies rivers where there are documented, kept secret or considered difficult to simulate.
other potentials for improvements, for instance through more Neglecting or underestimating the degree of regulation will
collaborative regulation strategies or rules to use the water unconditionally lead to wrong conclusions when analysing
resource for many purposes, including biodiversity aspects. Thus, global-change impact on large-scale river flow. Our results thus
different adaptation strategies in different rivers or river reaches imply that scientists should be very careful when estimating
will help us to better design the measures needed for sustainable changes to future river flow regimes until regulation can be
development. properly addressed in the analysis. We thus urge for more
complete and open global databases on flow regulation, and water
The degree of regulation is often unknown. We have shown that management for integrated and detailed modelling at the global
hydropower regulation radically changes the river regime for the scale. New techniques using satellites and crowd sourcing could
whole surface of Sweden and conclude that similar effects are also be helpful here.
likely in other snow-dominated parts of the world, which is in Among fresh-water ecologists, on the other hand, the impacts
line with reports from regulated and snow-fed rivers on of severe changes in river regime from regulations are
other continents39–41. Only few and not very detailed assessments well documented23, 49, 50 and widely discussed also in a climate-
NATURE COMMUNICATIONS | 8: 62 | DOI: 10.1038/s41467-017-00092-8 | www.nature.com/naturecommunications 5ARTICLE NATURE COMMUNICATIONS | DOI: 10.1038/s41467-017-00092-8
Table 1 Model skills in predicting hydropower regulation
River Hydropower plant (dam) Recharge area Upstream lakes Flow regulation (%) NSE QR NSE QN NSE ΔQ
(km2) (%)
Luleälven Seitevare 2,250 7 85 0.29 0.64 0.69
Luleälven Boden 24,924 9 67 0.07 0.88 0.76
Umeälven Stornorrfors 26,568 8 25 0.82 0.93 0.73
Ǻngermanälven Sollefteå 30,638 9 37 0.70 0.91 0.86
Indalsälven Hammarforsen 23,842 10 39 0.63 0.90 0.84
Motalaström Motala 6,384 35 65 0.31 0.71 0.14
Motalaström Holmen 15,384 21 41 0.79 0.89 0.09
Göta älv Vargön 46,886 19 74 0.70 0.91 0.46
Average 0.54 0.85 0.57
Median 0.66 0.90 0.71
S-HYPE model performance estimated by the NSE60 criteria at eight hydropower plants, using daily values for river flow including regulation (QR) tested against observations; for naturalised conditions
(QN) tested against independent reconstruction; and for the hydropower impact (ΔQ) tested against observations combined with independent reconstructions. (From Arheimer and Lindström, 2014.)
change context19, 51, 52. Ecosystems in regulated rivers are respectively, and forced the model with meteorological variables from a 4-km
considered more vulnerable to climate change43, 53 but also more grid, either based on optimal interpolation of observations59 or an ensemble of
downscaled climate projections (from http://www.cordex.org/). In both cases,
favourable for adaptation measures as flow regimes can be we used daily values for the reference period 1981–2010 to evaluate effects of
manipulated25, 54. Our detailed mapping of flow regulations for a change. The total effect of redistribution of flow between seasons was calculated by
large landmass indicate that the radical change from natural flow comparing 30 years averages for each day between naturalised flow for the
regime in mountains would be difficult to restore. We therefore reference period with 30 years averages for each day during river regulation and
recommend more attention to downstream areas and floodplains climate change conditions, respectively.
S-HYPE44 is a national multi-basin model system for Sweden that covers more
that receive water flow also from unregulated parts of the river than 450,000 km2 and produces daily values of hydrological variables in 37,000
network. In these areas, we found that climate change will have catchments from 1961 onwards. The spatial resolution is on average 10 km2 and it
about the same impact as hydropower regulations. Hence, climate covers the Swedish landmass, including transboundary river basins with Norway
change will have more severe consequences on present status of and Finland. The model is used operationally for water management and the
national warning service for floods and droughts. Most catchments are ungauged,
biodiversity in floodplains, and it might be worth to introduce but observations are available in 400 sites for model evaluation of daily water
artificial flooding for climate adaptation in these regions. The discharge and 86% of the river flow from land to the sea is monitored. A number of
regulations could thus help in climate adaptation, but there may model-performance criteria are estimated in each site, e.g., Nash and Sutcliffe
be high costs for energy loss and melt-water must still be available efficiency (NSE)60 and relative error. The latest S-HYPE version (2012) has on
average daily NSE = 0.83 for 222 stations with ≤ 5% regulation and an average
in sufficient amounts from snow storage. relative volume error of ±5% for the period 1999–2008. For all gauging sites
The hydropower sector is also subject to future change. It is not with both regulated and unregulated rivers, the mean monthly NSE = 0.80.
yet known how climate change will impact the regulation Average NSE includes catchments ranging from a few to several tens of thousands
schemes for power production, as timing of both water supply of km2 and various land-uses across the country. The S-HYPE model provides
different kinds of water information and open data to Swedish water
and energy demand changes. With lower spring flows, reservoirs authorities and the public, free to download from the web site: http://vattenwebb/.
may need less storage capacity and would thus affect natural flows The model system is also used in scenario simulations to describe changed
less. On the other hand, electricity demand may also change over conditions.
time and reservoir storage may be used to balance out fluctua- The method to predict regulated flow (QR) made use of current approach to
tions in other renewable power sources, such as wind and solar. model regulation in S-HYPE. The model set-up includes 509 regulated lakes and
reservoirs, and 23 man-made river diversions leading water over catchment
Despite its side effects, hydropower is referred to as a clean and borders. Each regulated reservoir or group of reservoirs is treated separately, with
renewable energy source, which is favoured over fossil fuels. The individual storage volumes as input data. The model simulates the alteration of
growth in new hydropower projects has currently moved to river flow in a conceptual way by water storage from spring and summer to
countries with emerging economies55. This might be challenging hydropower production during autumn and winter. The seasonal production
pattern is estimated individually from observations of discharge and water levels.
as water governance require collaborations among multiple This was done explicitly for some 50 gauged dams, and group-wise for some
partners to ensure domestic, industrial, agricultural or environ- 400 lakes and reservoirs upstream of river gauges. Some small dams are modelled
mental uses10, 56, 57. In Sweden, collaboration has developed over by using a general regulation routine27 with the following function: (i) when the
the decades between various hydropower companies along the water level is low production is reduced, (ii) at moderate water levels the outflow
only depends on the time of the year, (iii) when a dam is nearly full, discharge
rivers, to better harmonise regulation schemes and improve occurs through the spillways. The spillway flow is modelled by a rating curve,
interactions with government authorities. This is a good role which is calibrated separately using the same observations as when estimating the
model; however, it should also be recognised that some countries seasonal production.
may not have the economic, legal or political capacity to imple- When evaluating the method for predicting impact from hydropower
production, the routine of flow regulation in S-HYPE resulted in monthly average
ment such governance. The global community will then be crucial NSE = 0.69 for the 176 gauges with >5% degree of regulation. Reservoir regulation
to support the UN Paris Agreement and the UN sustainable is often very variable on a daily basis, and therefore, monthly NSE is relevant for
development goals. judging model performance for flow regime.
The Method to predict non-regulated and naturalised flow (QN) made use
of current approach to model lakes in S-HYPE. The model set-up has 9082
Methods non-regulated lakes explicitly modelled at sub-basin outlets. Lake routing is
Simulating change in river flow. The impacts of change in flow regime caused by modelled by establishing rating curves from observed discharge and lake-water
hydropower regulation and climate change, respectively, were estimated using the levels. These are either explicitly determined from observations (from various time-
Hydrological Predictions for the Environment (HYPE)58 numerical model. periods) in individual lakes, calibrated group-wise using downstream gauges or for
The HYPE model is a process-oriented integrated catchment model, which is regions, or by using a general rating curve61. When simulating non-regulated
continuously released in new versions for open access at http://hypecode.smhi.se/. conditions, assumptions about such natural rating curves for original lake outlets
This model has been applied at the large scale for several parts of the globe must be made for sites with lake regulation today. For 30 major reservoirs, we
(http://hypeweb.smhi.se/) and the set-up for Sweden is called S-HYPE44. We established a specific rating curve to describe naturalised flow based on
used dynamic model routines to predict river regulation and naturalised flow, measurements of water discharge and lake level fluctuations, either by observations
6 NATURE COMMUNICATIONS | 8: 62 | DOI: 10.1038/s41467-017-00092-8 | www.nature.com/naturecommunicationsNATURE COMMUNICATIONS | DOI: 10.1038/s41467-017-00092-8 ARTICLE
m3/s regardless of precipitation changes. The same findings have been observed for
a) Interpolated observation Sweden28–30 and other regions worldwide12, 13, 31.
16,000
The second assumption implies that the snowmelt during spring is stored in the
b) Mean of climate- hydropower reservoirs to be released at other times of the year. This was guided by
12,000 model ensemble hydrological interpretation of similarities in observed flow signatures at continental
scale (using 1366 river gauges), showing that all snow-dominated regions had clear
8,000 influence of hydropower regulation in most hydrographs64. Following, we did an
empirical study using observations from major reservoirs across Europe,
4,000 representing a wider range of dam types, operations and climate than in Sweden
and giving an indication of a possible global relationship. We compared seasonality
in observed outflow at dams outlets with the seasonality of simulated inflows, using
0 a pan-European hydrological model (E-HYPE v2.1)65. For each dam, we quantified
J F M A M J J A S O N D the month of peak natural inflows and the month of peak regulated outflows. The
difference reflects the impact of the dam on natural flow regime.
Fig. 5 Flow regime of the reference period when using observations or We then compared the change in peak flow month with a number of factors
climate data. Daily average values of unregulated river flow from land to including mean winter temperature, dam capacity, dam capacity compared to
sea for the period 1981–2010, from the S-HYPE model, a using the national inflows, the dam’s regulation volume compared to inflows, and the fraction of
4 km meteorological grid based on observations, and b for the mean of the precipitation falling as snow (snow fraction). The only significant relationship
was found between change in peak flow month and snow fraction and (R2 = 0.19,
18 members in the climate model ensemble p = 0.001). We found no significant relationship for any of the other variables.
Snow fraction was thus found to be an indicator of hydropower regulation with
prior to regulations or by using reconstructions made by hydropower companies, seasonal redistribution of flow.
which are currently used for legal justifications in the water court. For the 476 Snow-dominated regions were identified worldwide by calculating the average
remaining lakes, we used the equations for the spillways from regulated conditions. snow fraction for the period 1981–2010 from a global rain and snow data set. The
Naturalised flow was then modelled by using these new rating curves and removing WFDEI data set66 based on the WATCH Forcing Data methodology applied to
all regulation storages and man-made diversions in the model. Three man-made ERA-Interim reanalysis data was used, at a resolution of 0.5 degree. The
lakes were removed completely and replaced with forest on till soil. information of spatial patterns of projected global temperature rise by the end of
The daily effect (ΔQ) of hydropower regulation on river flow was calculated as the century was taken from Chapter 12 of The Physical Science Basis. Contribution
(Eq. 1): of Working Group I to the Fifth Assessment Report of the Intergovernmental Panel
on Climate Change37.
ΔQðt Þ ¼ QRðt Þ QNðt Þ ð1Þ Global information of hydropower regulation was collected from the Global
reservoir and dams’ database, GranD36. This data set collates data on reservoirs
with a capacity >0.1 km3, which includes more than 6000 reservoirs worldwide
The HYPE modelling of naturalised flow was evaluated against more detailed with a combined capacity of 6200 km3. To determine the large-scale degree of
independent reconstructions based on observed water levels for eight reservoirs regulation we used the global composite runoff field in GranD (called GCRF),
across Sweden (Table 1). All stations showed NSE >0.7, except the highly regulated which combines observed discharge with climate-driven runoff estimates to get a
Seitevare, which has a rather small drainage basin and 85% flow regulation with composite runoff field consistent with observations. The local degree of regulation
intense short-term fluctuations. We explicitly tested the model predictability of at each dam (Dreg) was calculated by dividing the dam capacity with the mean
hydropower impact, by studying the effect itself in the HYPE-model compared to annual inflows to the dam Vrunoff. This gives an indication of the dam’s capacity to
observations vs. reconstruction, there was normally a good agreement with a store the runoff generated over a year, i.e., if Dreg > 1, the dam can hold all runoff
median NSE = 0.71. The performance was related to degree of regulation and generated within 1 year, and if Dreg = 0.5 the dam can hold half of the runoff
upstream lake area. The sites with high flow regulation showed low NSE values and generated within 1 year. The local degree of regulation at each dam was used
poor skills were also noted at the outlet of Lake Vättern (Motala), which is a very instead of the accumulated degree of regulation per river as the connectivity
large lake compared to the drainage basin that feeds the river. The dampening of between dams on the same river basin was not available in open global databases.
the hydrograph, higher influence of evaporation, and long-term fluctuations in lake
water make it more difficult to reach a high NSE at the outlet. In addition, the
outflow of Lake Vättern is more affected by short-term regulation than by seasonal Data availability. The data that support the findings of this study are available in
re-distribution of the flow. In addition to statistical criteria, the model Zenodo with the identifiers ‘doi.org/10.5281/zenodo.581145’67 for hydropower
performance for various sites was also evaluated by plotting flow duration impact modelling and ‘doi.org/10.5281/zenodo.581186’68 for climate
curves and time-series27. impact modelling. Original climate projections are available in ESGF at
When modelling climate change impact, we used a state-of-the art modelling http://www.cordex.org/. River flow observations and catchment delineation for
chain to assess the climate change impact in hydrology. The S-HYPE model was Sweden are available at http://vattenwebb.smhi.se/. The HYPE model code is open
forced with transient time-series from downscaled and bias-corrected output from source and available for inspection and free download at http://hypecode.smhi.se/.
an ensemble of climate models for the period 1961–2100. To estimate climate
change impact, the river flow at the end of the century (2068–2098) was compared
with a reference period (1981–2010) for each ensemble member. We used CMIP5 Received: 6 December 2016 Accepted: 30 May 2017
projections for the representative concentration pathways (RCP) 4.5 and 8.5,
respectively, from the following nine Global Circulation Models (GCM):
CanESM2, CNRM-CM5, GFDL-ESM2M, EC-EARTH, IPSL-CM5A-MR,
MIROC5, MPI-EMS-LR, NorESM1-M, HadGEM2-ES. Each of the GCMs was
dynamically downscaled from 1000 to 50 km by the RCA model62 version 4, as part
of the CORDEX initiative (http://www.cordex.org/) and thereafter statistically
downscaled and bias-corrected to the national 4 km meteorological grid based on References
observations59 using the distributed based scaling (DBS) method63. 1. United Nations. Transforming our world: the 2030 agenda for sustainable
In total, the impact from 18 climate projections were then simulated by using development https://sustainabledevelopment.un.org/content/documents/
the unregulated version of S-HYPE to create an ensemble of projected river flows. 21252030%20Agenda%20for%20Sustainable%20Development%20web.pdf
The total flow from land to sea was compiled as well as river flow from selected (2015)
rivers with less regulation. The results were quality assured by comparing results 2. Crutzen, P. J. Geology of mankind. Nature 415, 23–23 (2002).
with previous estimates of climate change impact in Sweden. The S-HYPE results 3. Steffen, W., Crutzen, P. J. & McNeill, J. R. The Anthropocene: are humans now
for unregulated flow for the reference period (1981–2010) were not identical when overwhelming the great forces of Nature? Ambio 36, 614–621 (2007).
comparing the model forced by observations with the mean of forcing from 4. Wagener, T. et al. The future of hydrology—an evolving science for a changing
climate models (Fig. 5). This was because the the bias correction was done for world. Water Resour. Res. 46, W05301 (2010).
the period 1961–1990, which allowes the climate signal to differ between models 5. Sivapalan, M., Savenije, H. H. G. & Blöschl, G. Socio-hydrology: a new science
(and to observations) from 1990 and onwards. of people and water. Hydrol. Process 26, 1270–1276 (2012).
6. Montanari, A. et al. Panta Rhei—everything flows: change in hydrology and
Identifying global regions of relevance. When discussing the relevance of our society—The IAHS scientific decade 2013–2022. Hydrological Sciences Journal
results to global scale, we assume robustness in links between changes in climate, 58, 1256–1275 (2013).
snow fraction and peak flow, as well as between snow fraction and reservoir 7. Rockström et al. A safe operating space for humanity. Nature. 461, 472–475
management. For the first, previous studies at the global scale38 shows that (2009).
warming is more important than precipitation changes for snowpack seasonality; 8. Huntington, T. G. Evidence for intensification of the global water cycle: review
strong decrease in winter snow accumulation and spring snowmelt was projected and synthesis. J. Hydrol. 319, 83–95 (2006).
NATURE COMMUNICATIONS | 8: 62 | DOI: 10.1038/s41467-017-00092-8 | www.nature.com/naturecommunications 7ARTICLE NATURE COMMUNICATIONS | DOI: 10.1038/s41467-017-00092-8
9. Berg, P., Moseley, C. & Haerter, J. O. Strong increase in convective precipitation Intergovernmental Panel on Climate Change (eds Stocker, T. F. et al.)
in response to higher temperatures. Nat. Geosci. 6, 181–185 (2013). (Cambridge University Press, 2013)
10. Grafton, R. Q. et al. Global insights into water resources, climate change and 38. Adam, J. C., Hamlet, A. F. & Lettenmaier, D. P. Implications of global climate
governance. Nat. Clim. Change 3, 315–321 (2013). change for snowmelt hydrology in the twenty‐first century. Hydrol. Proc. 23,
11. Haddeland et al. Global water resources affected by human interventions and 962–972 (2009).
climate change. Proc. Natl. Acad. Sci. 111, 3251–3256 (2014). 39. FitzHugh, T. W. & Vogel, R. M. The impact of dams on flood flows in the
12. Molini, A., Katul, G. G. & Porporato, A. Maximum discharge from snowmelt in United States. River Res. Appl. 27, 1192–1215 (2011).
a changing climate. Geophys. Res. Lett. 38, L05402 (2011). 40. Zhang, Y. et al. Classification of flow regimes for environmental flow
13. Godsey, S. E., Kirchner, J. W. & Tague, C. L. Effects of changes in winter assessment in regulated rivers: the Huai River basin, China. River Res. Appl. 28,
snowpacks on summer low flows: case studies in the Sierra Nevada, California, 989–1005 (2012).
USA. Hydrol. Process. 28, 5048–5064 (2013). 41. Rheinheimer, D. E. et al. Simulating high elevation hydropower with regional
14. Krasting, J. P., Broccoli, A. J., Dixon, K. & Lanzante, J. Future changes in climate warming in the west slope, Sierra Nevada. J. Water Resour. Plan.
northern hemisphere snowfall. J. Clim. 26, 7813–7828 (2013). Manage. 140, 714–723 (2014).
15. Barnett, T. P., Adam, J. C. & Lettenmaier, D. P. Potential impacts of a warming 42. Vörösmarty, C. J. et al. The storage and aging of continental runoff in large
climate on water availability in snow-dominated regions. Nature 438, 303–309 reservoir systems of the world. Ambio 26, 210–219 (1997).
(2005). 43. Nilsson, C., Reidy, C. A., Dynesius, M. & Revenga, C. Fragmentation
16. Merz, B., Vorogushyn, S., Uhlemann, S., Delgado, J. & Hundecha, Y. More and flow regulation of the world’s large river systems. Science 308, 405–408
efforts and scientific rigour are needed to attribute trends in flood time series. (2005).
Hydrol. Earth Syst. Sci. 16, 1379–1387 (2012). 44. Strömqvist, J., Arheimer, B., Dahné, J., Donnelly, C. & Lindström, G. Water and
17. Hall, J. et al. Understanding flood regime changes in Europe: a state of the art nutrient predictions in ungauged basins—set-up and evaluation of a model at
assessment. Hydrol. Earth Syst. Sci. 18, 2735–2772 (2014). the national scale. Hydrol. Sci. J. 57, 229–247 (2012).
18. Blöschl, G. et al. At what scales do climate variability and land cover 45. Eisner, S. et al. An ensemble analysis of climate change impacts on
change impact on flooding and low flows? Hydrol. Process. 21, 1241–1247 streamflow seasonality across 11 large river basins. Clim. Change 141, 401–417
(2007). (2017).
19. Heino, J., Virkkala, R. & Toivonen, H. Climate change and freshwater 46. Donnelly, C., Dahne, J. & Yang, W. River discharge to the Baltic sea in a future
biodiversity: detected patterns, future trends and adaptations in northern climate. Clim. Change 122, 157–170 (2014).
regions. Biol. Rev. 84, 39–54 (2009). 47. Hagemann, S. et al. Climate change impact on available water resources
20. Grizzetti, B. et al. Human pressures and ecological status of European rivers. obtained using multiple global climate and hydrology models. Earth Syst. Dyn.
Sci. Rep. 7, 205 (2017). 4, 129–144 (2013).
21. Dysenius, M. & Nilsson, C. Fragmentation and flow regulation of river systems 48. Fekete, B. M. et al. Millennium ecosystem assessment scenario drivers
in the northern third of the world. Science 266, 753–762 (1994). (1970–2050): climate and hydrological alterations. Glob. Biogeochem. Cycles 24,
22. Andersson, E., Nilsson, C. & Johansson, M. E. Effects of river fragmentation GB0A12 (2010).
on plant dispersal and riparian flora. Regul. Rivers Res. Manage. 16, 83–89 49. Poff, N. L. et al. The natural flow regime—a paradigm for river conservation
(2000). and restoration. Bioscience 47, 11 (1997).
23. Bunn, S. E. & Arthington., A. H. Basic principles and ecological consequences 50. Jager, H. I. & Smith, B. T. Sustainable reservoir operations: can we generate
of altered flow regimes for aquatic biodiversity. Environ. Manage. 30, 492–507 hydropower and preserve ecosystem values? River Res. Appl. 24, 340–352
(2008).
(2002).
51. Arthington, A. H., Naiman, R. J., McClain, M. E. & Nilsson, C. Preserving the
24. Leira, M. & Cantonati, M. Effects of water-level fluctuations on lakes: an
biodiversity and ecological services of rivers: new challenges and research
annotated bibliography. Hydrobiologia 613, 171–184 (2008).
opportunities. Freshw. Biol. 55, 1–16 (2010).
25. Rheinheimer, D. E. & Viers, J. H. Combined effects of reservoir operations and
52. Wenger, S. J. et al. Flow regime, temperature, and biotic interactions drive
climate warming on the flow regime of hydropower bypass reaches of
differential declines of trout species under climate change. Proc. Natl. Acad. Sci.
California’s Sierra Nevada. River Res. Appl. 31, 269–279 (2015).
USA 108, 14175–14180 (2011).
26. Ashraf, F. B., Haghighi, A. T., Marttila, H. & Kløve, B. Assessing impacts of
53. Palmer, M. A. et al. Climate change and the world’s river basins: anticipating
climate change and river regulation on flow regimes in cold climate: a study of a
management options. Front. Ecol. Environ. 6, 81–89 (2008).
pristine and a regulated river in the sub-arctic setting of Northern Europe.
54. Lytle, D. A. & Poff, N. L. Adaptation to natural flow regimes. Trends Ecol. Evol.
J. Hydrol. 542, 410–422 (2016).
19, 94–100 (2004).
27. Arheimer, B. & Lindström, G. Electricity vs. ecosystems—understanding and
55. Pittock, J. Viewpoint—better management of hydropower in an era of climate
predicting hydropower impact on Swedish river flow. Proc. Int. Assoc. Hydrol. change. Water Altern. 3, 444–452 (2010).
Sci. 364, 313–319 (2014). 56. Falkenmark, M. & Molden, D. Wake up to realities of river basin closure. Water
28. Bergström, S. et al. Climate change impacts on runoff in Sweden — assessments Resour. Dev. 24, 201–215 (2008).
by global climate models, dynamical downscaling and hydrological modelling. 57. Palmer, M. A. et al. Climate change and river ecosystems: protection and
Clim. Res. 16, 101–112 (2001). adaptation options. Environ. Manage. 44, 1053–1068 (2009).
29. Andréasson, J., Bergström, S., Carlsson, B., Graham, L. P. & Lindström, G. 58. Lindström, G., Pers, C. P., Rosberg, R., Strömqvist, J. & Arheimer, B.
Hydrological change—climate change impact simulations for Sweden. Ambio. Development and test of the HYPE (hydrological predictions for the
33, 228–234 (2004). environment) model—a water quality model for different spatial scales. Hydrol.
30. Arheimer, B. & Lindström, G. Climate impact on floods: changes in high flows Res. 41, 295–319 (2010).
in Sweden in the past and the future (1911–2100). Hydrol. Earth Syst. Sci. 19, 59. Johansson, B. Estimation of areal precipitation for hydrological modelling in
771–784 (2015). Sweden. PhD Thesis, Earth Sciences Centre, Dept Phys. Geog., Göteborg
31. Stewart, I. T., Cayan, D. R. & Dettinger, M. D. Changes toward earlier University (2002).
streamflow timing across western North America. J. Clim. 18, 1136–1155 60. Nash, J. E. & Sutcliffe, J. V. River flow forecasting through conceptual models.
(2005). Part I. A discussion of principles. J. Hydrol. 10, 282–290 (1970).
32. Bergström, S., Andréasson, J. & Graham L. P. Climate adaptation of the 61. Lindström, G. Lake water levels for calibration of the S-HYPE model. Hydrol.
Swedish guidelines for design floods for dams. Proceedings of ICold 24th Res. 47, 672–682 (2016).
Congress Kyoto 2012, Q94 (International Commission on large dams (ICold), 62. Samuelsson, P. et al. The rossby centre regional climate model RCA3: model
2012). description and performance. Tellus A 63, 4–23 (2011).
33. Barnett, T. P. et al. Human-induced changes in the hydrology of the western 63. Yang, W. et al. Distribution based scaling to improve usability of regional
US. Science 319, 1080–1083 (2008). climate model projections for hydrological climate change impacts studies.
34. Berghuijs, W. R., Woods, R. A. & Hrachowitz, M. A precipitation shift from Hydrol. Res. 41, 211–229 (2010).
snow towards rain leads to a decrease in streamflow. Nat. Clim. Change 4, 64. Kuentz, A., Arheimer, B., Hundecha, Y., & Wagener, T. Understanding
583–586 (2014). hydrologic variability across Europe through catchment classification. Hydrol.
35. O’Gorman, P. A. Contrasting responses of mean and extreme snowfall to Earth Syst. Sci. 21, 2863–2879 (2017).
climate change. Nature 512, 416–418 (2014). 65. Donnelly, C., Andersson, J. C. M. & Arheimer, B. Using flow signatures and
36. Lehner, B. et al. High-resolution mapping of the world’s reservoirs and catchment similarities to evaluate a multi-basin model (E-HYPE) across
dams for sustainable river-flow management. Front. Ecol. Environ. 9, 494–502 Europe. Hydrol. Sci. J. 61, 255–273 (2016).
(2011). 66. Weedon, G. P. et al. The WFDEI meteorological forcing data set: WATCH
37. Collins, M. et al. in Climate Change 2013: the Physical Science Basis. forcing data methodology applied to ERA-Interim reanalysis data. Water
Contribution of Working Group I to the Fifth Assessment Report of the Resour. Res. 50, 7505–7514 (2014).
8 NATURE COMMUNICATIONS | 8: 62 | DOI: 10.1038/s41467-017-00092-8 | www.nature.com/naturecommunicationsNATURE COMMUNICATIONS | DOI: 10.1038/s41467-017-00092-8 ARTICLE
67. Arheimer, B. Climate impact_River flow_Sweden (Zenodo, 2017) Additional information
68. Arheimer, B. Hydropower impact_river flow_Sweden (Zenodo, 2017) Supplementary Information accompanies this paper at doi:10.1038/s41467-017-00092-8.
Competing interests: The authors declare no competing financial interests.
Acknowledgements
The study was performed within the EU FP7-funded project SWITCH-ON Reprints and permission information is available online at http://npg.nature.com/
(grant agreement 603587), which explores the untapped potential of Open Data to tackle reprintsandpermissions/
changes in the Hydrosphere. Modelling of climate-change impact in Sweden was funded
by the Knowledge Center for Climate Change Adaptation at SMHI and we would like to Publisher's note: Springer Nature remains neutral with regard to jurisdictional claims in
acknowledge contributions from Elin Sjöqvist and Jenny Axén-Mårtensson at SMHI for published maps and institutional affiliations.
this part. Modelling of the hydropower influence was funded by the Swedish Agency for
Marine and Water Management (HaV) and we would like to acknowledge valuable data Open Access This article is licensed under a Creative Commons
of Dalälven River from Niclas Hjerdt, SMHI. The investigation was performed at the Attribution 4.0 International License, which permits use, sharing,
SMHI Hydrological Research unit, where much work benefits from joint efforts in adaptation, distribution and reproduction in any medium or format, as long as you give
developing models and concepts by the whole team. The scientific findings will
appropriate credit to the original author(s) and the source, provide a link to the Creative
contribute to the decadal research initiative “Panta Rhei—changes in hydrology and
Commons license, and indicate if changes were made. The images or other third party
society” by the International Association of Hydrological Sciences (IAHS).
material in this article are included in the article’s Creative Commons license, unless
indicated otherwise in a credit line to the material. If material is not included in the
article’s Creative Commons license and your intended use is not permitted by statutory
Author contributions regulation or exceeds the permitted use, you will need to obtain permission directly from
B.A. contributed with the idea, the overall study design, result analysis, figures and the copyright holder. To view a copy of this license, visit http://creativecommons.org/
writing the manuscript; C.D. contributed with identifying global regions of relevance, licenses/by/4.0/.
Fig. 2, and commenting on the manuscript; G.L. contributed with computational
calculations, developing the S-HYPE model to represent regulated and unregulated
conditions, compilation of model output, figures and commenting on the manuscript. © The Author(s) 2017
NATURE COMMUNICATIONS | 8: 62 | DOI: 10.1038/s41467-017-00092-8 | www.nature.com/naturecommunications 9You can also read