STATES OF JERSEY REPORT ON THE REVISED FORECAST OF STATES INCOME FOR SPRING 2021 - STATES GREFFE
←
→
Page content transcription
If your browser does not render page correctly, please read the page content below
STATES OF JERSEY

REPORT ON THE REVISED FORECAST
OF STATES INCOME FOR SPRING 2021

 Presented to the States on 21st September 2021
 by the Minister for Treasury and Resources

 STATES GREFFE

2021 R.151

Income Forecasting
Group
Report on the revised forecast of
States income from taxation and duties
for Spring 2021
Contents
1. Executive Summary ....................................................................................................... 2

2. Uncertainties around the forecast ............................................................................... 3

3. Base case economic assumptions .............................................................................. 4

4. Summary of forecasts ................................................................................................... 5

5. IFG central forecast for Spring 2021 ............................................................................ 7

6. Range of forecast .......................................................................................................... 9

Appendix A – Personal income tax forecast .................................................................... 10

Appendix B – Corporate income tax forecast .................................................................. 35

Appendix C – GST forecast ................................................................................................ 42

Appendix D – Impôts forecast ........................................................................................... 49

Appendix E – Stamp duty forecast .................................................................................... 54

Appendix F – Other income forecast ................................................................................ 59

Appendix G – Terms of reference ..................................................................................... 67
IFG income forecast Spring 2021

1. Executive Summary
 1.1. The Income Forecasting Group (IFG) has increased each year of the forecast when
 compared to the autumn 2020 forecast.1 In total, the forecast for general tax revenue in
 2021 has increased by £77.6m, or 9.8%. Over half of this increase is due to improvements in
 the forecast for income tax.

Figure 1 – Year 2021 forecast variation compared to autumn 2020

 Year 2021 £77.6m Forecast variation compared to
 autumn 2020 £'000
 Other Income,
 £5,570 , 7%
 Impots,
 £5,666 , 7%

 Stamp Duty,
 £12,291 , 16%
 Income Tax,
 £41,000 , 53%

 GST, £13,090 ,
 17%

 1.2. The IFG’s forecast has been informed by the updated economic forecast2 produced by the
 independent Fiscal Policy Panel (FPP) in April 2021. The updated forecast suggests a more
 gradual economic recovery than previously, however this is against a backdrop of
 considerable uncertainty.

 1.3. The IFG has considered 2020 data outturn compared to the adjustments made to the
 autumn 2020 forecast in respect of anticipated Covid-19 restrictions. These have been
 reviewed with further individual adjustments made for the Spring 2021 forecast. These are
 detailed in each of the respective component reports appended.

1
 IFG Autumn 2020 Forecast (R.114-2020) https://statesassembly.gov.je/assemblyreports/2020/r.114-2020.pdf
2
 FPP Economic Assumptions
https://www.gov.je/SiteCollectionDocuments/Government%20and%20administration/ID%20FPP%20economi
c%20assumptions%20April%202021.pdf

 2
IFG income forecast Spring 2021

 1.4. The Spring 2021 forecast (so called because it is based on the FPP assumptions of April
 2021) has been developed as a ‘central forecast’ to represent the IFG’s view of the most
 likely outcome. In view of the uncertainties around the forecast it should be considered
 within a range which is described in section 5.

2. Uncertainties around the forecast
 2.1. Significant uncertainty remains around the IFG forecast, and emphasis should be on the
 illustrative range presented by the IFG, rather than solely on the central forecast.

 2.2. Much of the risk to the previous forecast was around the uncertainty over the likely impact
 of the Covid-19 pandemic and the public health measures put in place in response.
 However, considerably more data is now available on the economic impacts and on the
 impact on tax. Therefore, IFG’s view is that the level of uncertainty on the forecast has
 reduced and is now more symmetric. The remaining uncertainty regarding the Covid-19
 pandemic is primarily around how quickly the economy will recover, and the impact of any
 ongoing restrictions in 2021.

 2.3. Similarly, more is now known about the UK and Jersey’s trading relationship with the EU as
 the Brexit transition period came to an end in December 2020. The remaining uncertainty is
 therefore around how much impact this might have on Jersey’s economic prospects in the
 medium term.

 2.4. The financial services sector contributes a large part of Jersey tax take, either directly or
 indirectly. The sector has proven resilient against a number of challenges including the
 pandemic, though the impact of low interest rates will act as a drag on banking profitability
 and therefore corporate tax.

 2.5. There continue to be some uncertainties around external regulation. The OECD Inclusive
 Framework on Base Erosion and Profit Shifting has agreed the Building Blocks of a proposal
 to reform international taxation of multinational corporations. The detailed design features
 of this proposal, together with an implementation plan, should be produced later in the
 year and this should address the uncertainty somewhat.

 2.6. In the longer term, Jersey’s economy faces similar risks to other advanced economies –
 including the impact of ageing demographics and challenges with low productivity growth.
 These continue to contribute uncertainty around the income forecast.

3
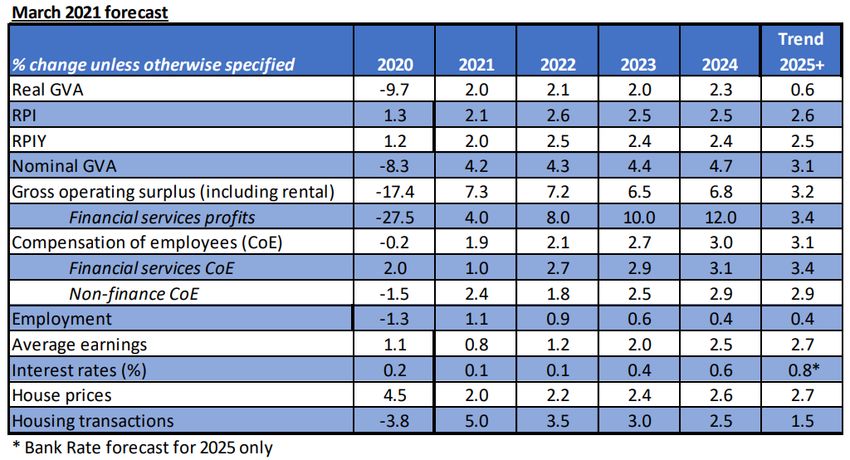
IFG income forecast Spring 2021

3. Base case economic assumptions
 3.1. The FPP economic assumptions have been updated based on the latest local and
 international developments to April 2021. (Figure 2)

 3.2. The main variations to the economic assumptions used in autumn 2020 reflect the
 additional releases of local data and include:

 • A steeper fall in financial services profits in 2020, reflecting data on banking profits
 produced by the Jersey Financial Services Commission. However, profits are
 expected to grow more quickly in the later years of the forecast; as market
 expectations for interest rates have improved.

 • Stronger inflation in the early years of the forecast, and a more robust housing
 market.

 • Stronger growth in house prices.

 3.3. The IFG has considered the economic assumptions from the FPP and have agreed that these
 assumptions be used as the basis of the income forecast modelling for Spring 2021.

Figure 2 – FPP Revised economic assumptions as at April 2021 (% change except where stated)

 4
IFG income forecast Spring 2021

Figure 3 – Variations in FPP economic assumptions between October 2020 and April 2021

4. Summary of forecasts
 4.1. The individual forecasts are appended, and these provide further detail of the assumptions
 and adjustments made to each component of the forecast.

 4.2. Personal income tax (Appendix A) – The forecast has increased for all years of the forecast,
 from £41m in 2021 decreasing to £31m in 2024. This is primarily driven by the higher than
 expected tax take for 2019, and data available from the Income Tax Instalment System
 (ITIS) for 2020. The IFG has reconsidered the adjustments made for the impact of Covid-19,
 which has increased the forecast for 2020 to 2023. A slight reduction has been made in
 respect of the updated FPP economic assumptions.

 4.3. Corporate income tax (Appendix B) – The latest FPP economic assumptions suggest a
 sharper fall in profits from financial services which has decreased each year of the forecast.
 However, this has been partially offset by the IFG’s judgement about an increase in the
 forecast for tax from property income and large corporate retailers. Overall, the forecast
 has decreased by £1m in 2021, £4m in 2022 and £3m in 2023 and is unchanged for 2024.

 4.4. GST (Appendix C) – Initial outturn data from 2020 have provided an insight into how the
 Covid-19 restrictions have translated into receipts. Incorporating this into the assumptions
 used to estimate the disruption from the pandemic has resulted in an increase in each year
 of the forecast, from £6.4m in 2021 tapering to £1.8m in 2024. An increase of c.£2.0m has
 been made in respect of the changes to the FPP economic assumptions and re-estimation
 of the statistical relationships used to forecast GST excluding ISE fees. An additional £3.7m
 annual increase has been included in respect of the change to ISE fees agreed in the
 Government Plan 2021-24.

5
IFG income forecast Spring 2021

4.5. Impôts duty (Appendix D) – Travel restrictions arising from the Covid-19 pandemic reduced
 the availability of duty-free purchases which translated to an increase in impôts duty.
 However restrictions arising from Covid-19 led to a decrease in excise receipts from fuel.
 The adjustments for Covid-19 have been reviewed and the latest FPP assumptions for RPI
 have been incorporated into the forecast, which has increased by 8% (£5.7m) in 2021 but
 remains consistent with the autumn 2020 forecast for the other years of the forecast.

4.6. Stamp duty (Appendix E) – The property market in 2020 proved stronger than anticipated
 in autumn 2020, despite Covid-19 restrictions. Together with several high-value
 transactions expected in 2021, this strong outturn has materially improved the forecast in
 each year, from c.40% (£12.3m) in 2021 decreasing to c.32% (£10.3m) in 2024.

4.7. Other Government income (Appendix F) – The outturn in 2020 was c.£6m above forecast,
 largely in respect of dividend income and currency returns. The additional adjustments
 made in respect of the anticipated effects of Covid-19 have been reconsidered and applied
 to the forecast. Overall the autumn 2020 forecast has been increased in each year of the
 forecast, from £5.6m in 2021 decreasing to £2.2m in 2024.

 6
IFG income forecast Spring 2021

IFG central forecast for Spring 2021
Figure 4 – IFG central income tax forecast

 Central forecast 2021 2022 2023 2024 2025
 (£'000) Forecast Forecast Forecast Forecast Forecast
 Income Tax
 Personal 503,000 530,000 562,000 593,000 628,000
 Autumn 2020 461,000 500,000 534,000 561,000
 Corporate 96,000 99,000 105,000 113,000 123,000
 Autumn 2020 97,000 103,000 108,000 113,000

 Total Income Tax 599,000 629,000 667,000 706,000 751,000
 Autumn 2020 558,000 603,000 642,000 674,000
 Variation 41,000 26,000 25,000 32,000
 7.3% 4.3% 3.9% 4.7%

 GST
 GSTx 85,100 88,500 90,400 92,400 94,600
 ISE Fees 12,600 12,600 12,600 12,600 12,600

 Total GST 97,700 101,100 103,000 105,000 107,200
 Autumn 2020 84,610 90,910 94,510 98,310
 Variation 13,090 10,190 8,490 6,690
 15.5% 11.2% 9.0% 6.8%

 Bad Debts
 Bad Debts (6,000) (6,000) (3,000) (3,000) (3,000)
 Total Bad Debts (6,000) (6,000) (3,000) (3,000) (3,000)
 Autumn 2020 (6,000) (6,000) (3,000) (3,000)
 Variation - - - -
 0.0% 0.0% 0.0% 0.0%

 Impôts Duties
 Spirits 8,191 7,336 7,527 7,715 7,915
 Wine 9,345 9,175 9,414 9,649 9,899
 Cider 912 861 866 870 875
 Beer 5,821 6,326 6,424 6,519 6,623
 Tobacco 21,024 15,802 16,051 15,466 14,916
 Fuel 24,611 27,492 27,925 28,337 28,783
 Customs Duty 800 800 800 800 800
 Vehicle Emissions Duty (VED) 2,948 2,730 2,644 2,644 2,644
 Total Impôts 73,652 70,522 71,651 72,000 72,455
 Autumn 2020 67,986 69,979 71,037 71,485
 Variation 5,666 543 614 515
 8.3% 0.8% 0.9% 0.7%

7
IFG income forecast Spring 2021

Stamp Duty
Stamp Duty 37,974 35,093 35,214 36,574 37,749
Probate 2,500 2,500 2,500 2,500 2,500
LTT 2,770 2,930 3,090 3,249 3,387
Total Stamp Duty 43,244 40,523 40,804 42,323 43,636
Autumn 2020 30,953 30,249 31,118 32,022
Variation 12,291 10,274 9,686 10,301
 39.7% 34.0% 31.1% 32.2%

General Tax Revenue 807,596 835,145 879,455 922,323 971,291
Autumn 2020 incl GP
measures 735,549 788,138 835,665 872,817
Variation 72,047 47,007 43,790 49,506
 9.8% 6.0% 5.2% 5.7%

Other Income
Island-wide Rates 13,565 13,918 14,266 14,623 15,003
Other Income - Dividends 11,122 11,412 11,715 12,282 12,600
Other Income - Non-
Dividends 9,169 8,404 8,511 8,495 8,368
Other Income - Returns from
Andium and Housing Trusts 30,580 31,394 32,228 33,084 33,897
Total Other Income 64,436 65,128 66,720 68,484 69,868
Autumn 2020 58,866 60,779 64,560 66,264
Variation 5,570 4,349 2,160 2,220
 9.5% 7.2% 3.3% 3.4%
Total States Income 872,032 900,273 946,175 990,807 1,041,159
Autumn 2020 794,415 848,918 900,224 939,081
Variation 77,617 51,355 45,951 51,726
 9.8% 6.0% 5.1% 5.5%

 8
IFG income forecast Spring 2021

5. Range of forecast
 5.1. The central forecast has been prepared based upon the FPP economic assumptions with
 additional consideration by IFG, as outlined in the separate reports.

 5.2. There are uncertainties that may be expected around the forecast, including those
 described in section 2. Therefore the IFG advise that the central forecast should be
 considered within an illustrative range, as shown below (Figure 5).

 Figure 5 – Range of Spring 2021 IFG forecast compared to forecasts from autumn 2020 and
 autumn 2019

 £'000 Range of total IFG forecast Spring 2021
1,150,000

1,100,000

1,050,000

1,000,000

 950,000

 900,000

 850,000

 800,000

 750,000
 2020 2021 2022 2023 2024 2025
 Upper Central Lower Autumn 2020 Autumn 2019

£'000 2020 2021 2022 2023 2024 2025
Upper 856,836 880,752 927,281 993,484 1,060,163 1,134,863
Central 856,836 872,032 900,273 946,175 990,807 1,041,159
Lower 856,836 863,312 873,265 898,866 921,451 947,455
Autumn 2020 779,078 794,415 848,918 900,224 939,081
Autumn 2019 868,433 903,319 941,584 980,232

9
Personal income tax forecast

Appendix A – Personal income tax forecast

Personal income tax forecast
The IFG’s autumn 2020 forecast has been updated to incorporate the latest outturn tax data and the
FPP’s April 2021 economic assumptions. This should be considered provisional, as work is still being
undertaken within Revenue Jersey to verify the consistency of the data. An update on this work will
be provided during the next forecasting round.

The updated personal income tax forecast is summarised in Figure 1. The forecast has increased in
all years. Around half of the aggregate increase over 2019-24 is from the 2019 outturn. The other
main drivers are stronger than expected earnings growth reported through ITIS in 2020, and changes
to the IFG adjustments.

Figure 1: Changes to personal income tax forecast since October 2020

 £m 2019 2020 2021 2022 2023 2024 2025
Personal tax
October 2020 forecast 467 434 461 500 534 561
Tax outturn +15 +14 +14 +15 +16 +18
2020 ITIS outturn 0 +7 +8 +8 +8 +8
Economic data/assumptions 0 0 -1 -3 -2 +1
New relationships 0 0 +1 0 +2 +4
Updated HVR forecast +1 0 0 0 0 0
Changes to IFG adjustments 0 +14 +20 +10 +5 0
July 2021 forecast 483 470 503 530 562 593 628
 Change since October 2020 forecast +16 +36 +41 +30 +28 +31
October 2019 forecast 475 497 524 550 576
 Change since October 2019 forecast +8 -27 -21 -21 -14

The remainder of the note is set out as follows:

 • Section 1 describes how the forecast is carried out.
 • Section 2 sets out the new economic assumptions and updates to tax outturn data.
 • Section 3 explains the IFG’s adjustments to the forecast to account for the COVID-19 crisis.
 • Section 4 sets out the forecast.
 • Annex 1 sets out in detail some improvements made to the statistical equations used in the
 forecast for key taxable income types.

 10
Personal income tax forecast

1. How the forecast is carried out
An overview of the personal income tax forecasting model is shown in Figure 2. There are two main
elements – forecasting taxable income and then forecasting the likely average effective tax rate (i.e.
tax collectable per £1 of taxable income) based on forecasts of the value of deductions (including
exemption thresholds for marginal rate taxpayers, and the various reliefs, credits and allowances
claimed by taxpayers). The forecast of tax collectable is therefore the product of the forecasts for
taxable income and the average effective tax rate.

Taxable personal income is estimated over the forecast period by taking outturn data provided by
Revenue Jersey and projecting it forward, largely using statistical relationships between taxable
income and various economic variables. The economic variables include compensation of employees
(CoE), company profits, employment, average earnings, inflation and interest rates. Forecasts of
these variables are overseen by the independent Fiscal Policy Panel (FPP).

The average effective tax rate is then forecast by taking the baseline data for the value of deductions
and forecasting changes in these in line with assumptions about future taxpayer numbers, inflation,
interest rates and policy changes announced in previous Budgets and Government Plans. So, for
example, the aggregate value of the basic exemption thresholds might be assumed to rise in line
with the lower of RPI inflation and earnings (to represent the anticipated annual increase in the
threshold), and employment growth (to represent the increase in taxpayer numbers claiming this
threshold).

Figure 2: Model overview

 BASELINE FORECASTS

 • statistical relationship
 Income Forecast income
 • economic assumptions

 minus minus

 • taxpayer number assumptions
 Exemptions, reliefs and allowances . Forecast reliefs
 • known and future policy assumptions
 • economic assumptions

 multiplied by multiplied by

 Tax rates Tax rates

 = =

 Net tax collectable Forecast net tax collectable

11
Personal income tax forecast

2. New economic assumptions and updated tax data
Updated economic assumptions

The Fiscal Policy Panel’s (FPP) updated economic assumptions have been used in the model to
update the income tax forecast. The economic assumptions were published in April 2021. The
economic assumptions letter can be found on the FPP web-site www.gov.je/fiscalpolicypanel

Updated information from Revenue Jersey

Personal tax assessments
Outturn tax data now include the 2018 and 2019 years of assessments. However, considerable care
needs to be taken over interpreting these two years. 2018 was the first year in which the new
Revenue Management System (RMS) was in place; and 2019 was the first year for online filing. The
impact of both means there is potentially a structural break in some of the data3.

The outturn for 2018 was around £7m higher than at the time of the IFG’s last forecast, while the
outturn for 2019 has come in around £16m higher than forecast. There have been some changes to
the structure of the underlying dataset that mean it is not possible to fully disaggregate the
difference between the forecast and the outturn. For example, RMS categorises taxed at source
income according to the income type - rather than categorising it separately as in ITAX. Further, RMS
makes it possible to split out income from trusts and estates for example – which can now be
forecast separately to individuals. Therefore, the growth rates below are not entirely comparable,
and there may be a structural break over the period for which the growth rates have been
calculated.

 Forecast growth rate Outturn growth rate
 Income type 2017-19 2017-19
 Earnings 7.9% 6.3%
 Pension 12.9% 13.5%
 Business income 7.0% -1.6%
 Property income 14.2% 6.5%
 Shareholder income 6.3% -2.8%
 Investment income 11.1% 33.2%
 Total taxable income 8.6% 6.8%

Further, the effective tax rate was forecast to remain at 13.7% but the new data show it has grown
from 13.5% in 2017 to 14.2% in 2019.

On the face of it, taxable income grew more slowly than forecast but the effective tax rate was
higher than forecast. However, this is susceptible to any structural break in the data due to either
the move to RMS or the move to online filing. It is possible that some income that was reported in

3
 A structural break means that there has been a sudden and unexpected change in a time series.

 12
Personal income tax forecast

ITAX no longer appears in RMS – meaning income (and importantly income growth) is lower but the
effective tax rate is higher.

Taxpayers on the high-value residency regime
Assessments for taxpayers on the high-value residency (HVR) regime show that around £23m was
assessed for these taxpayers in 2019. Tax from these taxpayers is forecast separately, and the
outturn of £23m has been incorporated into the forecast as a new base. This is around £½m higher
than forecast.

Other entities
Revenue Jersey has improved the data set by separating out other entities that appear in the
personal income tax total. This includes tax from clubs/associations, estates, and pension schemes.
This tax amounted to a net £2.8m in 2019. The forecast assumes this amount remains flat in nominal
terms.

ITIS data
Revenue Jersey has provided a revised figure for growth in employment income reported through
the Income Tax Instalment System (ITIS) for 2020. This indicates that employment income grew by
1.1 per cent in 2020.

The 1.1 per cent for the full year is the combination of relatively strong year-on-year growth in
quarter 1, followed by a dip in quarter 2 during the lockdown. The second half of the year was
relatively flat, with the exception of strong performance in both September and December.

While the annual growth rate is much smaller than in recent years, it is strong compared to
expectations for a fall in 2020. For information the average growth over 2016-2019 was over 4%.

Figure 3: Income reported through ITIS in 2020: Growth on the same month in 2019

 8%

 6%

 4%

 2%

 0%

 -2%

 -4%

 -6%

This has been incorporated into the forecast, rather than the fall in earnings that would be
estimated by the equation that underpins the tax forecasting model.

13
Personal income tax forecast

ITIS data for the first five months of 2021 are available, but recent months generally should not be
considered complete data due to the lag in receiving employer returns. Earnings reported through
ITIS in the first quarter of 2021 were 4.0% higher than earnings reported in the first quarter of 2020.
However, this includes some payments to HVRs that are considerably higher than 2020 – after
stripping these out earnings reported through ITIS in quarter 1 of 2021 is relatively flat compared to
the same quarter of 2020. However, it would not be appropriate to extrapolate this across the full
year – given the highly volatile nature of earnings in 2020 due to the pandemic.

 14
Personal income tax forecast

3. Adjustments to personal income tax forecast due to the COVID-19
 crisis
The Income Forecasting Group has made additional adjustments to account for the impact of the
global pandemic and the resultant restrictions on economic activity. These adjustments are to the
smaller income lines, i.e. income other than employment income. This is because the impact on
employment income was already included in the FPP forecast. The approach in ‘normal times’ is to
forecast many of these smaller income lines to be flat in real terms, or to grow in line with recent
averages, and IFG took the view that adjustments were needed to these assumptions to reflect the
impact of the pandemic not only on the labour market but on other income streams.

These adjustments are based on the judgement of the IFG, using available local and international
evidence and their knowledge of the Jersey tax base.

The IFG discussed and agreed changes to their adjustments when they met in April 2021. These have
been incorporated into the new forecast:

 • The adjustments previously made to pension income and to the average effective tax rate
 have been removed from the forecast.
 • The adjustment to business income is unchanged.
 • The adjustments to bank, dividend and other unearned income and to distributions
 continues to assume that these income types fall by 20% in 2020.
 • The adjustment to property income has been amended so that property income is flat in
 2020 (rather than the fall previously assumed).

 % adjustment to model results 2020 2021 2022 2023 onward

 Business income -25 -12.5 -6.25 0
 (6% of total)
 Bank, dividend and other income -15 -7.5 -3.75 0
 (4% of total)
 Property income -6.3 -3.15 -1.575 0
 (4% of total)
 Distributions -21 -10.5 -5.25 0
 (5% of total)

In total, these four types of taxable income represent less than 20% of total taxable income. They
have been adjusted using the IFG’s judgement as the forecasts are not otherwise directly related to
economic performance reflected in the FPP forecast. The exception is bank, dividend and other

15
Personal income tax forecast

income where IFG has considered the temporary impact on dividends and other investment income
to be greater than the impact solely of falling interest rates4.

The impact of the remaining IFG adjustment remains significantly negative, though less so than in
the previous forecast. The net effect is to reduce the forecast by £26m in 2020, £14m in 2021 and
£7m in 2022.

 1. The downward adjustment to business profits reduces the forecast by £12m in 2020.
 2. The downward adjustment to distributions reduces the forecast by £9m in 2020.
 3. The downward adjustment to investment income reduces the forecast by £4m in 2020.
 4. The downward adjustment to property income reduces the forecast by £2m in 2020.

While the IFG adjustments are significant, they are just one of a number of uncertainties around the
impact of the Covid-19 pandemic, or uncertainties more broadly. For example, a variation in earned
income of just 1% would result in a variation of £5m-£6m in each year of the forecast.

Figure 4 shows the impact of each of the four remaining adjustments. This results in a forecast of
sharp falls in 2020 for investment income, profits and distributions.

Figure 4: Forecasts for taxable income types after IFG adjustments (£m)

 600
 Forecast
 500

 400

 300

 200

 100

 0
 2006

 2019
 2001
 2002
 2003
 2004
 2005

 2007
 2008
 2009
 2010
 2011
 2012
 2013
 2014
 2015
 2016
 2017
 2018

 2020
 2021
 2022
 2023
 2024
 2025

 Profit Property income
 Investment income Shareholder income / distributions

4
 This is based on international evidence, for example total dividends paid by FTSE100 firms fell by 20% in
2020.

 16
Personal income tax forecast

4. Updated personal income tax forecast
The forecast has increased in all years, with the main drivers being the 2019 tax outturn, ITIS data for
2020 and changes to the IFG’s adjustments.

Figure 5: Changes to personal income tax forecast since October 2020

 £m 2019 2020 2021 2022 2023 2024 2025
Personal tax
October 2020 forecast 467 434 461 500 534 561
Tax outturn +15 +14 +14 +15 +16 +18
2020 ITIS outturn 0 +7 +8 +8 +8 +8
Economic data/assumptions 0 0 -1 -3 -2 +1
New relationships 0 0 +1 0 +2 +4
Updated HVR forecast +1 0 0 0 0 0
Changes to IFG adjustments 0 +14 +20 +10 +5 0
July 2021 forecast 483 470 503 530 562 593 628
 Change since October 2020 forecast +16 +36 +41 +30 +28 +31
October 2019 forecast 475 497 524 550 576
 Change since October 2019 forecast +8 -27 -21 -21 -14

For information, Figure 6 breaks down the drivers of the aggregate change over the six years 2019-
24. Total revenue from personal tax over these six years is now forecast to be £183m (6%) greater
than the October 2020 forecast. Around half of this increase is due to the higher than expected tax
take for 2019, with the remainder largely due to data available from ITIS for 2020 and changes to
the IFG adjustments.

Figure 6: Changes in total revenue 2019-24

 Total over % of total
 £m
 2019-24 variation
Tax outturn +93 51%
2020 ITIS outturn +40 22%
Economic data/assumptions -7 -4%
New relationships +7 4%
Updated HVR forecast +1 1%
Changes to IFG adjustments +49 27%
 Total change since October 2020 +183 100%

A more detailed disaggregation to the changes to the forecast is set out in the remainder of this
section.

17
Personal income tax forecast

Tax outturn

As stated in section 2, the outturn for the 2019 year-of-assessment was £16m higher than forecast,
including £1m for taxpayers on the HVR regime. The £15m for non-HVR taxpayers is incorporated
into the base and therefore recurs in future years. Given that this update includes two new years of
tax data (2018 and 2019) and there have been changes to the historical data from ITAX to make it
consistent with RMS; the impact of the outturn in future years varies a little. Different types of
taxable income are forecast to grow at different rates so if there is a change in the balance between
the types of income, the aggregate growth rate will change.

ITIS outturn

As stated in section 2, data from ITIS for 2020 suggest annual growth in earnings of 1.1%. This is
considerably higher than the previous forecast for earnings to fall by ½%. Therefore, using growth in
ITIS earnings to inform the estimate for growth in assessed earnings adds around £7m-£8m to the
forecast in each year.

ITIS data for the first quarter of 2021 suggest relatively flat earnings when compared to the first
quarter of 2020. This is significantly lower than the forecast for full-year growth of 2.1%, which is
based on the equation used to forecast earnings. However, given the volatility of monthly earnings
in 2020, it is not considered appropriate to extrapolate 2021’s first quarter growth rates across the
full year.

Economic data/assumptions

The FPP’s April economic assumptions have been incorporated into the forecast:

 • The higher forecast for inflation results in a reduction in the tax forecast of £1m-£2m each
 year from 2022. This is primarily due to the impact of higher inflation on projections for
 allowance growth.
 • The lower forecast for financial services profits in the early years of the FPP forecast results
 in a reduction to the tax forecast; as financial services profits is included in the equation to
 forecast taxable earnings. In later years, the FPP forecast assumes a stronger recovery in
 financial services profits – due to a change in market expectations for interest rates. The net
 impact is to reduce the forecast by £2m in 2021 and £1m in 2022 but increase the forecast
 by £2m in 2023 and £5m in 2024.
 • The lower forecast for compensation of employees reduces the forecast by £1m in 2022,
 £3m in 2023 and £4m in 2024.
 • The higher forecast for interest rates increases the forecast by around £1m in 2023 and
 2024. This is due to the impact on bank interest, dividend and other unearned income.

 18
Personal income tax forecast

 • The increased house price forecast results in a small reduction to the forecast, due to a small
 increase in the projections for mortgage interest tax relief. It is worth noting that mortgage
 interest tax relief will be phased out by 2026.

New relationships

This relates to changes in the relationships used to forecast individual types of taxable income.

 • Taxable earnings are forecast using an equation that estimates the relationship between
 earnings and the components of GVA. This equation has been re-estimated to include the
 latest data, and the model has been respecified to use growth rates in earnings reported
 through ITIS in recent years, rather than assessed earnings. The changes to the equation are
 explained in Annex 1 and are designed to overcome any potential structural break from the
 move to RMS and the move to online filing. The new equation increases the tax forecast by
 £3m in 2021, £4m in 2022, £8m in 2023 and £12m in 2024, when compared to the October
 2020 forecast.
 • The equations used to forecast pensions and investment income (bank, dividend and other
 unearned income) have also been re-estimated with the latest tax outturn. Annex 1 sets out
 some small improvements to the equations, to make them more robust. The new equations
 results in an decrease to the forecast of around £½m in 2020 and £2m from 2021 onward.
 • Business profits are forecast to grow in line with their average growth over the last five
 years. In the new data set this growth rate is higher and incorporating this adds £0.8m to the
 forecast in 2020, which gradually increases each year to reach a £6m increase to 2024.
 • Property income is forecast to grow in line with average growth over the last ten years. This
 growth rate is now smaller, and this reduces the forecast by £100k in 2020, gradually
 increasing to a £1m reduction to 2024.

Updated HVR forecast

Tax from HVRs is forecast separately to the main taxpayer population. This is because the marginal
tax rates faced by these taxpayers differ from those for other taxpayers. Therefore, the forecast for
HVR tax is based on expectations for the number of HVR taxpayers arriving and departing.

The outturn for 2019 was around £600k higher than forecast, and this has been incorporated into
the base. The number of arrivals in 2020 was a little lower than assumed in the forecast, while the
full year expectation for 2021 is greater than assumed in the previous forecast. The number of
departures in 2020 and expectations for 2021 are also a little higher than assumed in the forecast.

The net effect of these adjustments is relatively small, less than £¼m in each year.

19
Personal income tax forecast

Updated IFG adjustments

The updated IFG adjustments are set out in section 3. The impact of each individual change is set out
below:

 1. The removal of the adjustment to the average effective tax rate results in an additional £8m
 in 2020, £17m in 2021 and £9m in 2022.
 2. The removal of the pension adjustment results in an additional £4m in 2020, £2m in 2021
 and £1m in 2022.
 3. The reduction in the adjustment to property income results in an additional £2m in 2020,
 and £1m in 2021 and 2022.
 4. The IFG’s view on investment income (bank interest, dividends and other unearned income)
 is that it should be adjusted to result in a 20% fall in this income in 2020. A small change to
 the adjustment has been made to ensure this continues to be the effect of the adjustment.
 This results in an increase to the forecast of around £270k in 2020, £140k in 2021 and £70k
 in 2022.

 20
Personal income tax forecast

Annex 1: Improvements to statistical relationships
The statistical relationships used to forecast taxable income have evolved and adapted over time.
Review and improvement are done regularly to ensure that it can be demonstrated that the
relationships used accurately explain the past data and therefore maximise the potential for a robust
forecast. Currently equations are used to forecast earned income, pensions and investment income.
Together these three represent around 85% of aggregate taxable income.

The equations currently used for earnings and pensions were developed by Oxera in 2017. One
minor change has been made in recent years – to account for the fact that finance sector bonuses
being included in economic data in the calendar year before they are actually paid. The equation for
investment income was also tested extensively in 2017 but no change was made.

The three equations currently used are:

 1. Growth in earnings is forecast in line with aggregate earnings in the finance and non-finance
 sectors, and profits in the finance sector.
 2. Growth in pensions is forecast in line with average earnings and growth in the over-65
 population.
 3. Growth in investment income is forecast in line with changes to the Bank of England Bank
 Rate.

These equations are regularly reviewed with any potential improvements or amendments
investigated. However, the recent changes to the way that tax data are structured and compiled
(due to the move to RMS) mean that there is a greater than usual need to give consideration to
ensuring the equations continue to be as robust as possible. This annex sets out work that has been
carried out to improve each of the equations.

Note that the comparisons set out here relate to the monetary impact of using these improved
equations, as compared to the alternative of re-estimating the existing equations using the previous
structure but with the latest data. This differs from the comparisons set out in the main forecast
document, which are the impact of the new equations when compared to the last IFG forecast.

21
Personal income tax forecast

High-level summary

While the three existing equations remain broadly robust and explain a large degree of the past
variation in taxable income, the new data series mean that without making any changes the
equations would be less robust than before. Improvements have therefore been implemented as
follows:

 1. The earned income equation has been improved by using data on growth in earnings
 reported through ITIS from 2016-19, rather than growth in assessed earnings - as there is
 some uncertainty around the consistency of recent data from assessments.
 2. The pension equation has been improved by adjusting for a potential change in the
 relationship between pension income and the economic variables.
 3. The investment income equation has been improved by including a variable to account for
 the change in interest rates in the previous year – to account for delay in passing on policy
 interest rate changes.

The small changes to the three equations result in new estimated relationships that are more robust,
and therefore they have been incorporated into the forecast. As stated above, reviewing the
relationships and making incremental changes is not unusual and would be expected of any
econometric model. However, the addition of two new years of data (rather than the usual one year
at a time) and the revisions to the historical data (to make them consistent with the output of RMS
for 2018 and 2019) mean that there is a greater than normal need to consider improvements.

For context, the new equations would statistically be expected to improve the range around the
forecast by around +/-£1.3m in the first year of the forecast. This will increase over future years, as
the statistical errors in the equations are compounded.

 22
Personal income tax forecast

Earned income equation

As stated above, the earned income equation seeks to explain variations in taxable earnings with
respect to variations in financial services profits (FSGOS), financial services aggregate wages (FSCOE)
and non-finance sector aggregate wages (NFCOE).

The equation used is of the following form:

 ∆ = 0 + 1 ∗ ∆ + 2 ∗ ∆ + 3 ∗ ∆ + 4 ∗ ∆ (−1)
 + 4 ∗ 03 08

Where:
 ∆earnings is the annual growth rate in taxable earnings

 β0 is a constant term;

 β1 is a coefficient representing the effect that the growth rate in financial services gross
 operating surplus (∆FSGOS) have on taxable earnings

 β2 is a coefficient representing the effect that the growth rate in financial services
 compensation of employees (∆FSCOE) have on taxable earnings

 β3 is a coefficient representing the effect that the growth rate in non-finance sectors
 compensation of employees (∆NFCOE) have on taxable earnings

 β3 is a coefficient representing the effect that the growth rate in financial services
 compensation of employees in the previous year (∆FSCOE(-1)) have on taxable earnings

 β4 represents the impact of a dummy variable (D03to08), which is set to 1 for years up to
 2008, to account for a structural break in the series5

Re-estimating this equation with assessed earnings data from 2004 to 2019 gives the following
results. This suggests that the equation explains almost 90% of the past variation in taxable earnings.

5
 A structural break is when a time series abruptly changes at a point in time. In this particular data
series, Oxera found that there is a structural break in the nominal GVA variable in 2009.

23
Personal income tax forecast

 Ordinary Least Squares Estimation
 *********************************************************************************
 Dependent variable is EMP_INC
 16 observations used for estimation from 2004 to 2019
 *********************************************************************************
 Regressor Coefficient Standard Error T-Ratio[Prob]
 INPT 0.95674 0.49831 1.9200[.084]
 COE_FS 0.20057 0.08245 2.4327[.035]
 COE_NF 0.16313 0.15678 1.0405[.323]
 GOS_FS 0.07470 0.02747 2.7196[.022]
 COE_FS(-1) 0.11904 0.06432 1.8508[.094]
 D03TO08 2.22130 0.68818 3.2278[.009]
 *********************************************************************************
 R-Squared .89582 R-Bar-Squared .84374
 S.E. of Regression .99583 F-Stat. F(5,10) 17.1982[.000]
 Mean of Dependent Variable 3.7281 S.D. of Dependent Variable 2.5192
 Residual Sum of Squares 9.9168 Equation Log-likelihood -18.8762
 Akaike Info. Criterion -24.8762 Schwarz Bayesian Criterion -27.1939
 DW-statistic 1.8433

The overall fit is reasonable, and all of the variables used are justifiable and have the correct signs.
However, the results for two of the individual variables suggest a need for further investigation - the
‘prob’ column shows that the coefficient on the variable COE_NF is not significant at a 10% level,
meaning there is a greater than 10% probability that it is not statistically significant. The variable
COE_FS(-1) is not significant at a 5% level.

Figure 7 compares actual growth rates in assessed earnings (the blue line) with the values that are
consistent with the equation. This shows that the equation is a good fit in earlier years but in recent
years is less of a close fit.

Figure 7: Existing earnings equation - actual and fitted values

 Plot of Actual and Fitted Values of EMP_INC

 10

 8

 6

 4

 2

 0
 2004 2008 2012 2016 2019

 EMP_INC Fitted

 24
Personal income tax forecast

Looking in more detail at the series for assessed earnings from the latest tax data suggest that this
has diverged from the series used in earlier forecasts. Figure 8 compares the new (June 2021) and
old (August 2020) series for assessed earnings with data on earnings reported by employers through
ITIS. The switch to RMS in 2018 and to online filing in 2019 may mean that the 2018 and 2019
growth rates do not reflect the underlying growth in earnings – i.e. they represent a structural break.
The divergence in 2016 has not been explained.

Figure 8: Growth rates in old and new series for assessed earnings, and ITIS earnings

 10%
 9%
 8%
 7%
 6%
 5%
 4%
 3%
 2%
 1%
 0%

 Old series growth rates ITIS growth rates Latest series growth rates

Therefore, the Economics Unit has considered how to overcome the potential difficulties with recent
assessed earnings data. An alternative equation has been developed, which uses growth rates in
assessed earnings from 2004 to 2015, then uses growth rates in ITIS earnings from 2016 to 2019.
This assumes that growth in ITIS earnings more accurately reflects the underlying growth rate in
earnings in recent years, due to potential structural breaks in the assessed earnings data, and
therefore is more appropriate to use in order to establish a statistical relationship.

25
Personal income tax forecast

 Ordinary Least Squares Estimation
 *******************************************************************************
 Dependent variable is EMPWITIS
 16 observations used for estimation from 2004 to 2019
 *******************************************************************************
 Regressor Coefficient Standard Error T-Ratio[Prob]
 INPT 1.03170 0.36436 2.8316[.018]
 COE_FS 0.17652 0.06029 2.9281[.015]
 COE_NF 0.27967 0.11464 2.4395[.035]
 GOS_FS 0.08581 0.02008 4.2723[.002]
 COE_FS(-1) 0.15492 0.04703 3.2942[.008]
 D03TO08 1.45290 0.50320 2.8872[.016]
 *******************************************************************************
 R-Squared .94093 R-Bar-Squared .91139
 S.E. of Regression .72816 F-Stat. F(5,10) 31.8558[.000]
 Mean of Dependent Variable 4.0289 S.D. of Dependent Variable 2.4461
 Residual Sum of Squares 5.3021 Equation Log-likelihood -13.8671
 Akaike Info. Criterion -19.8671 Schwarz Bayesian Criterion -22.1849
 DW-statistic 2.0521

This equation explains more than 94% of the past variation in earnings (assessed earnings to 2015
and ITIS earnings from 2016). Further, all the coefficients are significant at least at a 5% level i.e.
there is less than 5% probability that they are not significant. The fit in recent years is improved
compared to the existing equation.

Figure 9: Alternative earnings equation - actual and fitted values

 Plot of Actual and Fitted Values of EMPWIT IS

 10

 8

 6

 4

 2

 0
 2004 2008 2012 2016 2019

 EMPWITIS Fitted

The impact of switching to the new equation would be to increase the personal income tax forecast
by £2m in 2021, £5m in 2022, £8m in 2023, £11m in 2024 and £15m in 2025 – when compared to re-
estimating the existing equation using the new assessed earnings data.

 26
Personal income tax forecast

Figure 10: Comparison of outturn and forecast

 a) Existing equation (re-estimated) b) Alternative equation

 Plot of Actual and Single Equation Static Forecast(s) of EMP_INC

 10

 8

 6

 4

 2

 0

 -2
 2004 2010 2016 2022 2025

 EMP_INC Forecast

 Plot of Actual and Single Equation Static Forecast(s) of EMPWITIS

 10

 8

 6

 4

 2

 0

 -2
 2004 2010 2016 2022 2025

 EMPWITIS Forecast

To give an indication of the degree of improvement in the new equation, it can be observed that the
‘standard error’ of the alternative equation is 0.728, compared to 0.996 for the re-estimated existing
equation. This suggests that there is statistically a 2/3 likelihood that the range around the results of
the existing equation represents around +/-£3.2m of tax, whereas the range around the alternative
equation represents around +/-£2.3m of tax. This is therefore a significant improvement, which will
increase over the forecast horizon by compounding of the errors.

It is proposed that more work is undertaken to establish the appropriate growth rates in past earned
income. This will be improved when the default assessment process is completed for 2019. In the
meantime, it is proposed to switch to the alternative equation.

27
Personal income tax forecast

Pension equation

IFG has in the past discussed whether the strong growth rates in pension income in recent years may
start to ease off as the impact of demographic patterns change. Part of the reason for the strong
growth rates was the retirement of ‘baby-boomers’, the first of which will have reached the age of
65 in 2011. The impact of these demographic trends will have resulted in strong growth in
percentage terms, due to two reasons:

 1. These cohorts will be a proportionally large number of people compared to the existing
 base of retired people.
 2. The pensions these people have will be significantly larger than the average pension
 among the existing base of retired people.

Both these effects will start to fade as the existing population of pension claimants gets larger and
the average pension of existing claimants gets bigger. So, while the absolute growth may remain
strong, the percentage growth rate may slow.

However, this change is likely to be gradual and spread over a much greater period than the six years
of the personal income tax forecast. This means it is difficult to model. The equation developed in
2017 attempted to account for this by considering the growth rate of the over-65 population and
earnings growth in the last two years.

In addition to the demographic trends, there will also be an impact from changes in aggregate
investment returns over the working lives of those who start receiving a pension. This is also likely to
be a gradual effect and is not explicitly captured by the equation.

The results from the existing regression model are set out below, this has been re-estimated with
the latest data but has the same specification as the equation used in recent years. This shows that
the equation explains almost 77% of the past variation in pension income growth. However, the
coefficient for the over65 population growth variable is not significant at a 10% level, i.e. there is a
greater than 10% probability that it is not statistically significant.

 28
Personal income tax forecast

 Ordinary Least Squares Estimation
 *******************************************************************************
 Dependent variable is PEN_INC
 18 observations used for estimation from 2002 to 2019
 *******************************************************************************
 Regressor Coefficient Standard Error T-Ratio[Prob]
 INPT 1.3805 1.5455 .89327[.387]
 EARN 0.8369 0.26683 3.1365[.007]
 EARN(-1) 0.71048 0.18302 3.8819[.002]
 OVER65 0.40476 0.37247 1.0867[.296]
 *******************************************************************************
 R-Squared .76807 R-Bar-Squared .71837
 S.E. of Regression 1.0345 F-Stat. F(3,14) 15.4545[.000]
 Mean of Dependent Variable 7.2706 S.D. of Dependent Variable 1.9493
 Residual Sum of Squares 14.9815 Equation Log-likelihood -23.8889
 Akaike Info. Criterion -27.8889 Schwarz Bayesian Criterion -29.6696
 DW-statistic 1.3275
 *******************************************************************************

Figure 11 looks at how well the equation explains growth rates in individual years. This suggests a
relatively good fit up to 2011, with the relationship being less clear from 2012 onward. This may be
due to the issues discussed above, that the impact of demographics may be changing over time and
that cumulative past investment returns on pension funds may be changing over time. It is not clear
what specifically would have changed in 2020 but the statistical analysis suggests this is when the
structural break occurred.

Figure 11: Existing pension equation - actual and fitted values

 Plot of Actual and Fitted Values of PEN_INC

 12

 11

 10

 9

 8

 7

 6

 5

 4
 2002 2007 2012 2017 2019

 PEN_INC Fitted

Therefore, an alternative equation has been developed to account for the fact that the relationship
since 2012 appears to be different. This has been achieved through including a dummy variable set
to 1 for years up to 2012. This equation is more robust, explaining almost 90% of the past variation
in pension income growth. Further, the coefficients on all variables are now significant at the 1%
level - except for the constant term. It is considered appropriate to continue to include the constant
term as to exclude it would be to implicitly assume a constant of zero.

29
Personal income tax forecast

 Ordinary Least Squares Estimation
 *******************************************************************************
 Dependent variable is PEN_INC
 18 observations used for estimation from 2002 to 2019
 *******************************************************************************
 Regressor Coefficient Standard Error T-Ratio[Prob]
 INPT -1.0206 1.2346 -.82667[.423]
 EARN 0.87218 0.18616 4.6851[.000]
 EARN(-1) 0.56624 0.1326 4.2703[.001]
 OVER65 1.0948 0.31219 3.5068[.004]
 D02TO12 1.9851 0.49898 3.9783[.002]
 *******************************************************************************
 R-Squared .89541 R-Bar-Squared .86323
 S.E. of Regression .72090 F-Stat. F(4,13) 27.8235[.000]
 Mean of Dependent Variable 7.2706 S.D. of Dependent Variable 1.9493
 Residual Sum of Squares 6.7561 Equation Log-likelihood -16.7215
 Akaike Info. Criterion -21.7215 Schwarz Bayesian Criterion -23.9475
 DW-statistic 2.8345
 *******************************************************************************

The positive coefficient on the new dummy variable (D02to12) means that after accounting for
growth in earnings and the over65 population, the growth rate in pension income during 2002 to
2012 was faster than from 2013 to 2019.

Figure 12 demonstrates that the new equation still has a reasonably good fit with the data before
2012 but now has a much closer fit with the data from 2012 onward.

Figure 12: Alternative pension equation - actual and fitted values

 Plot of Actual and Fitted Values of PEN_INC

 12

 11

 10

 9

 8

 7

 6

 5

 4
 2002 2007 2012 2017 2019

 PEN_INC Fitted

The impact of switching to the new equation would be to reduce the personal income tax forecast
by £1m in 2020 and 2021, £2m in 2022 and 2023, £3m in 2024 and £4m in 2025 – when compared to
re-estimating the existing equation with the latest data. It is proposed to switch to this new
equation, but again this can be considered further when more verification can be done on the 2019
outturn.

 30
Personal income tax forecast

To give an indication of the degree of improvement in the new equation, it can be observed that the
‘standard error’ of the alternative equation is 0.721, compared to 1.035 for the existing equation.
This suggests that there is statistically a 2/3 likelihood that the range around the results of the
existing equation represents around +/-£0.5m of tax, whereas the range around the alternative
equation represents around +/-£0.3m of tax. The impact of the difference between the two
equations will increase over the forecast horizon by compounding of the errors.

31
Personal income tax forecast

Investment income equation

Investment income is a broad category of income, including all income that does not fit into the
earnings, distributions, pensions, property or business income categories. A large element of this is
bank interest and dividends, though it is not possible to separate this category into consistent
separate series due to changes in the way that certain types of income were recorded in the past.

Growth in this type of income can be quite volatile. Combined with the range of income types
included, it can make it more difficult to fit a robust equation to explain the past data. However, an
equation has been used for several years that can explain a large part of the variation in past growth
rates, using variations in the Bank of England Bank Rate.

Re-estimating this equation with the latest data produces the following results:

 Ordinary Least Squares Estimation
 *******************************************************************************

 Dependent variable is BDO_INC
 18 observations used for estimation from 2002 to 2019
 *******************************************************************************
 Regressor Coefficient Standard Error T-Ratio[Prob]
 INPT 2.2101 2.6347 .83883[.414]
 BRPP 12.3587 2.5090 4.9257[.000]
 *******************************************************************************
 R-Squared .60260 R-Bar-Squared .57777
 S.E. of Regression 10.8746 F-Stat. F(1,16) 24.2621[.000]
 Mean of Dependent Variable -.79378 S.D. of Dependent Variable 16.7354
 Residual Sum of Squares 1892.1 Equation Log-likelihood -67.4365
 Akaike Info. Criterion -69.4365 Schwarz Bayesian Criterion -70.3269
 DW-statistic 1.9695
 *******************************************************************************

This equation explains around 60% of the past variation in investment income. The coefficient on the
explanatory variable is statistically significant at a 1% level, the constant is not significant but is
included as to exclude it would mean implicitly assuming a constant of zero.

Figure 13 shows that the equation is a relatively good fit in most years. However, while investment
income growth is volatile, there have been very few changes in policy interest rates since 2009 i.e.
the red line shows a constant rate of growth while actual growth rates have varied as shown by the
blue line.

 32
Personal income tax forecast

Figure 13: Existing investment income equation: actual and fitted values

 Plot of Actual and Fitted Values of BDO_INC

 40

 20

 0

 -20

 -40

 -60
 2002 2007 2012 2017 2019

 BDO_INC Fitted

Further work has been carried out to identify any potential to develop an equation that fits more
closely with the outturn data. An equation has been developed that includes a lagged term on the
change in Bank Rate, i.e. the change in Bank Rate in the previous year. This improves the ability of
the equation to explain past variations in investment income. This may be due to a lag in deposit-
taking institutions in passing on interest rate changes – for example on savings products where the
interest rate is fixed in the short term.

The results of fitting the improved equation are below. This shows that the new equation explains
almost 75% of the past variation in investment income. The coefficient on the unlagged variable is
still significant at a 1% level, and the coefficient on the lagged variable is just outside of a 1% level of
significance.

 Ordinary Least Squares Estimation
 *******************************************************************************
 Dependent variable is BDO_INC
 18 observations used for estimation from 2002 to
 2019
 *******************************************************************************
 Regressor Coefficient Standard Error T-Ratio[Prob]
 INPT 3.7776 2.2389 1.6873[.112]
 BRPP 11.3278 2.0997 5.3950[.000]
 BRPP(-1) 6.1011 2.0911 2.9176[.011]
 *******************************************************************************
 R-Squared .74648 R-Bar-Squared .71267
 S.E. of Regression 8.9707 F-Stat. F(2,15) 22.0829[.000]
 Mean of Dependent Variable -.79378 S.D. of Dependent Variable 16.7354
 Residual Sum of Squares 1207.1 Equation Log-likelihood -63.3913
 Akaike Info. Criterion -66.3913 Schwarz Bayesian Criterion -67.7268
 DW-statistic 1.9137
 *******************************************************************************

33
You can also read