2018 2021 Community Health Improvement Plan - Paulding County - Hospital Council of Northwest Ohio
←
→
Page content transcription
If your browser does not render page correctly, please read the page content below
2018            2021

 Paulding County
Community Health
Improvement Plan

  Adopted on 05.31.2018
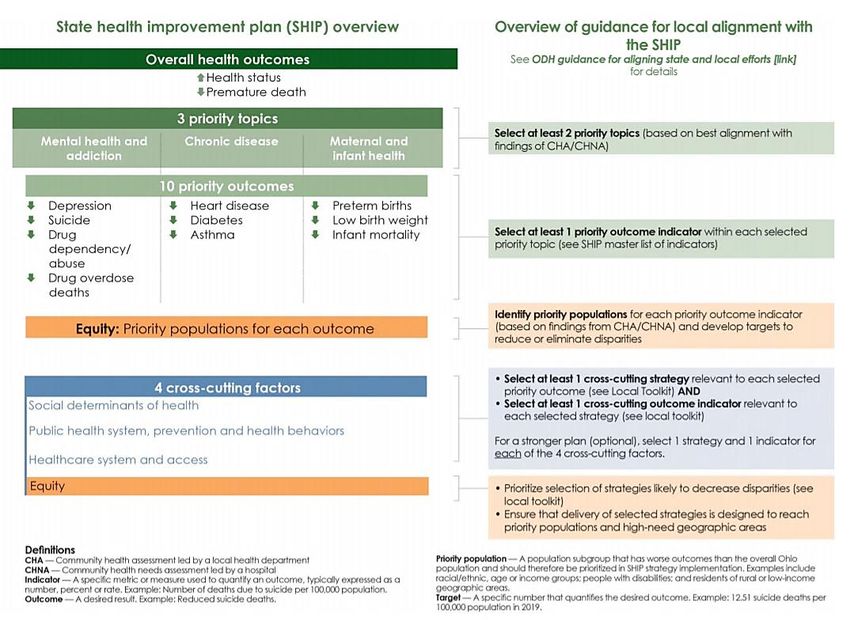
Table of Contents | Page 2
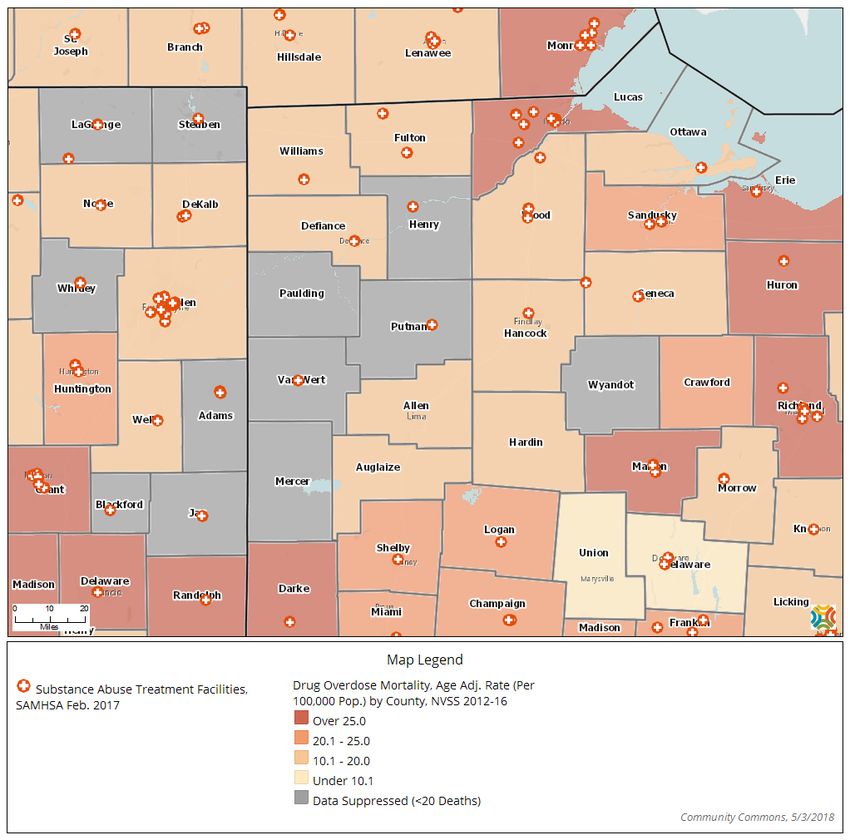
Table of Contents
Executive Summary .......................................................................................................................................................................... 4
   Partners ............................................................................................................................................................................................. 6
   Mission and Vision........................................................................................................................................................................ 7
   Alignment with National and State Standards .................................................................................................................. 7
   Action Steps ................................................................................................................................................................................. 12
Needs Assessment ......................................................................................................................................................................... 13
Priorities Chosen ............................................................................................................................................................................ 14
Forces of Change Assessment................................................................................................................................................... 15
Local Public Health System Assessment ............................................................................................................................... 16
Community Themes and Strengths Assessment ................................................................................................................ 18
Quality of Life Survey.................................................................................................................................................................... 19
Resource Assessment ................................................................................................................................................................... 20
Priority 1: Mental Health and Addiction ................................................................................................................................ 21
Priority 2: Chronic Disease .......................................................................................................................................................... 35
Priority 3: Sexual Behavior .......................................................................................................................................................... 41
Cross-cutting Strategies .............................................................................................................................................................. 44
Progress and Measuring Outcomes ........................................................................................................................................ 51
Appendix I: Links to Websites ................................................................................................................................................... 52

Note: Throughout the report, hyperlinks will be highlighted in bold, gold text. If using a hard
copy of this report, please see Appendix I for links to websites.

                                                                                                                                                                      Table of Contents | Page 3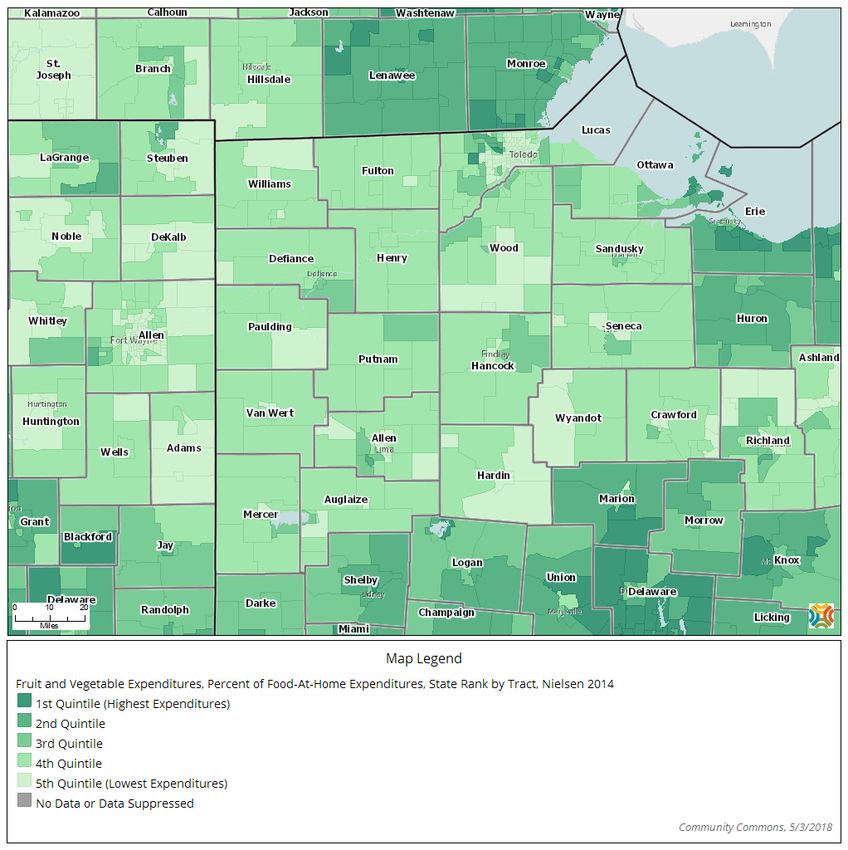
Executive Summary
In 2011, Paulding County Health Partners began conducting community health assessments (CHA) for
the purpose of measuring and addressing health status. The most recent Paulding County Community
Health Assessment was cross-sectional in nature and included a written survey of adolescents within
Paulding County. The questions were modeled after the survey instruments used by the Centers for
Disease Control and Prevention for their national and state Youth Risk Behavior Surveillance System
(YRBSS). This has allowed Paulding County to compare the data collected in their CHA to national, state
and local health trends.

The Paulding County CHA also fulfills national mandated requirements for the hospitals in our county.
H.R. 3590 Patient Protection and Affordable Care Act states that in order to maintain tax-exempt status,
not-for-profit hospitals are required to conduct a community health needs assessment at least once
every three years and adopt an implementation strategy to meet the needs identified through the
assessment.

From the beginning phases of the CHA, community leaders were actively engaged in the planning
process and helped define the content, scope, and sequence of the project. Active engagement of
community members throughout the planning process is regarded as an important step in completing a
valid needs assessment.

The Paulding County CHA has been utilized as a vital tool for creating the Paulding County Community
Health Improvement Plan (CHIP). The Public Health Accreditation Board (PHAB) defines a CHIP as a long-
term, systematic effort to address health problems on the basis of the results of assessment activities and
the community health improvement process. This plan is used by health and other governmental
education and human service agencies, in collaboration with community partners, to set priorities and
coordinate and target resources. A CHIP is critical for developing policies and defining actions to target
efforts that promote health. It should define the vision for the health of the community inclusively and
should be done in a timely way.

The Paulding County Health Department contracted with the Hospital Council of Northwest Ohio, a
neutral regional non-profit hospital association, to facilitate the process. The health department then
invited key community leaders to participate in an organized process of strategic planning to improve
the health of residents of the county. The National Association of City County Health Officer’s (NACCHO)
strategic planning tool, Mobilizing for Action through Planning and Partnerships (MAPP), was used
throughout this process.

The MAPP Framework includes six phases which are listed below:

   1.   Organizing for success and partnership development
   2.   Visioning
   3.   Conducting the MAPP assessments
   4.   Identifying strategic issues
   5.   Formulating goals and strategies
   6.   Taking action: planning, implementing, and evaluation

                                                                                      Executive Summary | Page 4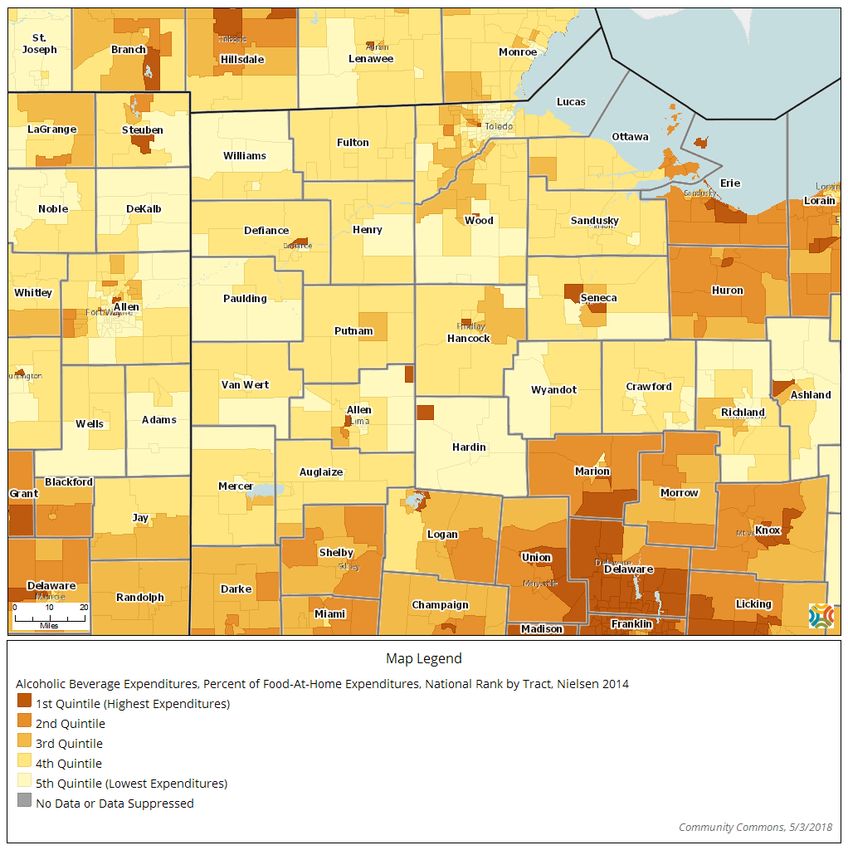
The MAPP process includes four assessments: Community Themes & Strengths, Forces of Change, the
Local Public Health System Assessment and the Community Health Status Assessment. These four
assessments were used by Paulding County Health Partners to prioritize specific health issues and
population groups which are the foundation of this plan. The diagram below illustrates how each of the
four assessments contributes to the MAPP process.
Figure 1.1 2018-2021 Paulding County CHIP Overview
Overall Health Outcomes
Increase Health Status Decrease Premature Death
Priority Topics
Mental Health and Addiction Chronic Disease Sexual Behavior
Priority Outcomes
Decrease youth depression Decrease youth obesity Reduce youth unprotected
Decrease youth suicide Decrease youth overweight sexual behavior
ideation
Decrease suicide deaths
Reduce youth non-prescribed
prescription drug use
Decrease unintentional drug
overdose deaths
Decrease youth alcohol use
Executive Summary | Page 5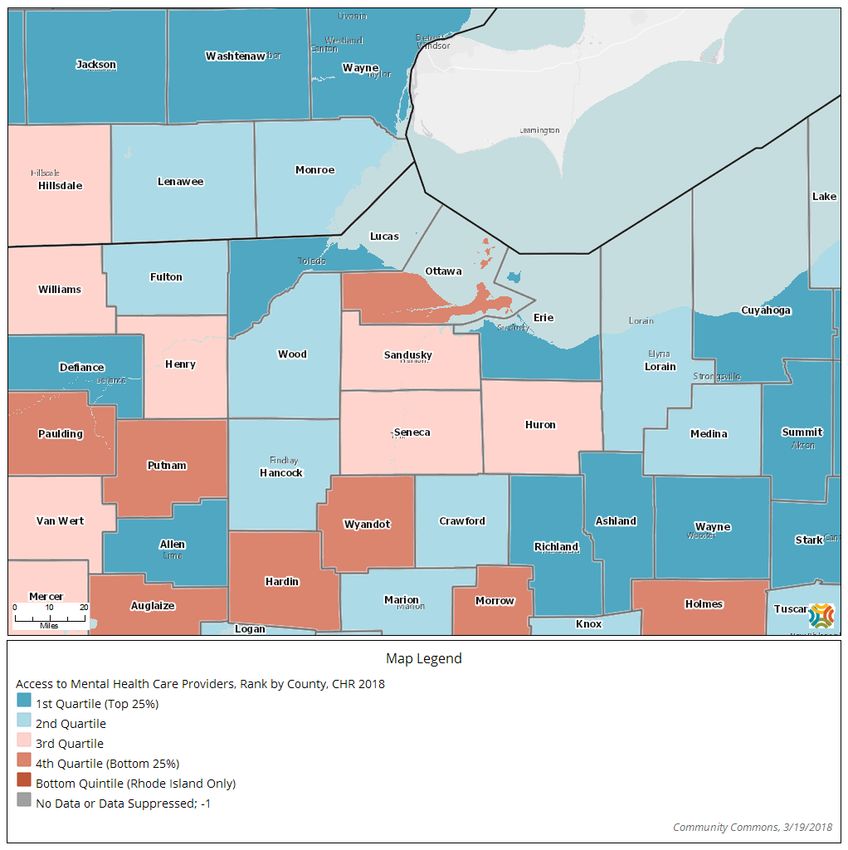
Partners
The 2018-2021 Community Health Improvement Plan was drafted by agencies and service providers
within Paulding County. From April 2018 to May 2018, the committee reviewed many sources of
information concerning the health and social challenges that Paulding County residents may be facing.
They determined priority issues which if addressed, could improve future outcomes; determined gaps in
current programming and policies; and examined best practices and solutions. The committee has
recommended specific strategies they hope many agencies and organizations will embrace to address
the selected priority issues in the coming months and years. We would like to recognize these individuals
and thank them for their devotion to this process and body of work:

Paulding County Health Partners
Jama Cline, Antwerp Local Schools
Tiffany Dargenson, Defiance/Paulding Consolidated JFS & Ohio Means Jobs Paulding County
Bill Edwards, Paulding County Health Department
Amber Gochenour, Paulding County Health Department
Mark Holtsberry, Paulding County Commissioner
Erika Lee, Ohio State University Extension
Rhonda Leininger, CHP Home Care & Hospice
Rebecca Michael, Northwestern Ohio Community Action Commission
Sherry Miller, Paulding County Women, Infants and Children
Naomi Nicely, Paulding County Hospital
Sabrina Roth, Wayne Trace Local Schools
Cathy Ruiz, Western Buckeye Educational Service Center
Ashley Shepherd, Western Buckeye Educational Service Center
Ashley Smith, Paulding County Hospital
Taryn Stiltner, United Way of Paulding County
Beth Stoller, Paulding Exempted Village Schools
Clint Vance, Paulding County Commissioner Candidate
Corey Walker, Job and Family Services
Marsha Yeutter, Paulding County Senior Center
Jerry Zieklke, Paulding County Economic Development

The community health improvement process was facilitated by Emily Golias, Community Health
Improvement Coordinator, from the Hospital Council of Northwest Ohio.

                                                                                    Executive Summary | Page 6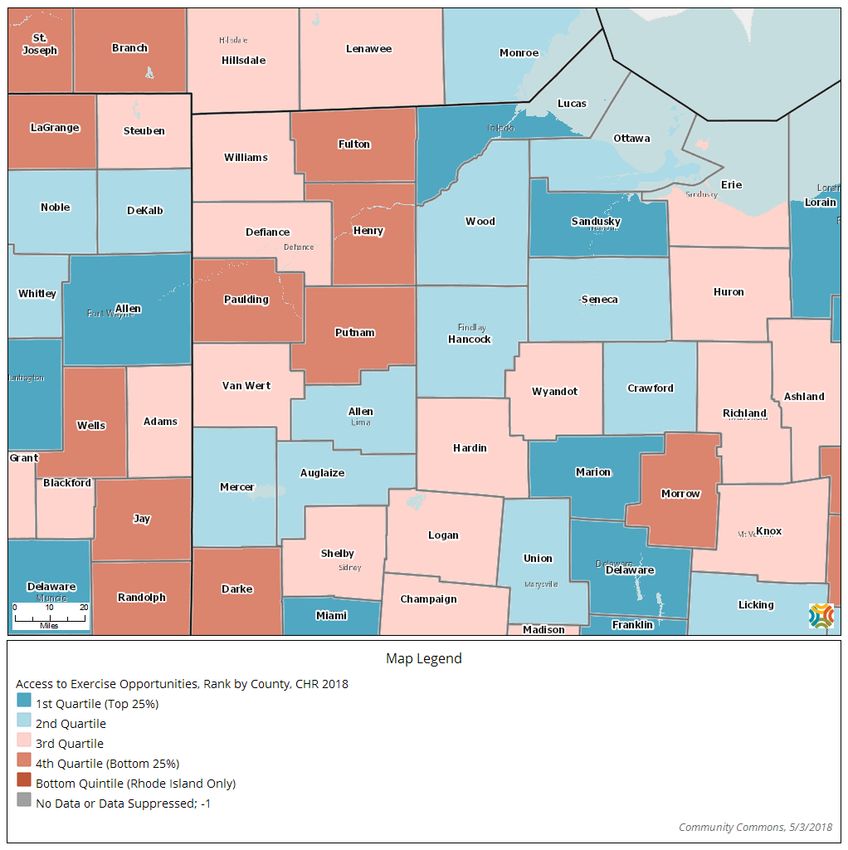
Mission and Vision
Vision statements define a mental picture of what a community wants to achieve over time while the
mission statement identifies why an organization/coalition exists and outlines what it does, who it does it
for, and how it does what it does.

The Mission of Paulding County
Working together to create a healthy Paulding County.

The Vision of Paulding County
Improving health and quality of life by mobilizing partnerships and taking strategic action in Paulding
County.

Alignment with National and State Standards
The 2018-2021 Paulding County CHIP priorities align with state and national priorities. Paulding County
will be addressing the following priorities: mental health and addiction, and chronic disease.

Ohio State Health Improvement Plan (SHIP)
Note: This symbol      will be used throughout the report when a priority, indicator, or strategy
directly aligns with the 2017-2019 SHIP.

The 2017-2019 State Health Improvement Plan (SHIP) serves as a strategic menu of priorities, objectives,
and evidence based strategies to be implemented by state agencies, local health departments, hospitals
and other community partners and sectors beyond health including education, housing, employers, and
regional planning.

The SHIP includes a strategic set of measurable outcomes that the state will monitor on an annual basis.
Given that the overall goal of the SHIP is to improve health and wellbeing, the state will track the
following health indicators:

   •   Self-reported health status (reduce the percent of Ohio adults who report fair or poor health)
   •   Premature death (reduce the rate of deaths before age 75)

In addition to tracking progress on overall health outcomes, the SHIP will focus on three priority topics:

   1. Mental health and addiction (includes emotional wellbeing, mental illness conditions and
      substance abuse disorders)
   2. Chronic Disease (includes conditions such as heart disease, diabetes and asthma, and related
      clinical risk factors-obesity, hypertension and high cholesterol, as well as behaviors closely
      associated with these conditions and risk factors- nutrition, physical activity and tobacco use)
   3. Maternal and Infant Health (includes infant and maternal mortality, birth outcomes and related
      risk and protective factors impacting preconception, pregnancy and infancy, including family and
      community contexts)

The SHIP also takes a comprehensive approach to improving Ohio’s greatest health priorities by
identifying cross-cutting factors that impact multiple outcomes: health equity, social determinants of
health, public health system, prevention and health behaviors, and healthcare system and access.

                                                                                       Executive Summary | Page 7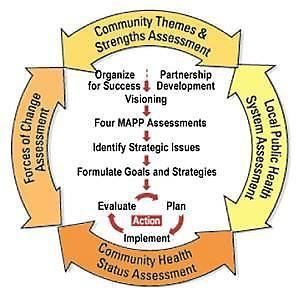
The 2018-2021 Paulding County CHIP is required to select at least 2 priority topics, 1 priority outcome
indicator, 1 cross cutting strategy and 1 cross-cutting outcome indicator to align with the 2017-2019
SHIP. The following Paulding County CHIP priority topics, outcomes and cross cutting factors very closely
align with the 2017-2019 SHIP priorities:

                     2018-2021 Paulding CHIP Alignment with the 2017-2019 SHIP
                                                              Cross-Cutting              Cross-Cutting
   Priority Topics           Priority Outcomes
                                                                 Factors                   Indicators
                        • Decrease youth depression
                        • Decrease youth suicide                                  • Increase social-
                          ideation                        • Social determinants     emotional skills
                        • Decrease suicide deaths           of health             • Reduce youth
  Mental Health and
                        • Reduce youth non-prescribed     • Public health system,   marijuana use
     Addiction
                          prescription drug use             prevention and health • Reduce youth non-
                        • Decrease unintentional drug       behaviors               prescribed
                          overdose deaths                                           prescription drug use
                        • Decrease youth alcohol use
                                                                                  • Increase social-
                                                          • Social determinants     emotional skills
                                                            of health             • Reduce youth
                        • Decrease youth obesity
   Chronic Disease                                        • Public health system,   marijuana use
                        • Decrease youth overweight
                                                            prevention and health • Reduce youth non-
                                                            behaviors               prescribed
                                                                                    prescription drug use
To align with and support mental health and addiction, Paulding County will work to screen for clinical
depression for all patients 12 or older using a standardized tool, and will implement school-based
alcohol/other drug prevention programs as a cross cutting factor.

To align with and support chronic disease, Paulding County will work to implement school-based
nutrition education programs and school-based social and emotional instruction as a cross cutting
factor.

U.S. Department of Health and Human Services National Prevention Strategies
The Paulding County Community Health Improvement Plan also aligns with four of the National
Prevention Strategies for the U.S. population: healthy eating, active living, mental and emotional well-
being and preventing drug abuse.

Healthy People 2020
Paulding County’s priorities also fit specific Healthy People 2020 goals. For example:

     •   Mental Health and Mental Disorders (MHMD)-1: Reduce the suicide rate
     •   Nutrition and Weight Status (NWS)-10: Reduce the proportion of children and adolescents
         who are considered obese.

The 3 Buckets of Prevention
The Paulding County CHIP considered strategies that would fit into each of the 3 Buckets of Prevention
and Population Health Framework (see Figure 1.3):

     •   Bucket 1: Increase the use of clinical preventive services.
     •   Bucket 2: Provide services that extend care outside the clinical setting.
     •   Bucket 3: Implement interventions that reach whole populations.

                                                                                         Executive Summary | Page 8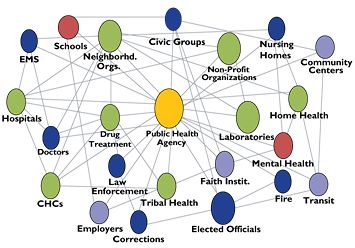
Alignment with National and State Standards, continued
Figure 1.2 2017-2019 State Health Improvement Plan (SHIP) Overview

                                                                     Executive Summary | Page 9
Alignment with National and State Standards, continued
Figure 1.3 The 3 Buckets of Prevention Overview

Source: Auerbach J. The 3 Buckets of Prevention. Journal of Public Health Management and Practice

                                                                                                    Executive Summary | Page 10
Strategic Planning Model
Beginning in April 2018, Paulding County Health Partners met two (2) times and completed the following
planning steps:
1. Initial Meeting: Review of process and timeline, finalize committee members, create or
review vision
2. Choosing Priorities: Use of quantitative and qualitative data to prioritize target impact areas
3. Ranking Priorities: Ranking the health problems based on magnitude, seriousness of
consequences, and feasibility of correcting
4. Resource Assessment: Determine existing programs, services, and activities in the
community that address the priority target impact areas and look at the number of programs
that address each outcome, geographic area served, prevention programs, and interventions
5. Forces of Change and Community Themes and Strengths: Open-ended questions for
committee on community themes and strengths
6. Gap Analysis: Determine existing discrepancies between community needs and viable
community resources to address local priorities; identify strengths, weaknesses, and
evaluation strategies; and strategic action identification
7. Local Public Health Assessment: Review the Local Public Health System Assessment with
committee
8. Quality of Life Survey: Review results of the Quality of Life Survey with committee
9. Best Practices: Review of best practices and proven strategies, evidence continuum, and
feasibility continuum
10. Draft Plan: Review of all steps taken; action step recommendations based on one or more of
the following: enhancing existing efforts, implementing new programs or services, building
infrastructure, implementing evidence based practices, and feasibility of implementation
Executive Summary | Page 11Action Steps
To work toward improving mental health and addiction outcomes, the following strategies are
recommended:
Mental Health
1. Screen for clinical depression for all patients 12 or older using a standardized tool
2. Increase awareness of Trauma Informed Care
Drug Use
1. Implement proper drug disposal programs
Alcohol Use
1. Implement the Parents Who Host Lose the Most campaign
To work toward improving chronic disease outcomes, the following strategies are recommended:
1. Increase healthy eating practices through fostering self-efficacy
2. Implement school-based nutrition education programs
To work toward decreasing risky sexual behaviors, the following strategies are recommended:
1. Increase awareness and availability of birth control
To address all priority areas, the following cross-cutting strategies are recommended:
1. Implement school-based social and emotional instruction
2. Implement school-based alcohol/other drug prevention programs
Executive Summary | Page 12Needs Assessment
The Paulding County Health Partners reviewed the 2018 Paulding County Youth Health Assessment. The
detailed primary data for each individual priority area can be found in the section it corresponds to. Each
member completed an “Identifying Key Issues and Concerns” worksheet. The following information were
the group results.
What are the most significant YOUTH health issues or concerns identified in the 2018 assessment
report? Examples of how to interpret the information include: 20% of all Paulding County had sexual
intercourse in their lifetime: 58% of those ages 17 and older, and 24% of females.
Percent of Age Group Gender
Key Issue or Concern Population at (or Grade Level) Most
Risk Most at Risk at Risk
Sexual behaviors (12 votes)
Age: 17+ (58%), Grade
Ever had sexual intercourse 20% Male (24%)
Level: 9-12 (35%)
Ever had oral sex 22% Age: 17+ (54%) Male (26%)
Had four or more sexual partners (of
34% N/A N/A
sexually active youth)
Did not use any method to prevent
13% Grade Level: 9-12 (12%) N/A
pregnancy during last sexual intercourse
Social media use (12 votes)
Had a social media account 91% N/A N/A
Believed sharing information online was N/A N/A
45%
dangerous
Drug Use (12 votes)
Age: 17+ (29%), Grade
Lifetime marijuana use 16% Male (18%)
Level: 9-12 (25%)
Ever misused prescription drugs 7% Grade Level: 9-12 (12%) Male (10%)
Mental Health (11 votes)
Felt sad or hopeless every day for two or Age: 17+ (41%), Grade
34% Female (42%)
more weeks in a row Level: 9-12 (37%)
Age: 17+ (25%), Grade
Seriously considered attempting suicide 19% Female (25%)
Level: 9-12 (22%)
Attempted suicide 9% Age: 17+ (12%) Female (11%)
Experienced 3 or more adverse
24% N/A N/A
childhood experiences (ACEs)
Obesity (10 votes)
Age: 17+ (22%), Grade N/A
Obese 18%
Level: 9-12 (20%)
Age: 17+ (15%), Grade Female (16%)
Overweight 13%
Level: 9-12 (15%)
Alcohol (9 votes)
Age: 17+ (49%), Grade
Current drinker 23% Male (26%)
Level: 9-12 (35%)
Binge Drinker (of current drinkers) 52% N/A N/A
Bullying (9 votes)
Bullied in the past year 41% N/A N/A
Needs Assessment | Page 13Priorities Chosen
Based on the 2018 Paulding County Youth Health Assessment, key issues were identified for youth.
Committee members then completed a ranking exercise, giving a score for magnitude, seriousness of the
consequence and feasibility of correcting, resulting in an average score for each issue identified.
Committee members’ rankings were then combined to give an average score for the issue.
The rankings were as follows:
Health Issue Average Score
Mental health 27.2
Drug use 26.3
Sexual behavior 24.6
Alcohol use 24.4
Bullying 23.5
Social media accounts 23.5
Weight status 22.8
Paulding County will focus on the following priority areas over the next three years:
1. Mental health and addiction (includes youth depression, suicide, drug use, and alcohol use)
2. Chronic disease (includes youth obesity)
3. Sexual behavior
Priorities Chosen | Page 14Forces of Change Assessment
Paulding County Health Partners were asked to identify positive and negative forces which could impact
community health improvement and overall health of this community over the next three years. This
group discussion covered many local, state, and national issues and change agents which could be
factors within Paulding County in the near future. The table below summarizes the forces of change
agent and its potential impacts.
Force of Change Potential Impact
• Could get accredited or if not, the health
1. PHAB
department could possibly close
• Certain areas receive extra funding and
2. Funding through windmills
others do not
• Mandates could be unfunded but still
3. Mandates
required to complete
4. Lack of funding/funding going away • No money to implement strategies
• Lack of access to services such as mental
5. Health insurance changes
health and primary care
6. Consolidation with Paulding and Defiance • Inconsistency in needs being met across
JFS counties
7. State JFS is not mandating nutrition
• Lack of education
education anymore
8. Changes in Medicaid • Changes affecting EBT/food stamps
• Changes in swing bed program at the
9. State legislation
hospital
10. Technology/social media • Negative effects in mental health
• Increase in drug addiction and access across
11. Opiates the state and county
• Increase in criminal justice and courts
12. Economic • Financial status of families and communities
• Lack of skills and resources
13. Generational poverty • Children do not have the knowledge to
escape generational poverty
Forces of Change Assessment | Page 15Local Public Health System Assessment
The Local Public Health System
Public health systems are commonly defined as “all
public, private, and voluntary entities that contribute to
the delivery of essential public health services within a
jurisdiction.” This concept ensures that all entities’
contributions to the health and well-being of the
community or state are recognized in assessing the
provision of public health services.
The public health system includes:
• Public health agencies at state and local levels
• Healthcare providers
• Public safety agencies
• Human service and charity organizations
• Education and youth development organizations
• Recreation and arts-related organizations
• Economic and philanthropic organizations
• Environmental agencies and organizations
The 10 Essential Public Health Services
The 10 Essential Public Health Services describe the public health activities that all communities should
undertake and serve as the framework for the NPHPS instruments.
Public health systems should:
1. Monitor health status to identify and solve community health problems.
2. Diagnose and investigate health problems and health hazards in the community.
3. Inform, educate, and empower people about health issues.
4. Mobilize community partnerships and action to identify and solve health problems.
5. Develop policies and plans that support individual and community health efforts.
6. Enforce laws and regulations that protect health and ensure safety.
7. Link people to needed personal health services and assure the provision of health care when
otherwise unavailable.
8. Assure competent public and personal health care workforce.
9. Evaluate effectiveness, accessibility, and quality of personal and population-based health services.
10. Research for new insights and innovative solutions to health problems.
(Source: Centers for Disease Control; National Public Health Performance Standards; The Public
Health System and the 10 Essential Public Health Services)
Local Public Health System Assessment | Page 16The Local Public Health System Assessment (LPHSA) answers the questions, "What are the components,
activities, competencies, and capacities of our local public health system?" and "How are the Essential
Services being provided to our community?"
This assessment involves the use of a nationally recognized tool called the National Public Health
Performance Standards Local Instrument.
Members of the Paulding County Health Department completed the performance measures instrument.
The LPHSA results were then presented to the full CHIP committee for discussion. The 10 Essential Public
Health Services and how they are being provided within the community as well as each model standard
was discussed and the group came to a consensus on responses for all questions. The challenges and
opportunities that were discussed were used in the action planning process.
The CHIP committee identified 9 indicators that had a status of “minimal” and 8 indicator that had a
status of “no activity.” The remaining indicators were all moderate, significant or optimal.
As part of minimum standards, local health departments are required to complete this assessment at
least once every five years.
To view the full results of the LPHSA, please contact Bill Edwards from the Paulding County Health
Department at bille@pcohhd.com.
Paulding County Local Public Health System Assessment 2018 Summary
Summary of Average ES Performance Score
0.0 20.0 40.0 60.0 80.0 100.0
Average Overall Score 64.6
ES 1: Monitor Health Status 54.2
ES 2: Diagnose and Investigate 91.7
ES 3: Educate/Empower 77.8
ES 4: Mobilize Partnerships 79.2
ES 5: Develop Policies/Plans 68.8
ES 6: Enforce Laws 83.1
ES 7: Link to Health Services 78.1
ES 8: Assure Workforce 61.5
ES 9: Evaluate Services 41.7
ES 10: Research/Innovations 10.4
Local Public Health System Assessment | Page 17Community Themes and Strengths Assessment
Paulding County Health Partners participated in an exercise to discuss community themes and strengths.
The results were as follows:
1. What do you believe are the 2-3 most important characteristics of a healthy community?
• Excellent education system • Access to health care, including mental
• Community recreation health
• A caring, tight-knit community • Mentoring groups
• Community collaboration • Classes and programs
• Community involvement • Senior centers
• Employment • Faith-based community
• Resources • Culture and heritage
2. What makes you most proud of our community?
• Caring, tight-knit community • Culture and heritage
• Community comes together during crisis and • Faith-based community
hardship • Education system
3. What are some specific examples of people or groups working together to improve the
health and quality of life in our community?
• Area Foundation • Activate
• United Way • Senior center
• Church ministries • School programs, such as career programs
• Paulding County Health Partners • Hospital, such as health fairs
• Paulding Health Plan
4. What do you believe are the 2-3 most important issues that must be addressed to improve the health
and quality of life in our community?
• Mental health and addiction, such as • Sexual behavior
depression, alcohol, and drug use • Opiates
• Chronic disease, such as obesity • Job training to meet the needs of employers
5. What do you believe is keeping our community from doing what needs to be done to improve health
and quality of life?
• Unqualified workers • Lack of mental health board presence
• Money to support programs • Transportation
• Resources • Food deserts
6. What actions, policy, or funding priorities would you support to build a healthier community?
• Community collaboration • Increased transportation
• Capitalizing on available resources • Grant writing
• Regional medical center in Antwerp • External services and referrals
• Food availability • PHAB accreditation
7. What would excite you enough to become involved (or more involved) in improving our community?
• Results • Accountability
• Collaboration • PHAB
Community Themes and Strengths | Page 18Quality of Life Survey
Paulding County Health Partners urged community members to fill out a short quality of life survey via
Survey Monkey. There were 97 Paulding County community members who completed the survey. The
anchored Likert scale responses were converted to numeric values ranging from 1 to 5, with 1 being
lowest and 5 being highest. For example, an anchored Likert scale of “Very Satisfied” = 5, “Satisfied” = 4,
“Neither Satisfied or Dissatisfied” = 3, “Dissatisfied” = 2, and “Very Dissatisfied” = 1. For all responses of
“Don’t Know,” or when a respondent left a response blank, the choice was a non-response, was assigned
a value of 0 (zero) and the response was not used in averaging response or calculating descriptive
statistics.
Likert Scale
Quality of Life Questions Average
Response
1. Are you satisfied with the quality of life in our community? (Consider your sense
of safety, well-being, participation in community life and associations, etc.) [IOM, 3.13
1997]
2. Are you satisfied with the health care system in the community? (Consider
2.87
access, cost, availability, quality, options in health care, etc.)
3. Is this community a good place to raise children? (Consider school quality, day
3.32
care, after school programs, recreation, etc.)
4. Is this community a good place to grow old? (Consider elder-friendly housing,
transportation to medical services, churches, shopping; elder day care, social 3.11
support for the elderly living alone, meals on wheels, etc.)
5. Is there economic opportunity in the community? (Consider locally owned and
operated businesses, jobs with career growth, job training/higher education 2.48
opportunities, affordable housing, reasonable commute, etc.)
6. Is the community a safe place to live? (Consider residents’ perceptions of safety
in the home, the workplace, schools, playgrounds, parks, and the mall. Do 3.32
neighbors know and trust one another? Do they look out for one another?)
7. Are there networks of support for individuals and families (neighbors, support
groups, faith community outreach, agencies, or organizations) during times of 3.14
stress and need?
8. Do all individuals and groups have the opportunity to contribute to and
3.24
participate in the community’s quality of life?
9. Do all residents perceive that they — individually and collectively — can make
2.69
the community a better place to live?
10. Are community assets broad-based and multi-sectoral? (There are a variety of
2.53
resources and activities available county-wide)
11. Are levels of mutual trust and respect increasing among community partners as
2.89
they participate in collaborative activities to achieve shared community goals?
12. Is there an active sense of civic responsibility and engagement, and of civic pride
in shared accomplishments? (Are citizens working towards the betterment of 2.76
their community to improve life for all citizens?)
Quality of Life Survey | Page 19Resource Assessment
Based on the chosen priorities, Paulding County Health Partners were asked to complete a resource
inventory for each priority. The resource inventory allowed the committee to identify existing community
resources, such as programs, exercise opportunities, free or reduced cost health screenings, and more.
The committee was then asked to determine whether a program or service was evidence-based, a best
practice, or had no evidence indicated based on the following parameters:
An evidence-based practice has compelling evidence of effectiveness. Participant success can be
attributed to the program itself and have evidence that the approach will work for others in a different
environment. A best practice is a program that has been implemented and evaluation has been
conducted. While the data supporting the program is promising, its scientific rigor is insufficient. A non-
evidence based practice has no documentation that it has ever been used (regardless of the principals
it is based upon) nor has it been implemented successfully with evaluation.
Each resource assessment can be found at the following websites:
http://www.pauldingcountyhealth.com
Resource Assessment | Page 20Priority 1: Mental Health and Addiction
Mental Health Indicators
Adult Mental Health
There were 15 suicide deaths in Paulding County from 2013-2017. The age-adjusted death rate is 19.9
per 100,000 population.1
Youth Mental Health
Just over one-third (34%) of youth reported they felt so sad or hopeless almost every day for two weeks or
more in a row that they stopped doing some usual activities, increasing to 42% of females (YRBS reported
26% for Ohio in 2013 and 30% for the U.S. in 2015).2
Almost one in five (19%) youth reported they had seriously considered attempting suicide in the past 12
months, increasing to 25% of females and youth ages 17 and older (2013 YRBS reported 14% for Ohio
and 18% for the U.S. in 2015).2
Nine percent (9%) of Paulding County youth had attempted suicide. The 2015 YRBS reported a suicide
attempt prevalence rate of 9% for U.S. youth and a 2013 YRBS rate of 6% for Ohio youth.2
Almost one-quarter (24%) of youth experienced three or more adverse childhood experiences (ACEs).2
Just over two-fifths (41%) of youth were bullied in the past year.2
Eight percent (8%) of youth were cyber bullied, or bullied by electronic means.2
The table below indicates correlations between those who contemplated suicide in the past 12 months and
participating in risky behaviors, as well as other activities and experiences. Examples of how to interpret
the information include: 67% of those who contemplated suicide were bullied in the past 12 months,
compared to 35% of those who did not contemplate suicide.
Behaviors of Paulding County Youth2
Contemplated Suicide vs. Did Not Contemplate Suicide
Did Not
Contemplated
Youth Behaviors Contemplate
Suicide
Suicide
Bullied (in the past 12 months) 67% 35%
Experienced 3 or more adverse childhood experiences (ACEs) (in
55% 16%
their lifetime)
Used marijuana (in their lifetime) 44% 9%
Have had at least one drink of alcohol (in the past 30 days) 43% 19%
Had sexual intercourse (in their lifetime) 35% 16%
Smoked cigarettes (in the past 30 days) 25% 3%
“Contemplated suicide” indicates youth who self-reported seriously considering attempting suicide in the past year.
1
Source: Ohio Department of Health Ohio Public Health Data Warehouse, 2013-2017.
2
Source: 2018 Paulding County Youth Health Assessment.
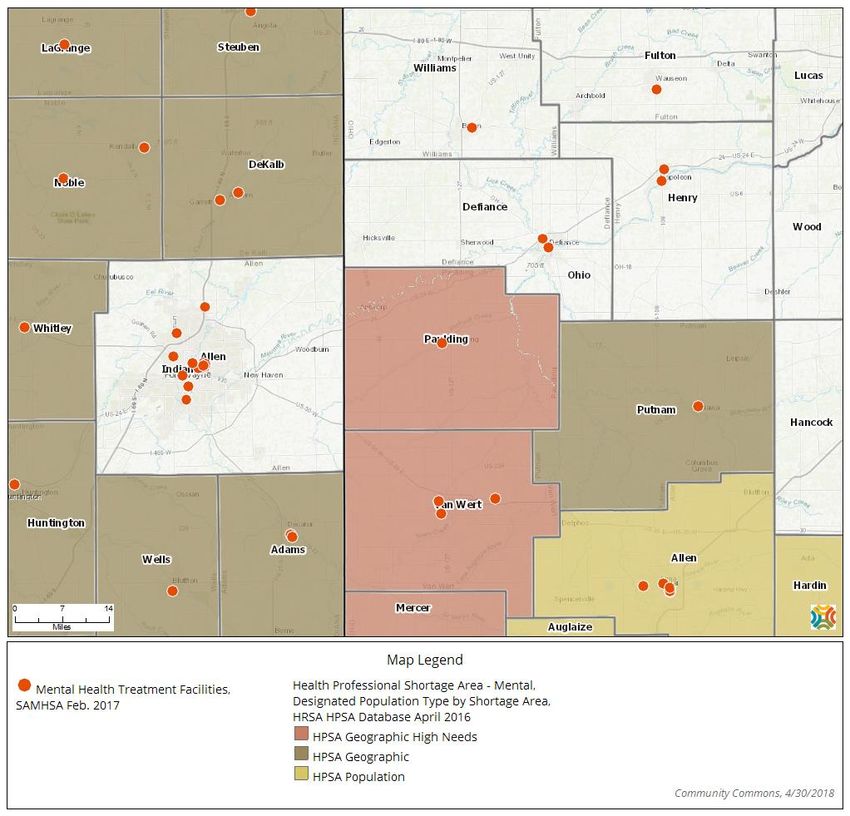
Priority 1: Mental Health and Addiction | Page 21Map: Health Professional Shortage Area
Health Professional Shortage Area - Mental, HRSA HPSA Database April 2016
Source: US Department of Health & Human Services, Health Resources and Services Administration, Health Resources and Services
Administration: April 2016, as compiled by Community Commons; US Department of Health and Human Services, Substance Abuse and Mental
Health Services Administration: Feb. 2017, as compiled by Community Commons.
Priority 1: Mental Health and Addiction | Page 22Map: Access to Mental Health Care Providers
Access to Mental Health Care Providers, Rank by County, CHR 2018
Source: University of Wisconsin Population Health Institute, County Health Rankings: 2018, as compiled by Community Commons.
Priority 1: Mental Health and Addiction | Page 23Gaps and Potential Strategies
Gaps Potential Strategies
• More collaboration among agencies
1. Lack of resources • Education
• Funding
• Discuss mental health issues with the Director of the
2. Lack of guidance for mental health
Tri-County ADAMH Board
services
• Increase collaboration with the ADAMH Board
3. Lack of available services for mental • Telemedicine with providers
health counseling • Collaborate with nearby counties
4. Lack of education regarding mental • Programs in schools
health issues • Community education
Best Practices
The following programs and policies have been reviewed and have proven strategies to improve mental
health:
1. PHQ-9: The PHQ-9 is the nine-item depression scale of the Patient Health Questionnaire. The PHQ-9
is a powerful tool for assisting primary care clinicians in diagnosing depression as well as selecting and
monitoring treatment. The primary care clinician and/or office staff should discuss with the patient the
reasons for completing the questionnaire and how to fill it out. After the patient has completed the PHQ-
9 questionnaire, it is scored by the primary care clinician or office staff.
There are two components of the PHQ-9:
• Assessing symptoms and functional impairment to make a tentative depression diagnosis
• Deriving a severity score to help select and monitor treatment
The PHQ-9 is based directly on the diagnostic criteria for major depressive disorder in the Diagnostic and
Statistical Manual Fifth Edition (DSM-V).
2. Trauma-informed care: Trauma informed care (TIC) is a framework that requires change to
organizational practices, policies, and culture that reflect an understanding of the widespread impact of
trauma and potential paths for recovery, and actively seek to prevent re-traumatization. In health care,
TIC usually includes universal trauma precautions and practice changes for patients with a known trauma
history. Universal trauma precautions emphasize patient-centered communication and care, often with
careful screening for trauma, safe clinical environments (e.g., quiet waiting areas), and shared decision
making for all patients. Under a trauma-informed clinical approach, providers collaborate across
disciplines, use streamlined referral pathways, and remain aware of their own trauma histories and stress
levels when they know patients have experienced trauma. TIC can also be implemented in oral health
settings.
Priority 1: Mental Health and Addiction | Page 24Action Step Recommendations & Plan
To work toward improving mental health, the following strategies are recommended:
1. Screen for clinical depression for all patients 12 or older using a standardized tool
2. Increase awareness of Trauma Informed Care
Action Plan
Priority Topic: Mental Health
Strategy 1: Screen for clinical depression for all patients 12 or older using a standardized tool
Priority Person/
Action Step Priority Outcome & Indicator Timeline
Population Agency Responsible
Year 1: Collect baseline data on the number of hospital
emergency departments, urgent care centers, and primary
care providers (including pediatricians) that currently screen Priority Outcomes:
for depression during visits. 1. Reduce the number of suicide June 1,
deaths 2019
Introduce the Patient Health Questionnaire (PHQ-9), or
2. Reduce youth depression
another screening tool, to healthcare providers. Pilot the
screening tool with at least one hospital, urgent care center,
Priority Indicators: Ashley Smith,
or primary care office. Adult and
1. Number of deaths due to suicide Paulding County
Year 2: Continue efforts from year 1. Increase the number youth
per 100,000 populations (age Hospital June 1,
of healthcare providers using PHQ-9, or another screening
adjusted) 2020
tool, by 25% from baseline.
2. Percent of youth who felt so sad
Year 3: Continue efforts from years 1 and 2. Increase the
or hopeless almost every day for two
number of healthcare providers using PHQ-9, or another
weeks or more in a row that they June 1,
screening tool, by 50% from baseline.
stopped doing usual activities 2021
Explore the feasibility of implementing annual mental
health screenings in the school setting.
Priority 1: Mental Health and Addiction | Page 25Priority Topic: Mental Health
Strategy 2: Increase awareness of Trauma Informed Care
Priority Person/
Action Step Priority Outcome & Indicator Timeline
Population Agency Responsible
Year 1: Facilitate an assessment among healthcare Priority Outcomes:
providers, teachers, coaches, social service providers, and 1. Reduce the number of suicide
other community members on their awareness and Cathy Ruiz,
deaths
understanding of trauma informed care, including toxic Western Buckeye ESC June 1,
2. Reduce suicide ideation in youth
stress and adverse childhood experiences. 2019
Taryn Stiltner,
Administer a training to increase education and Priority Indicator:
Adult and United Way of
understanding of trauma informed care. 1. Number of deaths due to suicide
youth Paulding County
Year 2: Continue efforts from year 1. Develop and per 100,000 populations (age
implement a trauma screening tool for social service adjusted) June 1,
Megan Tuttle,
agencies who work with at-risk adults and youth. Increase 2. Percent of youth who report that
Westwood Behavioral 2020
the use of trauma screening tools by 25%. they ever seriously considered
Health Center
Year 3: Continue efforts from years 1 and 2. Increase the attempting suicide within the past June 1,
use of trauma screening tools by 50%. 12 months 2021
Priority 1: Mental Health and Addiction | Page 26Drug Use Indicators
Adult Drug Use
From 2013-2017, there were 8 resident drug overdose deaths in Paulding County.1
There were 3 prescription opiate-related unintentional drug overdose deaths in Paulding County from
2013-2017.2
Youth Drug Use
Sixteen percent (16%) of all Paulding County youth had used marijuana at least once in their lifetime,
increasing to 29% of those ages 17 and older (YRBS reports 36% for Ohio in 2013 and 37% for the U.S. in
2015). Of those youth who reported using marijuana in their lifetime, 25% used the substance 100 times
or more.3
Seven percent (7%) of youth used medications that were not prescribed for them or took more than
prescribed to get high at some time in their life (YRBS reports 17% for the U.S. in 2015).3
In the past 12 months, 5% of youth reported being offered, sold, or given an illegal drug on school
property (YRBS reports 20% for Ohio in 2013 and 22% for the U.S. in 2015).3
The table below indicates correlations between lifetime marijuana use and participating in risky behaviors,
as well as other activities and experiences. Examples of how to interpret the information include: 95% of
marijuana users participated in extracurricular activities, compared to 90% of non-marijuana users.
Behaviors of Paulding County Youth3
Lifetime Marijuana Use vs. Non-Lifetime Marijuana Use
Non-
Lifetime
Lifetime
Youth Behaviors Marijuana
Marijuana
Use
Use
Currently participate in extracurricular activities 95% 90%
Had sexual intercourse (in their lifetime) 72% 10%
Have had at least one drink of alcohol (in the past 30 days) 64% 16%
Experienced 3 or more adverse childhood experiences (ACEs) (in their lifetime) 63% 17%
Felt sad or hopeless for two or more weeks in a row (in the past 12 months) 59% 29%
Bullied (in the past 12 months) 54% 38%
Seriously considered attempting suicide (in the past 12 months) 54% 13%
Misused medications (in their lifetime) 36% 2%
Smoked cigarettes (in the past 30 days) 34% 2%
Attempted suicide (in the past 12 months) 27% 6%
“Lifetime marijuana use” indicates youth who self-reported using marijuana at any time during the past 12 months.
1
Source: Paulding County Health Department, 2013-2017.
2
Source: Ohio Department of Health Ohio Public Health Data Warehouse, 2013-2017.
3
Source: 2018 Paulding County Youth Health Assessment.
Priority 1: Mental Health and Addiction | Page 27Map: Drug Overdose Mortality
Drug Overdose Mortality, Rate (Per 100,000 Population) by County, NVSS 2012-2016
Source: Centers for Disease Control and Prevention, National Vital Statistics System: 2012-16. Accessed via CDC WONDER; US Department of
Health and Human Services, Substance Abuse and Mental Health Services Administration: Feb. 2017; as compiled by Community Commons.
Priority 1: Mental Health and Addiction | Page 28Gaps and Potential Strategies
Gaps Potential Strategies
• More collaboration among agencies
1. Lack of resources • Education
• Funding
• Discuss substance abuse issues with the Director of
2. Lack of guidance for substance abuse
the Tri-County ADAMH Board
services
• Increase collaboration with the ADAMH Board
3. Lack of available services for substance • Telemedicine with providers
abuse counseling • Collaborate with nearby counties
4. Lack of education regarding substance • Programs in schools
abuse issues • Community education
Best Practices
The following programs and policies have been reviewed and have proven strategies to improve
addiction:
1. Proper drug disposal programs: Proper drug disposal programs accept expired, unwanted, or
unused medicines from designated users and dispose of them responsibly. Programs can use in-person
drop-offs, mail-in efforts, or permanent secure collection receptacles and can be administered by state or
local governments, municipal trash and recycling services, pharmacies, hospitals, clinics, or community
organizations partnered with law enforcement. A 2014 amendment to the federal Controlled Substances
Act allows the US Drug Enforcement Administration (DEA) to register authorized collectors of controlled
substances, allowing collection of pharmaceutical controlled and non-controlled substances, but not
illicit drugs.
Expected Beneficial Outcomes (
• Reduced illicit drug use
• Reduced unintentional poisoning
• Reduced water pollution
• Improved water quality
Other Potential Beneficial Outcomes
• Increased appropriate drug disposal
Priority 1: Mental Health and Addiction | Page 29Action Step Recommendations & Plan
To work toward reducing drug use, the following strategies are recommended:
1. Implement proper drug disposal program
Action Plan
Priority Topic: Drug Use
Strategy 1: Implement proper drug disposal programs
Priority Person/
Action Step Priority Outcome & Indicator Timeline
Population Agency Responsible
Year 1: Increase awareness of prescription drug abuse and
Priority Outcomes:
the locations of existing prescription drug collection
1. Reduce unintentional drug
boxes. Encourage local pharmacies to provide information June 1,
overdose deaths Taryn Stiltner,
on prescription drug abuse and collection locations. 2019
2. Reduce youth non-prescribed United Way of
Work with local law enforcement to sponsor and host prescription drug use Paulding County
prescription drug take-back days.
Adult and
Year 2: Host at least two additional prescription drug take- Priority Indicators:
youth Rebecca Michael,
back-days and increase participation. 1. Number of deaths dues to June 1,
Northwestern Ohio
Increase the number of prescription drug collection sites in unintentional drug overdoses per 2020
Community Action
Paulding County by 25% from baseline. 100,000 population (age adjusted) Commission
Year 3: Continue to host prescription drug take-back-days. 2. Percent of youth who used
prescription drugs not prescribed June 1,
Increase the number of prescription drug collection sites in 2021
to them in the past 30 days
Paulding County by 50% from baseline.
Priority 1: Mental Health and Addiction | Page 30Alcohol Use Indicators
Youth Alcohol Use
Almost one-quarter (23%) of youth had at least one drink in the past 30 days, increasing to 49% of those
ages 17 and older (YRBS reports 30% for Ohio in 2013 and 33% for the U.S. in 2015).1
Based on all youth surveyed, 12% had five or more alcoholic drinks on an occasion in the last month and would be
considered binge drinkers, increasing to 30% of those ages 17 and older (YRBS reports 16% for Ohio in 2013 and
18% for the U.S. in 2015).1
Of those who drank, 52% were defined as binge drinkers, increasing to 61% of those ages 17 and older.1
More than one-third (34%) of current drinkers reported that their parent gave them alcohol. 1
The table below indicates correlations between current drinkers and participating in risky behaviors, as well
as other activities and experiences. Examples of how to interpret the information include: 95% of current
drinkers participated in extracurricular activities, compared to 89% of non-current drinkers.
Behaviors of Paulding County Youth
Current Drinkers vs. Non-Current Drinkers
Non-
Youth Behaviors Current Current
Drinker Drinker
Currently participate in extracurricular activities 95% 89%
Felt sad or hopeless for two or more weeks in a row (in the past 12 months) 56% 27%
Had sexual intercourse (in their lifetime) 51% 9%
Bullied (in the past 12 months) 49% 38%
Experienced 3 or more adverse childhood experiences (ACEs) (in their lifetime) 44% 17%
Used marijuana (in their lifetime) 44% 7%
Seriously considered attempting suicide (in the past 12 months) 36% 15%
Smoked cigarettes (in the past 30 days) 24% 2%
Misused medications (in their lifetime) 23% 2%
Attempted suicide (in the past 12 months) 13% 8%
“Current drinkers” indicate youth who self-reported having had at least one drink of alcohol during the past 30 days.
1
Source: 2018 Paulding County Youth Health Assessment.
Priority 1: Mental Health and Addiction | Page 31Map: Alcoholic Beverage Expenditures
Alcoholic Beverage Expenditures, Percent of Food-At-Home Expenditures, National Rank, Nielsen 2014
Source: Nielsen, Nielsen SiteReports: 2014 as compiled by Community Commons.
Priority 1: Mental Health and Addiction | Page 32Gaps and Potential Strategies
Gaps Potential Strategies
• More collaboration among agencies
1. Lack of resources • Education
• Funding
• Discuss substance abuse issues with the Director of
2. Lack of guidance for substance abuse
the Tri-County ADAMH Board
services
• Increase collaboration with the ADAMH Board
3. Lack of available services for substance • Telemedicine with providers
abuse counseling • Collaborate with nearby counties
4. Lack of education regarding substance • Programs in schools
abuse issues • Community education
Best Practices
The following programs and policies have been reviewed and have proven strategies reduce alcohol
use:
1. Mass media campaigns against underage & binge drinking: Mass media campaigns utilize
television, radio, print, and social media to increase adult awareness of underage drinking and its
consequences. Campaigns may also include efforts to provide adults with the knowledge and skills to
take actions that help prevent underage drinking.
Expected Beneficial Outcomes (Rated)
• Reduced underage drinking
• Reduced excessive drinking
Other Potential Beneficial Outcomes
• Increased adult awareness of underage drinking
Priority 1: Mental Health and Addiction | Page 33Action Step Recommendations & Plan
To work toward reducing youth alcohol use, the following strategies are recommended:
1. Implement the Parents Who Host Lose the Most campaign
Action Plan
Priority Topic: Alcohol Use
Priority Outcome & Priority Person/
Action Step Timeline
Indicator Population Agency Responsible
Strategy 1: Implement the Parents Who Host Lose the Most campaign
Year 1: Obtain baseline data on which areas of the county
Priority Outcome:
are implementing the Parents Who Host Lose the Most June 1,
Reduce youth alcohol use Naomi Nicely, Paulding
campaign and what strategies they are using, such as signs, 2019
County Hospital
social media, events, etc.
Priority Indicator:
Year 2: Create a public service announcement (PSA) for the Youth
Percent of youth who drank Taryn Stiltner, June 1,
campaign and create awareness of the danger of youth
one or more drinks of an United Way of Paulding 2020
alcohol use.
alcoholic beverage in the County
Year 3: Strengthen the message and efforts of the Parents past 30 days June 1,
Who Host Lose the Most campaign. 2021
Priority 1: Mental Health and Addiction | Page 34Priority 2: Chronic Disease
Chronic Disease Indicators
Youth Obesity
Nearly one-fifth (18%) of Paulding County youth were classified as obese by Body Mass Index (BMI)
calculations (YRBS reported 13% for Ohio in 2013 and 14% for the U.S. in 2015).1
Thirteen percent (13%) of youth were classified as overweight (2013 YRBS reported 16% for Ohio and
2015 YRBS reported 16% for the U.S.).1
The following graph shows the percentage of Paulding County youth who were classified as obese, overweight,
normal weight or underweight according to Body Mass Index (BMI) by age. Examples of how to interpret the
information in the graph include: 67% of all Paulding County youth were classified as normal weight, 18% were
obese, 13% were overweight, and 2% were underweight for their age and gender.
Paulding County Youth BMI Classifications
2% 3% 1% 5% 1% 0% 3%
100%
80%
65% 64% 63%
67% 69% 67%
60% 73%
40%
14% 15%
13% 11% 16% 13%
20%
11%
18% 18% 18% 21% 22% 18%
11%
0%
Total Male Female 13 or younger 14 to 16 17 & Older Paulding 2011
Obese Overweight Normal Weight Underweight
Note: Caution should be used when interpreting subgroup results as the margin of error for any subgroup is higher than that of the overall
survey.
1
Source: 2018 Paulding County Youth Health Assessment.
Priority 2: Chronic Disease | Page 35Map: Access to Exercise Opportunities
Access to Exercise Opportunities, Rank by County, CHR 2018
Sources: University of Wisconsin Population Health Institute, County Health Rankings: 2018 as compiled by Community Commons
Priority 2: Chronic Disease | Page 36Map: Fruit and Vegetable Expenditures
Fruit and Vegetable Expenditures, Percent of Food-At-Home Expenditures, State Rank by Tract,
Nielsen 2014
Sources: Nielsen, Nielsen SiteReports: 2014; USDA 2017, as compiled by Community Commons
Priority 2: Chronic Disease | Page 37Gaps and Potential Strategies
Gaps Potential Strategies
1. Food desserts • Work with economic development
2. Access to health care • Research
• Community gardens
• Increase awareness of available services
3. Education • Community programs
• Education in schools
• SNAP
4. Denial • Education
Best Practices
The following programs and policies have been reviewed and have proven strategies to reduce chronic
disease:
1. School-Based Obesity Prevention Interventions: School-based obesity prevention programs seek to
increase physical activity and improve nutrition before, during, and after school.
Programs combine educational, behavioral, environmental, and other components such as health and
nutrition education classes, enhanced physical education and activities, promotion of healthy food
options, and family education and involvement. Specific components vary by program.
Expected Beneficial Outcomes
• Increased physical activity
• Increased physical fitness
• Improved weight status
• Increased consumption of fruit & vegetables
2. Cooking Matters (No Kid Hungry Center for Best Practices): Cooking Matters hands-on courses
empower families with the skills to be self-sufficient in the kitchen. In communities across America,
participants and volunteer instructors come together each week to share lessons and meals with each
other.
Courses meet for two hours, once a week for six weeks and are team-taught by a volunteer chef and
nutrition educator. Lessons cover meal preparation, grocery shopping, food budgeting and nutrition.
Participants practice fundamental food skills, including proper knife techniques, reading ingredient
labels, cutting up a whole chicken, and making a healthy meal for a family of four on a $10 budget.
Adults and teens take home a bag of groceries after each class so they can practice the recipes taught
that day.
Community partners that serve low-income families offer six-week Cooking Matters courses to adults,
kids and families. Share Our Strength provides seven specialized curricula that cover nutrition and
healthy eating, food preparation, budgeting and shopping. Cooking Matters’ culinary and nutrition
volunteers teach these high-quality, cooking-based courses at a variety of community-based agencies—
including Head Start centers, housing centers and after-school programs—with neighborhood locations
that make it easy for families to attend.
Priority 2: Chronic Disease | Page 38You can also read