2019-2020 Influenza Update for Long-term Care and Assisted Living Partners
←
→
Page content transcription
If your browser does not render page correctly, please read the page content below

2019-2020 Influenza Update for Long-term Care
        and Assisted Living Partners
               Karen Martin, MPH – Influenza Surveillance
           Mary Ellen Bennett, MPH, RN, CIC – Infection Control
               Jennifer Heath, DNP, MPH, RN – Vaccination
                     Michelle Dittrich, MPH – FluSafe

                             January 7, 2020

                             WWW.H EA L TH. M N. GO V             1
INFLUENZA ACTIVITY UPDATE
     Karen Martin, MPH
                            2
Weekly Influenza & Respiratory
   Illness Activity Report
  A summary of influenza surveillance indicators prepared by the Division of Infectious Disease Epidemiology Prevention & Control

            Week Ending December 28, 2019 | WEEK 52
                               All data are preliminary and may change as more information is received

                                     Minnesota Influenza Geographic Spread
                           No Activity
                                                                          During the week ending December 28, 2019 (Week 52),
                                                                                       surveillance indicators showed
                             Sporadic
                                                                                widespread geographic spread of influenza
                                                                                    (based on CDC’s Activity Estimates Definitions).
                               Local
                                                                                    Since the start of the influenza season,
                             Regional                                                no pediatric influenza-related deaths
                                                                                             have been reported.
                           Widespread

  Minnesota Influenza Surveillance (http://www.health.state.mn.us/divs/idepc/diseases/flu/stats/)
  Weekly U.S. Influenza Surveillance Report (http://www.cdc.gov/flu/weekly/)
  World Health Organization (WHO) Surveillance (http://www.who.int/influenza/surveillance_monitoring/updates/en/)
  Neighboring states’ influenza information:
        Iowa: Iowa Flu Reports (http://idph.iowa.gov/influenza/reports)
         Wisconsin: Influenza (Flu) (http://www.dhs.wisconsin.gov/communicable/influenza/)
         North Dakota: Reported Seasonal Influenza Activity in North Dakota (http://www.ndflu.com/default.aspx)
         South Dakota: South Dakota Influenza Information (http://doh.sd.gov/diseases/infectious/flu/)

                                                   Minnesota Department of Health
                                                   651-201-5414 or 1-877-676-5414                                                      3
                                                   www.health.state.mn.us                                               1/2/2020
Hospitalized Influenza Surveillance
Hospitalized influenza cases are based on disease reports of laboratory-positive influenza (via DFA, IFA, viral culture, EIA, rapid test, paired
serological tests or RT-PCR) and specimens from hospitalized patients with acute respiratory illness submitted to MDH-PHL by hospitals and
laboratories. Due to the need to confirm reports and reporting delays, consider current week data preliminary.

                                          Hospitalized Influenza Cases by Type                                           Hospitalized Influenza Cases by Season, Minnesota
                                              Minnesota (FluSurv-NET*)                                                                     (FluSurv-NET*)
                              200
                                                                                 B (no genotype)                                   750
                                                                                                                                               2014-15
                              180                                                B (Yamagata)                                      700
                                                                                                                                   650         2015-16
                                                                                 B (Victoria)

                                                                                                      Number of Hospitalizations
                              160                                                                                                  600         2016-17
 Number of Hospitalizations

                                                                                 A (not subtyped)
                                                     Current week                                                                  550         2017-18
                                                                                 A H3
                              140                                                                                                  500
                                                                                 A H1 (unspecified)                                            2018-19
                                                                                                                                   450
                                                                                 A (H1N1)pdm09                                     400         2019-20
                              120
                                                                                 A (H1N2v)                                         350
                                                                                                                                                           Current week
                              100                                                A (H3N2v)                                         300
                                                                                 A&B                                               250
                              80                                                 Unknown                                           200
                                                                                                                                   150
                              60                                                                                                   100
                                                                                                                                    50
                              40                                                                                                     0
                                                                                                                                         40 42 44 46 48 50 52 2   4   6   8 10 12 14 16 18 20
                              20
                                                                                                                                                         MMWR Week
                               0                                                                                                                                  Total hospitalizations
                                                                                                                                     Season
                                    40 42 44 46 48 50 52 2       4   6   8 10 12 14 16 18 20                                                                            (historic)
                                                                                                                                   2014-2015                              4,081
                                                        MMWR Week
                                                                                                                                   2015-2016                              1,538
                  Hospitalizations                   Hospitalizations       Total hospitalizations                                 2016-2017                              3,695
                    this week                          last week                   (to date)                                       2017-2018                              6,446
                                                                                                                                   2018-2019                              2,543
                                    117                    114                       505                                           2019-2020                          505 (to date)
*Influenza Surveillance Network                                                                                                                                                                 4
Hospitalized Influenza Surveillance (continued)
Number of Influenza Hospitalizations and Incidence by Number of Influenza Hospitalizations and Incidence by
Region, Minnesota Age, Minnesota
September 29, 2019 – December 28, 2019 September 29, 2019 – December 28, 2019
# of hospitalizations 500 # of hospitalizations 50.0
500 50.0
Hospitalizations per 100,000 Persons
Hospitalizations per 100,000 Persons
450 45.0 450 45.0
Number of Hospitalizations
Number of Hospitalizations
Incidence (cases) per 400 Incidence (cases) per 40.0
400 100,000 Persons
40.0 100,000 Persons
350 35.0 350 35.0
300 30.0 300 30.0
250 25.0 250 25.0
200 20.0 18.3
11.6 200 15.8 20.0
150 15.0
8.1 150 15.0
100 6.9 10.0 8.3
5.2 5.1 4.5 5.1 7.4
2.9 100 10.0
50 5.0 4.8
0 0.0 50 5.0
0 0.0
0-4 5-24 25-49 50-64 65+
Region Age Group (years)
Hospitalizations Total Median age (years)
Region
this week (to date) at time of admission
Central 18 (15%) 62 (12%)
50.0
Metro 72 (62%) 359 (71%)
Northeast 10 (9%) 17 (3%)
Northwest 1 (1%) 11 (2%)
South Central 6 (5%) 15 (3%)
Southeast 7 (6%) 23 (5%)
Southwest 2 (2%) 11 (2%)
West Central 1 (1%) 7 (1%) 5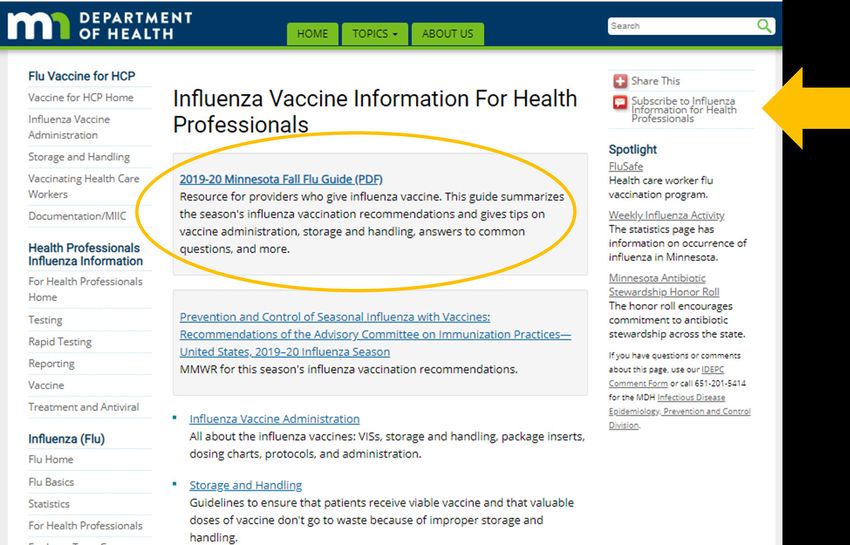
Influenza-Associated Death Surveillance
  Influenza deaths are collected via reports from Minnesota’s death certificate database, hospitals, and long-term care facilities. Decedents with
  influenza listed as a cause of or contributor to death, have recent laboratory confirmation of influenza, or are part of an ongoing influenza
  outbreak at a long-term care facility are reported to influenza surveillance. Due to the need to confirm reports and reporting delays, consider
  current week data preliminary.
          Deaths Associated with Influenza by Season, Minnesota                                              Deaths Associated with Influenza by Age Group and
                                                                                                                            Season, Minnesota
                      60                                                                                     300
                                  2014-15                                                                                 2014-15   2015-16    2016-17    2017-18     2018-19   2019-20
                                  2015-16
                      50
Number of Deaths

                                  2016-17                                                                    250

                                  2017-18

                                                                                          Number of Deaths
                      40                                                                                     200
                                  2018-19
                                  2019-20
                      30                                                                                     150

                      20                                                                                     100
                                            Current week
                      10                                                                                      50

                       0                                                                                       0
                            40 42 44 46 48 50 52 2     4    6   8 10 12 14 16 18 20                                     0-17        18-49         50-64             65-79        80+
                                                MMWR Week                                                                                   Age Group (years)

                                 Total deaths        Total pediatric (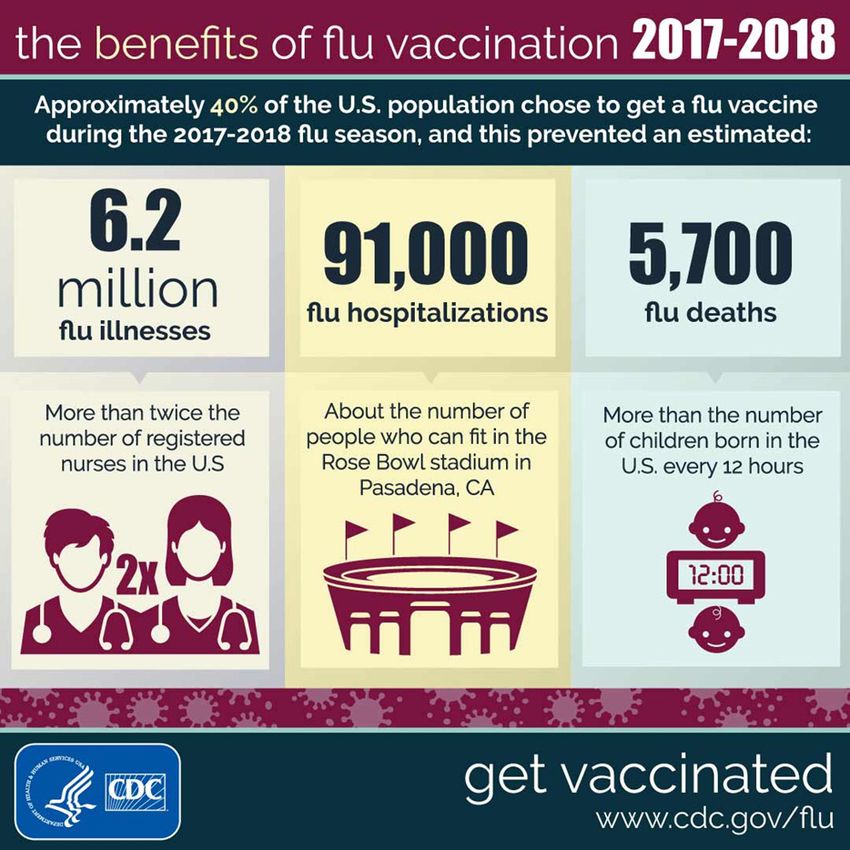
Respiratory Disease Outbreak Surveillance
School Outbreaks
K-12 schools report an outbreak of influenza-like illness (ILI) when the number of students absent with ILI reaches 5% of total enrollment or
three or more students with ILI are absent from the same elementary classroom.

                                                                                 Influenza-like Illness (ILI) in Schools by Season

                                             300
Number of Influenza-like Illness Outbreaks

                                             250                                                                                                                           2014-15
                                                                                                                                                                           2015-16
                                                                                                                                                                           2016-17
                                             200
                                                                                                                                                                           2017-18
                                                                                                                                                                           2018-19
                                             150
                                                                                              Current week                                                                 2019-20

                                             100

                                             50

                                              0
                                                   40 41 42 43 44 45 46 47 48 49 50 51 52         1   2      3    4    5   6   7   8   9   10 11 12 13 14 15 16 17 18 19 20

                                                                                                      MMWR Week

                                                       New school outbreaks this week          New school outbreaks last week                    Total this season (to date)

                                                                     0                                           173                                        299
                                                                                                                                                                                     7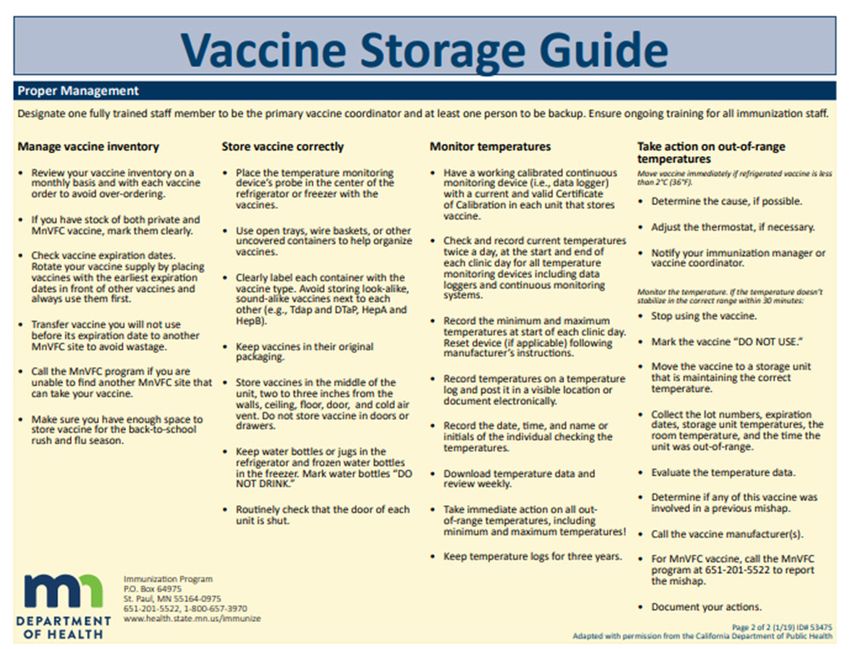
Respiratory Disease Outbreak Surveillance (continued)

Long-Term Care (LTC) Outbreaks
LTC facilities report to MDH when they suspect an outbreak of influenza in their facility. Laboratory-confirmed outbreaks are reported here.

                                                                       Confirmed Influenza Outbreaks in LTC by Season

                                    40

                                    35                                                                                                                       2014-15
Number of lab-confirmed outbreaks

                                                                                                                                                             2015-16
                                    30                                                                                                                       2016-17
                                                                                                                                                             2017-18
                                    25
                                                                                                                                                             2018-19
                                                                                                                                                             2019-20
                                    20

                                    15

                                    10                                      Current week

                                     5

                                     0
                                         40 41 42 43 44 45 46 47 48 49 50 51 52             1   2   3   4   5   6   7    8   9   10 11 12 13 14 15 16 17 18 19 20
                                                                                            MMWR Week

                                              New LTC outbreaks this week                  New LTC outbreaks last week                 Total this season (to date)

                                                          0                                             2                                          9
                                                                                                                                                                       8
Sentinel Provider Surveillance (Outpatients)
MDH collaborates with healthcare providers who report the total number of patients seen and the total number of those patients presenting to
outpatient clinics with influenza-like illness.

                                                    Percentage of Persons Presenting to Outpatient Clinics with Influenza-Like Illness (ILI)

                                        9
                                                                                                                                                                                2014-15
                                        8
                                                                                                                                                                                2015-16
                                                                                          Current week*
  Percent with Influenza-like Illness

                                        7                                                                                                                                       2016-17
                                                                                                                                                                                2017-18
                                        6                                                                                                                                       2018-19

                                        5                                                                                                                                       2019-20

                                        4

                                        3

                                        2

                                        1

                                        0
                                            40 41 42 43 44 45 46 47 48 49 50 51 52                 1 2 3 4           5   6   7       8   9   10 11 12 13 14 15 16 17 18 19 20
                                                                                                    MMWR Week

                                                    % of outpatients with ILI this week        % of outpatients with ILI last week
                                                                                                                                              * Indicates current week-data may be delayed
                                                                   5.8%                                       5.4%                              by 1 or more weeks
                                                                                                                                                                                             9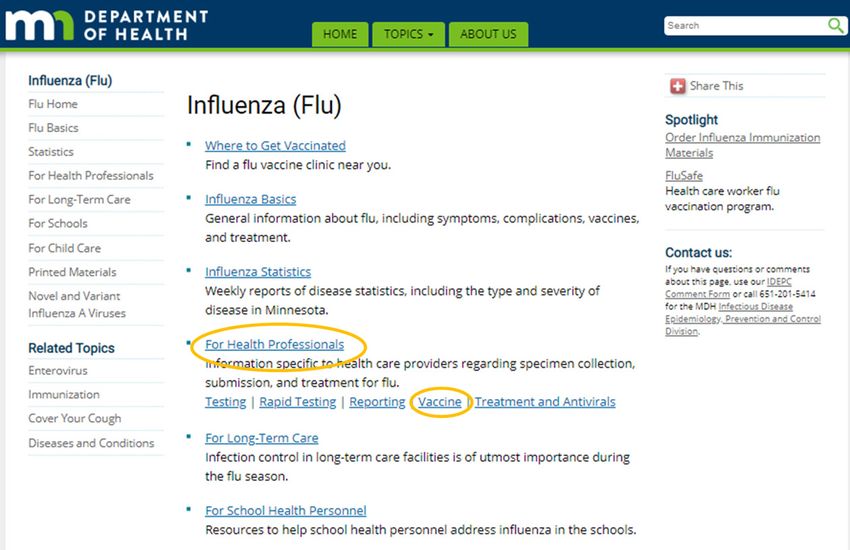
Laboratory Surveillance
The MN Lab System (MLS) Laboratory Influenza Surveillance Program is made up of more than 310 clinic- and hospital-based laboratories,
voluntarily submitting testing data weekly. These laboratories perform rapid testing for influenza and Respiratory Syncytial Virus (RSV).
Significantly fewer labs perform PCR testing for influenza and three also perform PCR testing for other respiratory viruses. MDH-PHL provides
further characterization of submitted influenza isolates to determine the hemagglutinin serotype to indicate vaccine coverage. Tracking the
laboratory results assists healthcare providers with patient diagnosis of influenza-like illness and provides an indicator of the progression of the
influenza season as well as prevalence of disease in the community.

                                                                   Specimens Positive for Influenza by Molecular Testing*, by Week

                                       1000                                                                                                                                           50
                                        950           B
                                        900           A (not subtyped)                                                                                                                45
                                                                                              Current week
                                        850
  Number of Positive Molecular Tests

                                                      A H3
                                        800                                                                                                                                           40
                                                      A (H1N1) pdm09

                                                                                                                                                                                           Percent of Positive Molecular Tests
                                        750
                                        700           2014-15 % + by PCR                                                                                                              35
                                        650           2015-16 % + by PCR
                                        600                                                                                                                                           30
                                                      2016-17 % + by PCR
                                        550
                                        500           2017-18 % + by PCR                                                                                                              25
                                        450           2018-19 % + by PCR
                                        400                                                                                                                                           20
                                                      2019-20 % + by PCR
                                        350
                                        300                                                                                                                                           15
                                        250
                                        200                                                                                                                                           10
                                        150
                                        100                                                                                                                                           5
                                         50
                                          0                                                                                                                                           0
                                              40 41 42 43 44 45 46 47 48 49 50 51 52      1     2   3   4    5   6   7   8   9   10 11 12 13 14 15 16 17 18 19 20
                                                                                               MMWR Week

                                                % molecular tests positive this week   % molecular tests positive last week
                                                                                                                                      * Beginning in 2016-17, laboratories report
                                                                                                                                        results for rapid molecular influenza tests
                                                               30.5%                                    25.3%
                                                                                                                                        in addition to RT-PCR results
                                                                                                                                                                                                                                 10
Laboratory Surveillance (continued)
MLS Laboratories – Influenza Testing MLS Laboratories – RSV Testing
Specimens Positive by Influenza Rapid Antigen Test, by Week Specimens Positive by RSV Rapid Antigen Test, by Week
B+ Number +
200 100
A+ 50 2016-17 %+
Percentage of Rapid Antigen Influenza Tests Positive
90
Number of Positive Influenza Specimens
A/B+ 2017-18 %+
1,000 Current week 45 175
2016-17 %+ 2018-19 %+ 80
40 150
Number of Positive RSV Tests
2017-18 %+ 2019-20 %+
800 70
2018-19 %+ 35
125
2019-20 %+ 60
30
600 Current week
100 50
25
40
20 75
400
30
15
50
20
200 10
25
5 10
0 0 0 0
40 42 44 46 48 50 52 2 4 6 8 10 12 14 16 18 20 40 42 44 46 48 50 52 2 4 6 8 10 12 14 16 18 20
MMWR Week MMWR Week
% rapid antigen influenza tests + % rapid antigen RSV tests +
Region Region
(current week) (current week)
Central 32% Central 29%
Metro 33% Metro 25%
Northeast 27% Northeast 28%
Northwest 35% Northwest 14%
South Central 16% South Central 43%
Southeast 34% Southeast 47%
Southwest 33% Southwest 28%
West Central --- West Central 67%
State (overall) 32% State (overall) 29% 11Identifying and Reporting Influenza Outbreaks
Identifying an Outbreak
▪ Outbreak definition: at least two residents with onset of influenza-like illnesses within
72 hours of each other AND at least one resident has laboratory-confirmed influenza.
Reporting an Outbreak to MDH
▪ Submit a Long-Term Care Facility Influenza and RSV Report Form, 2019-20
(https://www.health.state.mn.us/diseases/flu/ltc/ltcreport.pdf) to MDH by email or
fax when an influenza outbreak is identified in your LTC facility. Please call 651-201-
5924 if you have questions regarding reporting or influenza outbreak control
measures.
12Sign Up for Weekly Influenza Updates
Weekly Influenza & Respiratory
Activity: Statistics
(https://www.health.state.mn.us/
diseases/flu/stats/index.html)
13INFLUENZA INFECTION PREVENTION – ICAR PROGRAM
Mary Ellen Bennett, MPH, RN, CIC
14Infection Prevention
▪ Influenza characteristics
▪ Surveillance
▪ Isolation
▪ Prevention
▪ Tools for management
▪ References
15Influenza Characteristics in Elderly Persons
Disease Presentation
▪ Influenza-like illness (ILI) in elderly persons may be atypical
▪ New onset of cough, sore throat, nasal congestion or rhinorrhea, or a temperature 100° F or
greater; however, fever may be absent
▪ Atypical complaints: anorexia, mental status changes, and unexplained fever may be the
presenting symptoms
Disease Presentation in General Population
▪ Fever or feeling feverish/chills, cough, sore throat, runny or stuffy nose, muscle or body aches,
headaches, fatigue (tiredness)
16Influenza in the Elderly: Complications and Transmission
Complications:
▪ Worsening respiratory status: (residents with COPD or CHF)
▪ Primary viral pneumonia and bacterial suprainfection (leading to tracheobronchitis or
pneumonia)
Transmission
▪ Large respiratory droplets (particles >5 µ in diameter) expelled from resp. tract
▪ Close contact (< 3 feet) usually is required for transmission
▪ Direct contact with respiratory droplets or secretions
▪ Touching the nose or mouth
17Influenza in the Elderly: Incubation and Duration
Incubation
▪ 1 to 4 days, usually 2 days
Contagiousness (or Infectious Period)
▪ 24 hours prior to onset of illness to at least 5 days after onset of symptoms
▪ Immunocompromised shed virus for 7 days or more after onset of symptoms
Duration
▪ 1-2 weeks with severe symptoms in the first few days
18Surveillance for Influenza & ILI in LTC Facilities
▪ Residents are monitored for illness on a routine basis
▪ Clusters of illness or infection can be detected by this type of
monitoring
▪ A log of illnesses and infection is kept by nursing staff
▪ Influenza and influenza-like illness can be kept on the routine
tracking forms or the facility can use a special influenza tracking
form from MDH
19Infection and Antibiotic Use Tracking Tool (Appendix L)
Minnesota Antimicrobial Stewardship Program Toolkit for Long-term Care Facilities
(https://www.health.state.mn.us/diseases/antibioticresistance/hcp/asp/ltc/index.html) 20Influenza-like Illness (ILI) Line List – Do not submit to MDH
Minnesota Antimicrobial Stewardship Program Toolkit for Long-term Care Facilities
(https://www.health.state.mn.us/diseases/antibioticresistance/hcp/asp/ltc/index.html) 21Isolation for Influenza and Influenza-Like Illness (ILI)
▪ A resident should be put into isolation presumptively when symptoms
present, because it may take a couple of days for test results to come
back. This action will limit spread of the virus to others in the facility.
▪ A resident with influenza symptoms should wear a simple face mask
when they leave their room for care. This is in accordance with the
recommendations from CDC for Droplet Precautions.
22Standard and Droplet Precautions
▪ Standard precautions: use for all patients
▪ Droplet precautions: use with standard precautions for residents with known or
suspected influenza or influenza-like illness
▪ Precautions should be in place for the duration of the symptoms of illness
▪ Best to have a private room if available – can cohort ill persons
▪ Post sign
▪ Procedure mask: correct don/doff procedure
▪ Care of patient care equipment – clean all equipment going in and out of room
▪ Hand hygiene
CDC: Isolation Precautions
(https://www.cdc.gov/infectioncontrol/guidelines/isolation/index.html)
23Transmission-Based Precautions
▪ Identify the type of precautions and the appropriate PPE to be used.
▪ Place signage in a conspicuous place outside the resident’s room such as
the door or on the wall next to the doorway. Ensure that signage also
complies with residents’ rights to confidentiality and privacy.
▪ Make PPE readily available near the entrance to the resident’s room.
▪ Don appropriate PPE upon entry into the room of resident on Droplet
Precautions.
24Enforce Correct Mask Use
▪ Hand hygiene before and after touching (masks are
contaminated)
▪ Follow instructions for donning and removal by type of
mask (i.e., ear loops, ties)
▪ Do not wear around the neck, on an ear, on top of the
head, or re-use between residents
▪ Provide easy access to masks, alcohol hand sanitizer, and
waste receptacles
APIC: Do’s & Don’ts for wearing procedure masks in non-surgical
healthcare settings (PDF)
(http://www.apic.org/Resource_/TinyMceFileManager/consumers
_professionals/APIC_DosDontsofMasks_hiq.pdf)
25Prevention – Employee Illness
▪ Offer vaccination to all employees throughout the season
▪ Vaccinate new employees who start during the season
▪ Staff should know the symptoms of influenza so they can recognize it in themselves and the
residents
▪ Enforce staff not working when they are sick
▪ Staff should know that they can be infectious 1 day before they exhibit classic symptoms of
influenza
▪ Encourage staff to notify managers if they do develop an influenza-like illness
26Prevention – Visitors Entering the Facility
▪ Post signs at entry to restrict ill visitors
▪ Publish visitor restriction notices to the local community
▪ Limit visitor movement in facility
▪ Alcohol hand rubs at entry with signage
▪ Cover your cough signs
▪ Stop! Help Protect Our Residents Poster
(https://www.health.state.mn.us/people/cyc/stopres.html)
▪ Encourage visitors to get a flu shot
27Prevention – Visiting the Ill Resident
▪ Limit visiting to persons necessary for the resident’s well-being and
care
▪ Hand hygiene before entering, after leaving the resident’s room
▪ Instruct visitors how to wear and dispose of PPE as per facility policy
▪ Instruct visitors to not visit other residents before removing PPE (if
worn) and perform hand hygiene
28Prevention – Visiting Restrictions
▪ Stronger measures can be implemented at the
digression of the facility during an influenza
outbreak
▪ For instance:
▪ Alerting visitors about the outbreak
▪ Restricting visiting for children
▪ Screening all visitors for illness before visiting
29Tools – MDH Tip Sheet
▪ Before an Outbreak Occurs
▪ Identifying an Outbreak
▪ Reporting an Outbreak to MDH
▪ Testing
▪ Monitor
▪ Control
▪ Additional Control Measures to Consider
▪ Treatment
▪ Chemoprophylaxis
Interim Guidance for Influenza Outbreak Management in Long-Term Care Facilities (PDF)
(https://www.health.state.mn.us/diseases/flu/ltc/intguide.pdf)
30Tools – Signs: Droplet Precautions
▪ New CDC Droplet Precaution
isolation sign
CDC: Droplet Precautions (PDF)
(https://www.cdc.gov/infectioncontrol/pdf/droplet-precautions-
sign-P.pdf)
31References
▪ MDH: Influenza (Flu) (www.mdhflu.com)
▪ MDH: Minnesota Immunization Information Connection (MIIC)
(https://www.health.state.mn.us/miic)
▪ CDC: Influenza (Flu) (www.cdc.gov/flu/)
32INFLUENZA VACCINE
Jennifer Heath, DNP, MPH, RN
33Storage and Handling of Flu Vaccine
▪ Maintenance of temperature is critical to the vaccine’s viability and
effectiveness
▪ Loss of inventory, thousands of dollars even with a modest amount of vaccine
▪ Colder is not better
▪ Especially vulnerable to freezing temperatures
▪ CDC’s guidance recently changed, ideal temperature is 40F or 4.4C
▪ Temperature monitoring
▪ Several options for monitoring
▪ Temps recorded by a human twice per day
▪ Utilize MDH’s resources linked in the Fall Flu Guide.
34Essential Resource
Vaccine Storage Guide (PDF) (https://www.health.state.mn.us/people/immunize/hcp/vaxhandling.pdf)
35Vaccine Information Statements (VIS)
▪ Must be presented to all patients
▪ Interim published 8/15/2019
▪ Can use up old stock
▪ Give English along with other
languages
▪ Immunization Action Coalition:
Vaccine Information Statements
(https://www.immunize.org/vis)
36Documenting Flu Vaccine
Required by Federal Law:
Published date of the VIS
The date the VIS was given to the patient
Name, address (office address) and title of the person who administers the vaccine
The date the vaccine is administered
The vaccine manufacturer and lot number of each dose administered
Good Practice:
Site
Route
37Influenza Screening Form
▪ Available in Microsoft
Word
▪ Modify to your own
policy
▪ Contains required
documentation
elements
38Vaccination of Residents
▪ Continue to vaccinate
▪ Vaccine protects against 3 or 4 strains
▪ Second doses not recommended
▪ Standard, high-dose, or adjuvanted– no preference
▪ Be mindful of proper administration techniques
▪ Frail patients may require “bunching” or a shorter needle length for IM
administration
▪ Obese patents may require a longer needle length
▪ Use the Minnesota Immunization Information Connection (MIIC)
(https://www.health.state.mn.us/miic)
39Vaccination of Health Care Personnel (HCP)
▪ Continue to vaccinate
▪ New employees, former decliners
▪ If you cannot provide vaccine refer employees to other sources: pharmacy, clinic,
community vaccinator
▪ Vaccination Clinics Serving Uninsured and Underinsured Adults
(https://www.health.state.mn.us/people/immunize/basics/uuavsearch.html)
▪ Consider your educational resources
▪ Tailor to a lay audience
▪ Seek out translations (or interpreters)– even if proficient in English
▪ Use the Minnesota Immunization Information Connection (MIIC)
(https://www.health.state.mn.us/miic)
40CDC MMWR: Influenza Vaccination Coverage Among Health Care Personnel – United States
2017-18 Influenza Season (https://www.cdc.gov/mmwr/volumes/67/wr/mm6738a2.htm)
41CDC: 2017-2018 Estimated Influenza Illnesses, Medical Visits, and Hospitalizations Averted by Vaccination
in the United States (https://www.cdc.gov/flu/vaccines-work/averted-estimates.htm) 42Flu Vaccine Works!
▪ Reduces hospitalization and death
▪ By 51% for children with underlying medical conditions and by 65% for
healthy children (Flannery et al, 2017)
▪ Reduces the severity of illness in hospitalized individuals
▪ Keeps patients out of ICU (Thompson et al, 2018)
▪ Reduces loss of independence in adults
▪ Influenza can cause “catastrophic disability”
▪ Protects pregnant women and their babies
▪ Reduces illness by 50%, very high risk group (Thompson et al, 2019)
43How can we be more compelling?
▪ Keep it simple
▪ The risks of flu are significant:
▪ Loss of independence for the elderly
▪ Danger for infants, children, and pregnant women
▪ Healthy adults are impacted as well
▪ Acknowledge that not every case will be prevented
▪ Protecting our patients and each other against flu is a standard of
care
44Finding the Flu and Vaccine Materials
Influenza (Flu)
www.mdhflu.com
45Influenza For Health Professionals
Influenza Vaccine Information
For Health Professionals
(https://www.health.state.mn.us
/diseases/flu/hcp/vaccine/index.
html)
46FLUSAFE UPDATE
Michelle Dittrich, MPH
47FluSafe Facilities
FluSafe Facilities
(https://www.health.state.mn.us/
diseases/flu/hcp/vaccine/flusafef
ac.html)
48ANTIVIRAL TREATMENT AND CHEMOPROPHYLAXIS
Karen Martin, MPH
49Why Use Antiviral Medications?
▪ Antiviral medications reduce illness and severe outcomes
of influenza based on evidence from randomized
controlled trials, meta-analyses of randomized controlled
trials, and observational studies.
CDC: Influenza Antiviral Medications (https://www.cdc.gov/flu/professionals/antivirals/index.htm)
50Antiviral Medications for the 2019-20 Influenza Season
▪ Four FDA-approved influenza antiviral drugs recommended by CDC
this season to treat influenza:
▪ oseltamivir (available as a generic version or under the trade name Tamiflu®),
▪ zanamivir (trade name Relenza®), and
▪ peramivir (trade name Rapivab®)
▪ Baloxavir (trade name Xofluza®).
▪ Oseltamivir (Tamiflu®) is the most common antiviral used in LTC
facilities.
▪ Circulating strains are sensitive to oseltamivir at this time.
51Antiviral Shortage?
▪ Antiviral shortage not anticipated for current season
▪ In the event of real or perceived shortage
▪ Call pharmacy in advance
▪ Call multiple pharmacies if needed
▪ Remember to ask for generic and brand-name oseltamivir
52Treatment with Antiviral Medications
▪ Treat residents with confirmed or suspected influenza with
antivirals immediately.
▪ Treatment should not wait for laboratory confirmation of flu.
▪ Antiviral treatment works best when started within the first 2 days
of symptoms, but can be beneficial after that period.
53Treatment Dose and Duration
▪ Oseltamivir (Tamiflu®) antiviral treatment is 75 mg twice daily for 5
days.
▪ Longer treatment courses for patients who remain severely ill after 5 days of
treatment can be considered.
▪ Always consult the resident’s physician for dosing guidance.
▪ Patients with renal impairment may require lower doses.
54Chemoprophylaxis with Antiviral Medications
▪ All eligible well residents in affected wards should promptly receive
antiviral chemoprophylaxis as soon as an influenza outbreak is
determined.
▪ Priority should be given to residents living in the same ward/unit as ill resident(s).
▪ Assess risk of transmission to other wards/units
▪ At minimum, do active surveillance in all wards/units
▪ Once transmission is detected outside of initial ward/unit, consider facility-wide
chemoprophylaxis
▪ Consider offering prophylaxis to staff in the facility. Alternatively, have
staff contact their primary care provider to discuss prophylaxis.
55Chemoprophylaxis Dose and Duration
▪ Oseltamivir (Tamiflu®) antiviral chemoprophylaxis is 75 mg once
daily for a minimum of 14 days, continuing for 7 days after the last
known case was identified.
▪ Always consult the resident’s physician for dosing guidance.
▪ Patients with renal impairment may require lower doses.
56Resources
▪ MDH: Long-Term Care: Influenza
(https://www.health.state.mn.us/diseases/flu/ltc/index.html)
▪ CDC: Influenza Antiviral Medications
(https://www.cdc.gov/flu/professionals/antivirals/index.htm)
▪ IDSA: Clinical Practice Guidelines by the Infectious Diseases Society of America:
2018 Update on Diagnosis, Treatment, Chemoprophylaxis, and Institutional
Outbreak Management of Seasonal Influenza (PDF)
(https://www.idsociety.org/globalassets/idsa/practice-guidelines/2018-
seasonal-influenza.pdf)
57QUESTIONS?
58Thank you
Karen Martin Jennifer Heath
karen.martin@state.mn.us jennifer.heath@state.mn.us
651-201-5537 651-201-5591
Mary Ellen Bennett Michelle Dittrich
mary.ellen.bennett@state.mn.us michelle.dittrich@state.mn.us
651-201-4735 651-201-4567
WWW.H EA L TH. M N. GO V 59You can also read