PLAN - 20 19 | GILBERTAZ.GOV - Town of Gilbert
←
→
Page content transcription
If your browser does not render page correctly, please read the page content below
PLAN

20 19 | GILBERTAZ.GOV
ACKNOWLEDGEMENTS
 TOWN COUNCIL
 Jenn Daniels, Mayor
 Brigette Peterson, Vice Mayor
 Scott Anderson, Councilmember
 Eddie Cook, Councilmember
 Jordan Ray, Councilmember
 Jared Taylor, Councilmember
 Aimee Rigler, Councilmember

 PROJECT STAFF
 Patrick Banger, Town Manger
 Jacob Ellis, Deputy Town Manager
 Kyle Mieras, AICP, Development Services Director
 Kristin Myers, Transportation Planning Manager
 Nichole McCarty, AICP, Transportation Planner
 Lt. Brian Blunt, Police Department
 David Fabiano, P.E., Town Engineer
 Rajinish Gupta. P.E., Traffic Engineer
 Scott Hamlin, Traffic Engineering Division

 TOWN DEPARTMENTS
 Town Manager’s Office
 Development Services
 Police Department
 Office of Digital Government
 Public Works
 GIS
 Legal

Thank you to the numerous residents, businesses and Town staff that participated in the development of the Bike Gilbert Plan
 through surveys, comments, events, mapping, field work, and social media promotion.
INTRODUCTION
 Purpose and Vision Statement . . . . . . . . . . . . . . . . . . . . . . . . . . . . . . . . . . . . . . . . . . . . . . . . 3
 Performance Measures . . . . . . . . . . . . . . . . . . . . . . . . . . . . . . . . . . . . . . . . . . . . . . . . . . . . 3
 Plan Context . . . . . . . . . . . . . . . . . . . . . . . . . . . . . . . . . . . . . . . . . . . . . . . . . . . . . . . . . . 4
 Types of Bicyclists . . . . . . . . . . . . . . . . . . . . . . . . . . . . . . . . . . . . . . . . . . . . . . . . . . . . . . . 6
 Statewide Safety Overview for Bicyclists and Pedestrians . . . . . . . . . . . . . . . . . . . . . . . . . . . . . . . . . . 7

EXISTING CONDITIONS
 What We Have . . . . . . . . . . . . . . . . . . . . . . . . . . . . . . . . . . . . . . . . . . . . . . . . . . . . . . . . . 9
 What We Know . . . . . . . . . . . . . . . . . . . . . . . . . . . . . . . . . . . . . . . . . . . . . . . . . . . . . . . . 11
 What We Heard . . . . . . . . . . . . . . . . . . . . . . . . . . . . . . . . . . . . . . . . . . . . . . . . . . . . . . . . 15
 What We Discovered . . . . . . . . . . . . . . . . . . . . . . . . . . . . . . . . . . . . . . . . . . . . . . . . . . . . . .17

BEST PRACTICES
 Nationally Recognized Resources . . . . . . . . . . . . . . . . . . . . . . . . . . . . . . . . . . . . . . . . . . . . . . 18
 Bike Planning Toolbox . . . . . . . . . . . . . . . . . . . . . . . . . . . . . . . . . . . . . . . . . . . . . . . . . . . . 19

MOVING FORWARD
 Performance Measures and Specific Goals . . . . . . . . . . . . . . . . . . . . . . . . . . . . . . . . . . . . . . . . . 28
 Project Prioritization Strategy . . . . . . . . . . . . . . . . . . . . . . . . . . . . . . . . . . . . . . . . . . . . . . . . 30
 Priority Action Items . . . . . . . . . . . . . . . . . . . . . . . . . . . . . . . . . . . . . . . . . . . . . . . . . . . . . 31

CONCLUSION . . . . . . . . . . . . . . . . . . . . . . . . . . . . . . . . . . . . . . . . . . . . . . . . . . . . . . . 33
APPENDIX
 Community Survey Results . . . . . . . . . . . . . . . . . . . . . . . . . . . . . . . . . . . . . . . . . . . . . . . . . . 34
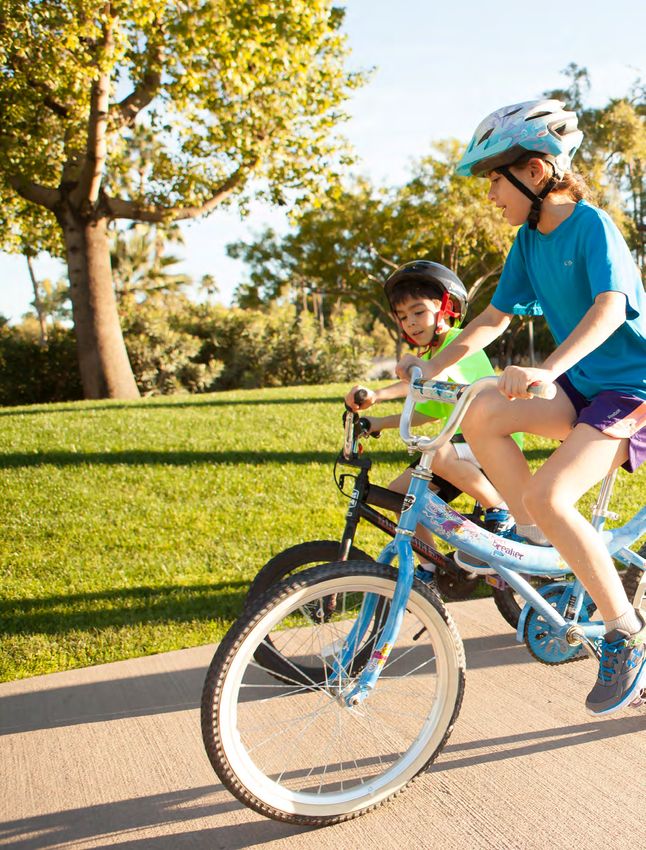
BIKE GILBERT

INTRODUCTION
PURPOSE

To provide safe and convenient opportunities for
community members of all ages and abilities to utilize
multi-modal transportation alternatives.

VISION STATEMENT

We aspire to provide all Gilbert residents, employees
and visitors the benefit of being able to bicycle safely
and comfortably to a variety of destinations both within
our Town limits and connecting to our neighboring
communities and regional destinations.

 4
BIKE GILBERT

PERFORMANCE MEASURES

In order to successfully implement the 2019 Bike Gilbert Plan purpose and vision,
the following performance measures were created to help monitor progress.

 5
BIKE GILBERT

 PLAN CONTEXT
 In December 2017, a bicycle planning process was initiated with the goal of drafting a more modern and relevant document
 to replace Gilbert’s existing 13 year old bike plan. The year-long planning process included an extensive outreach program
 to reach the public and stakeholders through a community survey, public outreach events, crowdsourcing opportunities,
 internal meetings and stakeholder review.

 PROJECT TIMELINE

 • Project Kick-off: December 2017
 • Community Survey: April/May 2018
 • Community Open House: July 2018
 • Draft Plan: August-November 2018
 • Final Draft Plan: December 2018
 • Presentation to Town Council: January 2019
 The Bike Gilbert Plan was developed using a data-driven process to help identify and prioritize investments and next steps
 for moving forward to improve the conditions for bicycling in Gilbert. Woven throughout the entire document you will see
 one common thread – a focus on improving the safety conditions for bicyclists utilizing Gilbert’s network.

 GILBERT TRANSPORTATION MASTER PLAN (2014)

 The Gilbert Transportation Master Plan, adopted in 2014, includes a section dedicated to the topic of bicycling and
 includes goal statements, recommendations, and a “toolbox” of suggested treatments to improve bicycling in Gilbert. This
 section also describes bike-related Capital Improvement Projects for FY 2015 to FY 2019. The 2019 Bike Gilbert Plan was
 created in-line with the recommendations found in the Transportation Master Plan, but with the intent of refining the goals
 and furthering the analysis efforts to help better implement bike improvement projects.
 Bike related goals found in the 2014 Gilbert Transportation Master Plan:
 • Promote bicycling as a viable transportation option through a safe, comprehensive network of bicycle facilities with
 access to employment, shopping, schools, parks, and neighborhoods.
 • Support public and private efforts to improve mobility in the region and reduce impacts on the environment.
 The 2014 Gilbert Transportation Master Plan also identifies the following seven (7) factors that should be considered
 when working on multi-modal transportation efforts. As the Bike Gilbert Plan is implemented, we will continue to
 reference these important focus areas:
 • Safety - All areas of design, operations, and maintenance of the transportation system should minimize hazards and
 emphasize safety for all modes of travel. Special consideration should be given to minimizing conflicts between travel
 modes.
 • Efficiency - Transportation systems must be well-designed to effectively serve adjacent land uwses. The degree to
 which each mode meets the needs of the community should be considered in terms of efficiency.
 • Balance - A balanced transportation system provides multiple choices that are convenient and accessible for travelers.
 Balance is important to meet the diverse travel needs of a growing community.
 • Integration - It is important to integrate travel modes that facilitate the transfer from one mode to another. Many trips
 involve using more than one mode. People who drive to work walk from their car to the office, and others ride their
 bike to a transit stop, and finish the trip on the bus. A multimodal system provides convenient, easy access between
 travel modes.

 6
BIKE GILBERT

• Mobility - Mobility describes a person’s ability to travel to destinations within a community. A balanced transportation
 system provides the ability to choose a travel mode based on the type and distance of a trip.
• Accessibility - Accessibility describes the degree to which travelers can use various modes in the transportation
 system. Accessible transportation systems provide ease of use for all people, regardless of physical ability or
 economic status. Multimodal transportation promotes healthy and sustainable communities
• Aesthetics - Forms a uniqueness of the area and creates a theme that invites people to use the system and includes
 items such as facility design, landscaping, and art.
After analyzing the existing plans in place and looking back at the research that had been done to date, we were able to
better understand our shortcomings and set a path forward to improve upon a bike planning strategy to move forward.
One of the most impactful steps in this process was being able to collect and analyze raw data for bicycle counts in
several locations across the Town. Previous to this plan, that type of data had not been collected in Gilbert.
Taking a deep dive into an existing conditions analysis enabled us to get a true snapshot of the current state of bicycling
conditions in Gilbert. With all of these steps behind us, we now are in a position to better understand the community
need and will be able to prioritize and implement bike improvement projects more efficiently and effectively. This in turn
will help us achieve the Town’s vision and goals related to bicycling in Gilbert.

TYPES OF BICYCLISTS
To ensure a successful implementation of bike improvement projects, a wide variety of bicyclists, from all ages and
abilities, must be positively impacted by our proposals. Creating a less stressful and more safe and comfortable bicycle
network will help to make bicycling more appealing to a broader segment of the population. First, we must identify
barriers for people bicycling; this will help us to prioritize bikeway infrastructure improvements that meet the needs of
people of all ages and abilities and meaningfully allow people to use a bicycle for transportation purposes.
In the City of Portland, Transportation Planner Roger Geller developed a method of categorizing bicyclists into four different
“types,” based primarily on a bicyclist’s willingness to ride under the current conditions that exist in their community.
Based on this method, all residents will fall into one of the following categories:
1. Strong and Fearless: People willing to bicycle with limited or no bicycle-specific infrastructure
2. Enthused and Confident: People willing to bicycle if some bicycle-specific infrastructure is in place
3. Interested but Concerned: People willing to bicycle if high-quality bicycle infrastructure is in place
4. No Way, No How: People unwilling to bicycle even if high-quality bicycle infrastructure is in place
Geller estimated that the average community would have the following allocation of bicyclists in each category:
• Strong and Fearless: Less than 1%
• Enthused and Confident: 7%
• Interested but Concerned: 60%
• No Way, No How: 33%
Based on these percentages, bike improvement projects that will have the greatest potential to positively impact ridership
levels, would be those that addressed the needs of the “Interested but Concerned” bicyclist. Therefore, the Town should
aim to provide bike facilities that are above the minimum standards for safety and comfortable design.
Source: Four Types of Cyclists. (2009). Roger Geller, City of Portland Bureau of Transportation.

 7
BIKE GILBERT

STATEWIDE SAFETY OVERVIEW FOR BICYCLISTS AND PEDESTRIANS
The state of Arizona currently has the highest rate of pedestrian deaths in the Nation. In 2015, the Governor’s Office of Highway
Safety (GOHS) published statistics showing that pedestrian and bicyclist fatalities accounted for a combined 23% of all fatalities
in Arizona. Crash facts provided by the Arizona Department of Transportation (ADOT) shows the percent increase in fatalities
between 2015 and 2016 as 18.4% for pedestrians and 10.7% for bicyclists. Similarly, the percent of injuries for both bicyclists
and pedestrians also increased.

 ADOT CRASH DATA 2015 2016 PERCENT INCREASE
Pedestrian Fatalities 163 193 18.40%
Bicyclist Fatalities 28 31 10.71%
Pedestrian Injuries 1,246 1,458 17.01%
Bicyclist Injuries 1,278 1,350 5.63%

Most of the factors that impact the safety of pedestrians on our roadways also directly influence the safety of our bicyclists. High
speeds, distracted driving, insufficient infrastructure and lack of education related to bike and pedestrian laws are all examples
of safety factors that need to be addressed by the entire State to help improve the current situation.
Safety is commonly provided as the number one reason people choose not to ride a bike or the number one concern cited by
those who do. Of the 741 residents who answered a bike survey question relating to their perception of bike safety, only a slight
majority (56%) answered that they felt safe riding a bicycle in Gilbert. In a separate but related question, a vast majority of
parents with children under the age of 18 did not feel safe allowing their children to ride a bicycle. The results of these survey
questions, in combination with analysis of many other important safety datasets, have lead us to prioritize safety as the number
one determining factor in moving forward with bike planning and implementation efforts.

 8
BIKE GILBERT

EXISTING CONDITIONS
 In order to prepare a plan to help guide Gilbert to a more
 bike-friendly future, we first had to analyze the current state
 of conditions, as they relate to bicycling in our community.

 This task was accomplished through a combination of
 research, reviewing historical data, collecting and reviewing
 new data, reviewing past surveys and conducting new ones,
 listening and learning from the community and analyzing
 trends with the help of Staff experts from a variety of
 disciplines.

WHAT WE HAVE WHAT WE KNOW
An inventory of our on-street infrasturcture including bike A summary of the Maricopa County Trip Reduction Survey
lanes and pedestrian hybrid beacons as well as off-street results for Gilbert employees and students and analysis
multi-use trails. of Bike Crash Data from 2016-2018.

WHAT WE HEARD WHAT WE DISCOVERED
A summary of what we heard through the “Bike Gilbert” A description and summary of the bicycle count data that
survey results, Community Open House and feedback was collected in twenty-two different locations across
from internal stakeholder review. Gilbert.

 9
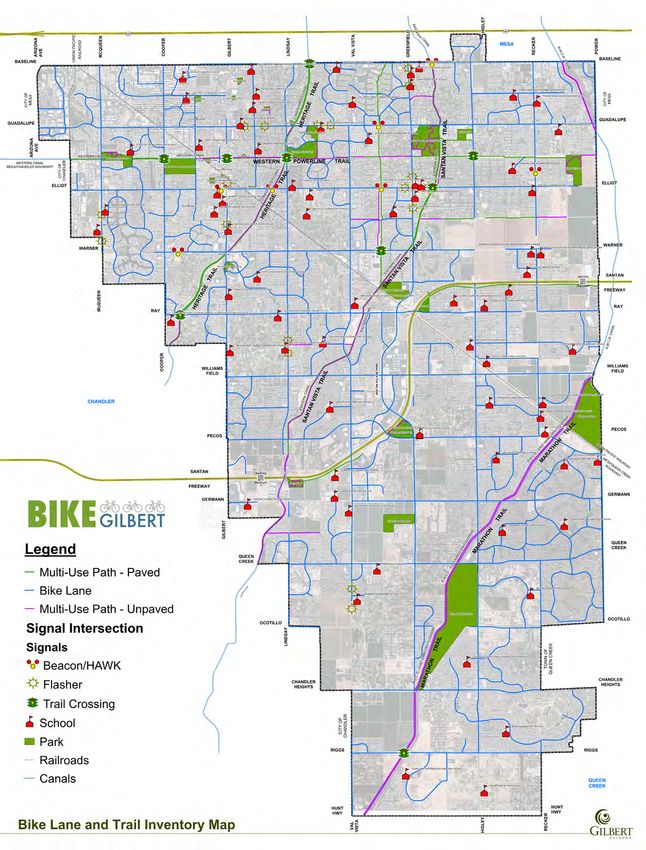
BIKE GILBERT

WHAT WE HAVE
STREET INVENTORY

 Total Miles of Total Miles of Total Miles of
 Gilbert Streets On-Street Bike Lanes Multi-Use Paths

 + + +
 1076 201 81

• Locals (73%) • 76% of collectors • Paved (49%)
• Collectors (10%) and arterials have on • Un paved (51%)
• Arterials (17%) street bike lanes

 BIKE INFRASTRUCTURE

 With the Town now developed at an estimated 80% of With many miles of arterial and collector roadways left to be
 build-out (total amount of land area that will be developed), improved in Gilbert, there is ample opportunity to incorporate
 we are in a crucial moment to discuss the future of bike new and innovative bike safety standards and roadway design
 safety issues with how they relate to implementation of our elements that will provide benefits to the community as it
 roadway networks and other future planning efforts related continues to grow.
 to our infrastructure development.

 10
BIKE GILBERT

 11
BIKE GILBERT

WHAT WE KNOW

TRIP REDUCTION SURVEY

Every year the Maricopa County Department of Public Health conducts a Travel Reduction Survey as part of their Travel
Reduction Program aimed at reducing air pollution in the region. In 2016, responses were collected from over 325,000
employees and almost 53,000 students across Maricopa County, representing approximately 9 percent of the population.
Here in Gilbert, there were 29,531 employees and 5,586 students surveyed. The nature of the program and survey are
regional and therefore the responses for Gilbert are not solely from residents, but also represent those who live outside of
Gilbert but commute here for work.
The answers to the following questions provided us with meaningful data to help better understand how often employees and
students are choosing to cycle as a mode of transportation.
On average how many days do you bike to work or school?

 DAYS BICYCLE GILBERT EMPLOYEES GILBERT STUDENTS
 0-1 99.1% (29,265) 98.3% (5,491)
 2-3 0.4% (118) 0.3% (17)
 4-5 0.5% (148) 1.4% (78)
If you were willing to make a change to your daily commute, which options would interest you most?

 MODE OF TRANSPORTATION GILBERT EMPLOYEES GILBERT STUDENTS
 Bicycle 12.3% (3,632) 25.6% (1,430)

 12
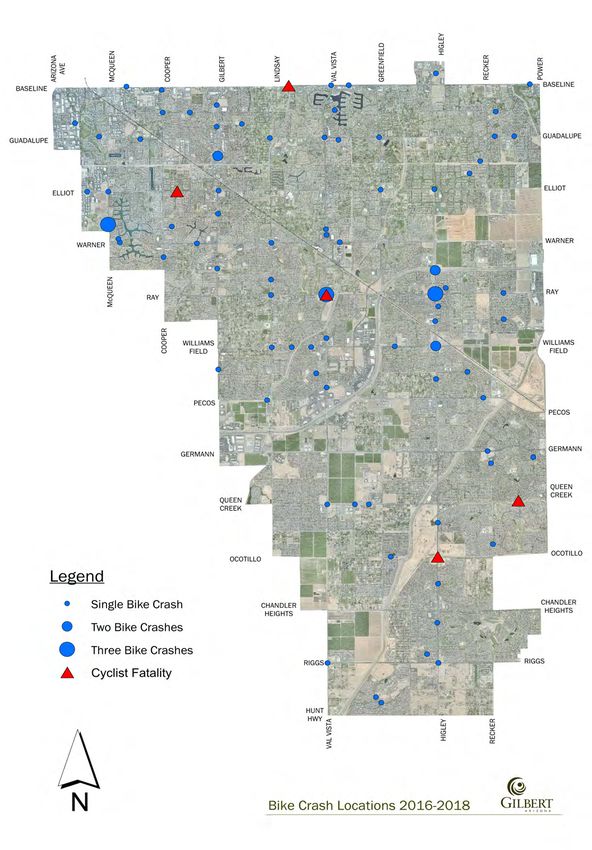
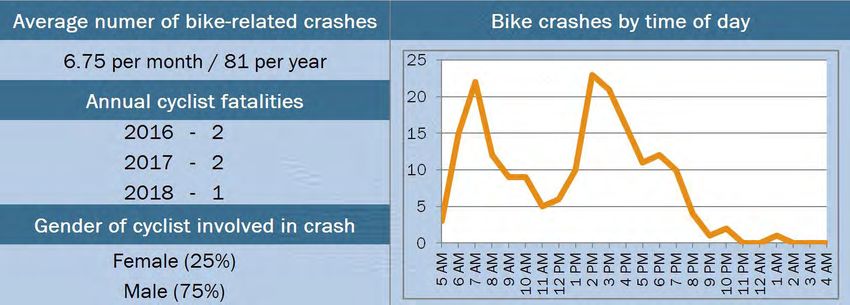
BIKE GILBERT

BIKE CRASH DATA

In order to gain a more in-depth perspective into how and why bicycle crashes are occurring in our community, the past two
years of crash data were analyzed in great detail. As part of this significant step, we also dug deep into several crash report
narratives to more accurately understand the details surrounding the crash. While this task was a significant undertaking,
the results of the efforts were the development of a set of crucial data sets that helped in both setting a true baseline for
the existing conditions surrounding bike safety today, and to drive the direction of the plan to be focused on bike safety
improvement efforts moving forward.
As demonstrated in this section’s graphics, the majority of crashes in Gilbert are occurring within an intersection that has
a crosswalk. The next highest percentage of crash locations happen in a dedicated bike lane. Knowing crash trends such
as these will be fundamental in directing our education and enforcement campaigns and will also directly relate to our
prioritization of infrastructure analysis improvement efforts.
Moving forward, Police crash data will be analyzed on a quarterly basis (at a minimum) with a team of Staff members that
will participate in the Bike Incident Review Team. This team and the analysis efforts they undertake will help ensure that
recordable crashes are being identified and analyzed in a way that is meaningful to future bike planning efforts and on-going
crash analysis.
Crash Location Mapping
In order to synthesize crash data that could be used to inform our decisions relating to network improvements and prioritization,
bike crashes from 2016-2018 in Gilbert were mapped. The crash data included any incident in Gilbert that involved a bicyclist
crash on a public road or right-of-way, and in which a police report was recorded.
In Gilbert, between 2016 and 2018 there were a total of 243 bicyclist-involved crashes, for an average of 81 crashes per year,
or almost seven (7) crashes per month. A total of five (5) of these crashes resulted in a bicyclist fatality. Generally, crashes
are concentrated on major arterial roadways and most often at a major intersection. There are also significantly more crashes
occurring from north of Pecos Road than there are in the southern portion of Town. However, two (2) of the five (5) fatalities in
the past three years occurred in south Gilbert.

 GILBERT CRASH DATA 2016 2017 2018 PERCENT CHANGE
 Bicyclist Fatalities 2 2 1 (50%)
 Bicyclist Crashes 87 74 82 8.1%

Top Crash Locations
(2016-2018)
• Ray & Val Vista (4)
• Warner & McQueen (3)
• Ray & Higley (3)
• Higley Road (29)
• Gilbert Rd. (20)
• Val Vista (17)
• Williams Field (15)

 13
BIKE GILBERT

 14
BIKE GILBERT

BIKE CRASHES BY LOCATION TYPE
2016-2018

 SIDEWALK 19%

 DEDICATED BIKE LANE 21%

 IN ROADWAY 11%
 (NOT IN CROSSWALK OR INTERSECTION)

 INTERSECTION WITH NO CROSSWALK 12.5%

 INTERSECTION WITH CROSSWALK 34%

 UNKOWN 2.5%

BIKE CRASH STATISTICS, 2016-2018

 15
BIKE GILBERT

WHAT WE HEARD

ONLINE COMMUNITY SURVEY

For one month between mid-April and mid-May, an online survey was made available to provide the opportunity for residents to
give feedback on how they currently feel about cycling in Gilbert and what improvements they would like to see in the future. From
this survey we were able to learn more about the reasons our residents do or don’t ride their bikes, what destinations they are
riding to and what factors are limiting the amount of cycling they do in our community. The survey responses helped drive the
direction of the 2019 Bike Gilbert Plan and specifically helped in developing the performance measures and priority action items
list.

 16
BIKE GILBERT

COMMUNITY OPEN HOUSE

In July 2018, an open house was held to
provide community stakeholders another
opportunity to offer input on the direction of
the bike planning process. The meeting was
organized in the format of a hands-on workshop
in which attendees were able to identify their
concerns and ideas on maps and other displays
in an engaging and meaningful manner. The
stakeholder feedback reinforced many of
the same themes that were heard through
the online survey including a need to focus
on bike safety improvements, infrastructure
improvements and creative ideas for increasing
bike awareness and education in the community.
The results of the feedback received from both
the online survey and the open house helped
identify specific direction used to draft the
goals and priority action items found in the
plan. We will continue to engage the community
as we move forward with implementation
efforts and to gather feedback on the success
of any new bike improvement projects.

 17
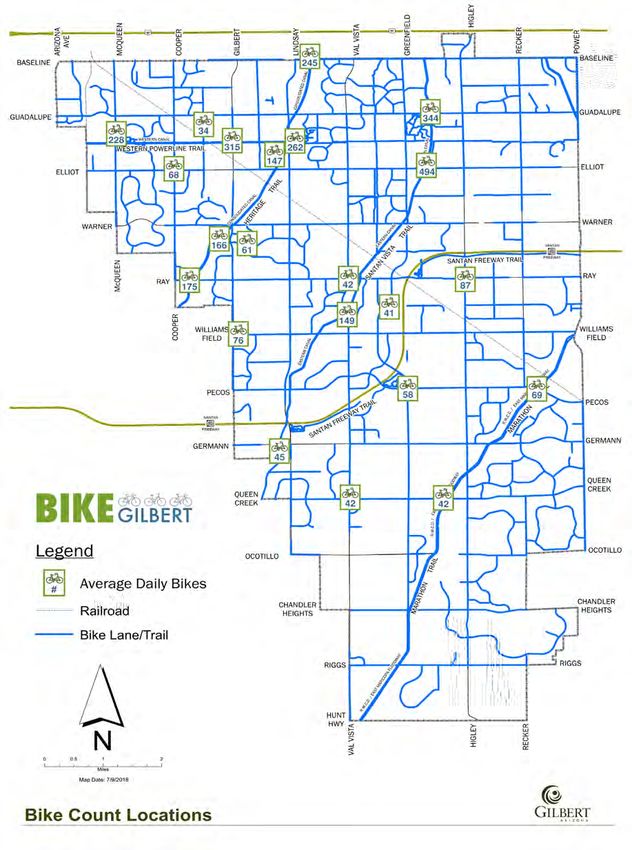
BIKE GILBERT

WHAT WE DISCOVERED
Between March and April 2018, bicycle counts were conducted in twenty-two (22) locations throughout Gilbert. The locations
chosen included a mix of canal paths, canal crossings at roadways, and signalized intersections. For each location, 13-hours of
daytime video footage over a 4 day period, was recorded and analyzed. To be consistent across the locations, the footage always
included two week days, in addition to both Saturday and Sunday. The icons on the map below represent both the location of the
count as well as the average daily number of bikes that passed through. The peak times were of course much higher in some
locations, especially in areas near popular weekend destinations such as the Heritage District and Riparian Preserve.

 18
BIKE GILBERT

BEST PRACTICES
The work done to conduct the in-depth existing conditions analysis laid the trail for moving forward in Gilbert in a manner that
ensures we are raising our own bar and improving biking conditions to a quality that is in-line with the best practices incorporated
into top bike friendly communities. The need to address the real safety concerns for cycling in Gilbert will continue to provide
motivation to find the best and most effective ways of making improvements that will have a meaningful impact on the conditions
of cycling in our community.
The Gilbert Bike Planning Toolbox was compiled using nationally-accepted best practices in bike network implementation strategies.
This section of the document provides general design considerations that we will use moving forward to help implement the 2018
Gilbert Bike Plan Vision, Goals and Priority Actions List. While the Toolbox identifies types of infrastructure that are anticipated to
be utilized in our community, it is not an all-inclusive list and does not contain the specific design standards needed for practical
implementation. Throughout the project planning and implementation processes, the inclusion of engineering review and site-
specific assessments will be necessary.

NATIONALLY RECOGNIZED RESOURCES
Urban Bikeway Design Guide (NACTO, 2014)
• A general design guide to help cities implement innovative solutions that will provide safer, more
 enjoyable conditions for bicyclists.
• www.nacto.org
Guide for the Development of Bicycle Facilities (AASHTO, 2012)
• A technical guide that provides specific and detailed guidance and standards for cities to
 reference when selecting bike facilities.
• Note: AASHTO will be releasing an updated guide in 2019
• www.transportation.org
Separated Bike Lane Planning and Design Guide (FHWA, 2015)
• A design guide with case studies that focus specifically on the design of separated bike lanes
 facilities.
• www.fhwa.org
A Manual on Uniform Traffic Control Devices (MUCD) (FHWA, 2009)
• A manual of national standards that offers specific standards and guidance to help ensure
 uniformity across all traffic control devices.
• www.mutcd.fhwa.dot.gov
Bicyclist Safety Action Plan Update (ADOT, 2018)
• www.azbikeped.org
• A strategic action plan that focuses on changes that will reduce the number of severe injury and
 fatal bicycle crashes on state roads.

 19
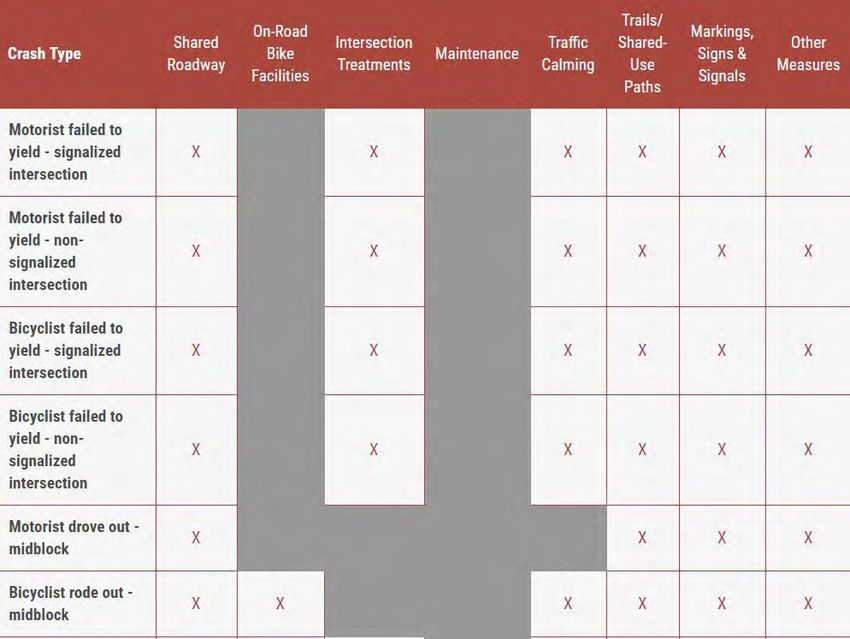
BIKE GILBERT

BIKE PLANNING TOOLBOX
In order to effectively proceed with bike safety infrastructure improvements, a bike plan “tool-box” has been assembled to help
guide our decision making moving forward. This tool-box was derived from concepts found in the 2014 Gilbert Transportation
Master Plan as well as other industry recognized documents such as the National Association of City Transportation Officials
(NACTO) Urban Bikeway Design Guidelines. The tool-box provides examples of tangible solutions that should be applied throughout
the Town to improve bike infrastructure, however we will not be limited to only these solutions.

Under the U.S. Department of Transportation, the Federal Highway Administration has completed a Bicyclist Safety Guide and
Countermeasure Selection System (www.pedbikesafe.org). Within this guide are two interactive matrices – the “Crash Type” matrix
helps with identifying and categorizing bicyclist crash types based on the action of the bicyclist and the infrastructure in place,
and the second is a “Performance Objective” matrix to help identify appropriate countermeasures based on the crash type.
These matrices were developed to help guide transportation officials in decision making by analyzing multiple factors associated
with bicyclist crashes and counter measures to help prevent them. Online, the matrices have direct hyperlinks leading to more
information regarding specifics on how and when to implement the proposed countermeasures, and provide users with a helpful
tool for narrowing down alternatives.

 20
BIKE GILBERT

For each of the following infrastructure improvements, some of the associated benefits, directions for where implementation is
recommended and a few points of design guidance have been identified. It is important to note that in many scenarios, several of
these tools could, and often should, be used in combination together. Prior to implementation in a specific area in Gilbert, each of
these “tools” will need to be further analyzed using the nationally recognized resources identified earlier in this section.
Bike Paths
• Bike Boulevards/Shared Roadways
• Conventional Bike Lanes
• Buffered Bike Lanes
• One-way Cycle Tracks
• Shared Use Paths
Signals and Intersections
• Rectangular Rapid Flash Beacons (RRFBs)
• High-Intensity Activated Crosswalk (HAWK)
• Bike boxes
• Median Refuge Islands
Pavement Treatments
• Colored Bike Facilities including conflict zones
• Shared Lane Markings
• Lane Diets and Lane Narrowing

 21
BIKE GILBERT

Depending on the type of bike facility available for their use, a bicyclist’s degree of comfort and safety will vary by type, and will
in turn affect the level of stress they experience while riding. The diagram below identifies the order in which a bike facility feels
more comfortable and less stressful for a rider, depending specifically on the degree of separation it creates between a bike and
a motor vehicle.

 MOST SEPARATION =
 MORE COMFORT =
 LEAST STRESSFUL

 SHARED USE PATH

 ONE-WAY CYCLE TRACK

 BUFFERED BIKE LANE

 CONVENTIONAL BIKE LANE

 SHARED ROADWAY

 LEAST SEPARATION =
 LESS COMFORT =
 MOST STRESSFUL

 22
BIKE GILBERT

BIKE PATHS

Bike Boulevards/Shared Roadways
A shared roadway that is designed to encourage cycling that is mixed with vehicle
traffic, on a low-stress route (slow vehicle speeds and low number of vehicle trips)
through use of a combination of traffic speed and volume management techniques.
Benefits
• Provides bicyclists with a known route that offers a combination of pavement
 markings, signage and traffic calming devices to reduce potential conflicts with
 vehicles.
• With proper design treatments, motorists will be more aware that bicycle traffic is heavy along the route.
Areas for Implementation
• Neighborhood and local streets with speed limits less than 25 mph.
• Streets with fewer than 3,000 daily vehicle trips.
Design Guidance
• Depending on the specific roadway, a combination of traffic diverters, speed humps or chicanes, pavement markings and
 signage should be considered.

Conventional Bike Lanes
A designated space for cyclists along the side of a roadway that is delineated with a
pavement stripe and signage.
Benefits
• Creates separation between bicyclists and automobiles.
• Increases predictability of path of travel for bicyclists.
• Reminds motorists of the potential presence of bicyclists on the roadway.
Areas for Implementation
• Streets with speed limits greater than 25 mph.
• Streets with greater than 3,000 daily vehicle trips.
Design Guidance
• Desirable bike lane width: 6’ min. from back of curb, 4’ from edge of pavement.
• Wherever possible, bike lanes should be made wider than minimum widths.

Buffered Bike Lanes
A conventional bike lane that is designed to include additional width through the use
of pavement markings on the side adjacent to motor vehicle traffic or a parking lane.
Benefits
• Creates more physical and visual separation between bicyclists and automobiles
 than conventional lanes.
• Provides additional space for bicyclists to pass other bicyclists.
 23
BIKE GILBERT

Areas for Implementation
• Anywhere a conventional lane is appropriate.
• Streets with high travel speeds and high traffic volumes.
Design Guidance
• Buffer width shall be 18” minimum and marked with two solid white lines.
• Both the bike lane and buffer shall be considered part of the bike lane width.

One-Way Cycle Tracks
An on-street bike facility that is dedicated solely to bicyclists on a roadway by providing
protection from motor vehicle traffic in the form a semi-permanent or permanent
vertical element (i.e. tubular markers, moveable planters or raised curbing).
Benefits
• Provides greater separation between bicyclists and motorists.
• Reduces fear of collision with vehicles by providing a physically separated space.
Areas for Implementation
• Along streets with high bicycle ridership levels.
• On streets with a combination of multiple traffic lanes, high speeds, and high traffic volumes.
Design Guidance
• Bike lane width: 5’ minimum; 7’ minimum in areas with high bike ridership levels.
• Vertical element should have “breaks” wide enough to allow bicyclists to enter and exit the designated “track” with ease.

Shared Use Paths
An off-street, two-way path that is separated from motor vehicle traffic and intended to
be shared with bicyclists, pedestrians, skaters, wheelchair users, joggers and others.
Benefits
• Provides a low-stress experience for a wide variety of users. Useful for both
 transportation and recreation activities.
Areas for Implementation
• In locations with heavy volume of pedestrians and bicyclists activity such as near
 regional destinations and recreational activity areas (i.e. Gilbert Regional Park).
Design Guidance
• 10’-12’ minimum width depending on factors such as number of users and types of users.

 24
BIKE GILBERT

SIGNALS AND INTERSECTIONS

Rectangular Rapid Flash Beacons (RRFBs)
A warning beacon that incorporates signage and flashing lights to alert motorists to
yield to bicyclists entering a roadway.
Benefits
• Low cost alternative to traffic signals and other crossing alternatives.
• Significantly increases the visibility of a bicyclist or pedestrian in a designated
 roadway crossing.
Areas for Implementation
• Along high volume pedestrian areas.
• At locations where bike paths cross a roadway, yet the crossings don’t warrant or aren’t capable of accommodating signals or
 other crossing devices.
Design Guidance
• RRFB’s shall be used in combination with other bicycle and pedestrian crossing signage and markings.

High-Intensity Activated Crosswalk (HAWK)
A specific type of warning beacon that incorporates an overhead signal with red and
yellow lenses that are designed to enhance pedestrian and bicycle crossings of major
roadways, especially along mid-block crossings such as canal paths.
Benefits
• Creates adequate gaps for bicyclists to safely cross streets with high traffic
 volumes.
• Is more flexible than a standard traffic signal.
• Has a proven high level of driver compliance and safety results.
Areas for Implementation
• Where heavily utilized bike routes or mid-block crossings intersect with major streets that have high traffic volumes.
Design Guidance
• The installation and operation of a HAWK must be scrutinized carefully while utilizing best practice research and engineering
 judgement to finalize the location and timing decisions.
• Existing MUTCD guidelines for warrants currently only consider pedestrian volumes and motor vehicle speeds, however, bicycle
 volumes can be factored into the warrant analysis.

 25
BIKE GILBERT

Bike Boxes
A dedicated space provided between the back of a crosswalk and a vehicle stop bar
at a signalized intersection.
Benefits
• Offers bicyclists a way to be more visible and to get ahead of traffic during the
 red signal phase.
• Helps prevent common “right hook” conflicts with turning vehicles at the start of
 a green light transition.
Areas for Implementation
• At signalized locations that have a combination of high bike ridership levels and high vehicle volumes.
Design Guidance
• Boxes shall be a minimum of 10’-16’ deep and are typically painted green.
• Pavement markings shall be used to clearly delineate the vehicle stop line from the start of the bike box.

Median Refuge Islands
Protected spaces built in the center of a roadway that offers a
place of refuge for bicyclists and pedestrians crossing along a
dedicated path.
Benefits
• Allows bicyclists to take advantage of gaps in one direction
 of traffic at a time.
• Decreases the amount of delay experienced by a bicyclists and motorist by not having to wait for a signal.
Areas for Implementation
• Where a bike route (i.e. canal path) crosses a street with moderate to high volumes of vehicular traffic.
• At signalized and un-signalized intersections.
Design Guidance
• Desirable width of island: 10’; minimum width of 6’.
• Must be applied in combination with other pavement markings and signage alternatives as described in federally recognized
 standards.

PAVEMENT TREATMENTS

Colored Bike Facilities (including conflict zones)
A method of applying color (typically green) to pavement in areas that bicyclists need the benefit of more visibility and to help
highlight conflict areas to make all roadway users more alert.
Benefits
• Increases the visibility of bicyclists and therefore increases their comfort level.
• Helps reduce conflicts with motorists wanting to make a turn.

 26
BIKE GILBERT

Areas for Implementation
• Within bike lanes or cycle tracks, especially in areas with high ridership levels.
• Across driveways, turning conflict areas (right turn lanes), and stop sign controlled intersections.
• Intersections where the bike path may become unclear.
Design Guidance
• The color green is recommended to avoid confusion with other standard traffic markings.
• Normal white bike lane lines shall be used on the outer edges of the green paint for consistency throughout the Town.

Shared Lane Markings – “Sharrows”
A pavement marking that is applied to a roadway to alert motorists that bicyclists do not have a dedicated bike lane and therefore
will be sharing the normal travel lane.
Benefits
• Alerts motorists to the potential for bicyclists to be in the roadway.
• Encourages the safe passing of bicyclists by motor vehicles.
• Known to reduce the amount of wrong way bicycling.
Areas for Implementation
• Along bicycle boulevards or other low volume roadways, especially along the uphill and downhill segments.
Design Guidance
• Utilize the MUTCD approved marking that is a combination of a bicycle and a chevron.
• Ensure proper spacing (dependent on vehicle volumes and speed limits) and ensure proper placement in the roadway – they
 are not intended for use on the shoulder.

Lane Diets and Lane Narrowing
A method of reducing vehicular travel lane widths to create space that can be reallocated to other modes of transportation in the
form of on-street or off-street bicycle or pedestrian facilities.
Benefits
• Ensures roadway facilities are being designed to support a variety of multi-modal transportation alternatives.
• Narrow lanes can help reduce the speed of motorists along the roadway which may be appropriate in areas with high pedestrian
 and bicyclist activity.
Areas for Implementation
• In locations with heavy volume of pedestrians and bicyclists activity such as near regional destinations and recreational
 activity areas (i.e. Heritage District).
Design Guidance
• Per the AASHTO Green Book, travel lanes as narrow as 10’ are allowed on streets with speed limits of 45 mph or less,
 however, this width would not be appropriate on 4-lane, undivided arterials.

 27
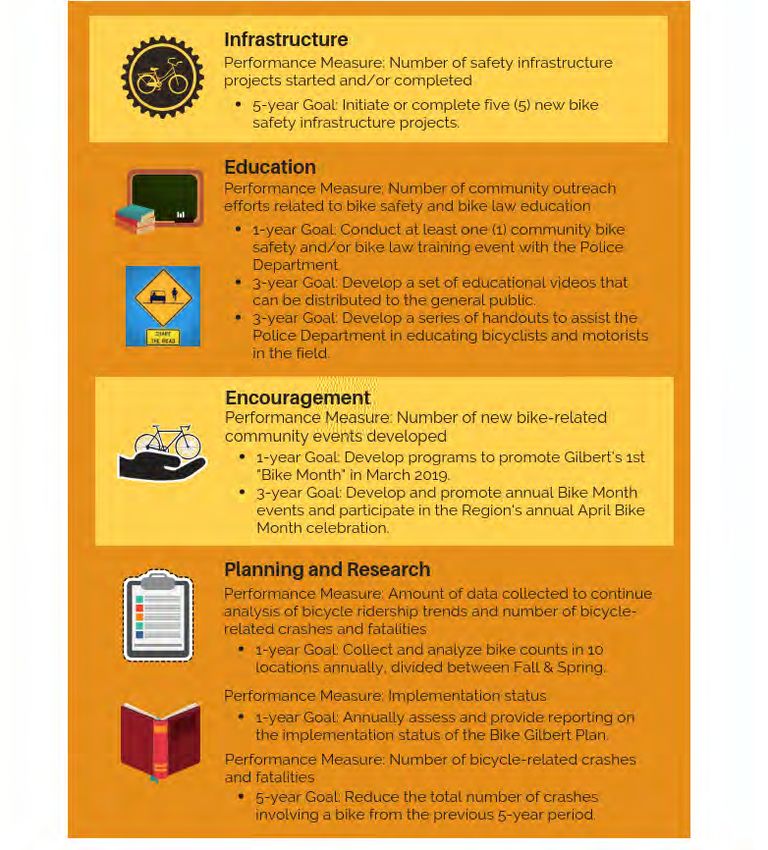
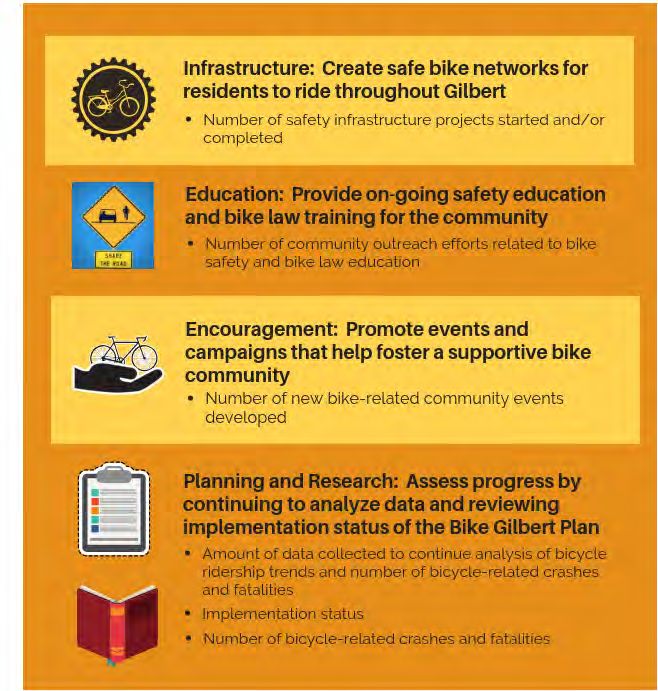
BIKE GILBERT

MOVING FORWARD
In order to provide sustainable opportunities for residents and visitors interested in cycling in Gilbert, the Town must pursue bike
improvement projects that relate to a variety of disciplines. Moving forward, bike planning efforts will focus on the following subject
areas:
• Infrastructure – Plan for and construct safe bike networks to allow residents of all ages and abilities to ride throughout the
 community comfortably.
• Education – Enhance the safety of all network users by providing on-going and proactive safety education and training on bike
 safety traffic laws.
• Encouragement – Develop events and campaigns with community partners to help foster a supportive bike community in
 Gilbert.
• Planning and Research – Continue assessing progress through the collection and evaluation of new bike planning data and
 by reviewing the implementation of “Priority Action Items” and “Bike Planning Toolbox” alternatives.

PERFORMANCE MEASURES AND SPECIFIC GOALS
In order to keep the 2019 Bike Gilbert Plan a relevant and tangible document, performance measures and specific goals were
crafted with fairly short time frames ranging from 1 to 5 years. Short-term implementation of specific and measurable goals
will help move our bike planning efforts forward in a consistent, timely and more predictable manner. We utilized the four (4)
subject areas as described above, to categorize goals that were developed using the SMART method of goal setting (Specific,
Measurable, Achievable, Relevant and Time-bound). It is anticipated that the Bike Plan will be revised every 5 years and at that
time performance measures and associated goals will be re-evaluated and updated.
Infrastructure
Performance Measure: Number of safety infrastructure projects started and/or completed
• 5 year goal: Initiate or complete five (5) new bike safety infrastructure projects.
Education
Performance Measure: Number of community outreach efforts related to bike safety and bike law education
• 1 year goal: Conduct at least one (1) community bike safety and/or bike law training event with the Police Department.
• 3 year goal: Develop a set of educational videos that can be distributed to the general public.
• 3 year goal: Develop a series of handouts to assist the Police Department in educating bicyclists and motorists in the field.
Encouragement
Performance Measure: Number of new bike-related community events developed
• 1 year goal: Develop programs to promote Gilbert’s 1st “Bike Month” in March 2019.
• 3 year goal: Develop and promote annual Bike Month events and participate in the Region’s annual April Bike Month
 celebration.
Planning and Research
Performance Measure: Amount of data available to analyze bicycle ridership trends
• 1 year goal: Collect and analyze bicycle counts in 10 locations annually, divided between Spring and Fall.

 28
BIKE GILBERT

Performance Measure: Implementation status
• 1 year goal: Annually assess and provide reporting on the implementation status of the Bike Gilbert Plan.
Performance Measure: Number of bicycle-related crashes and fatalities
• 5 year goal: Reduce the total number of crashes involving a bicycle from the previous 5-year period (Relative to increase in
 population and bicycle ridership levels).

 29
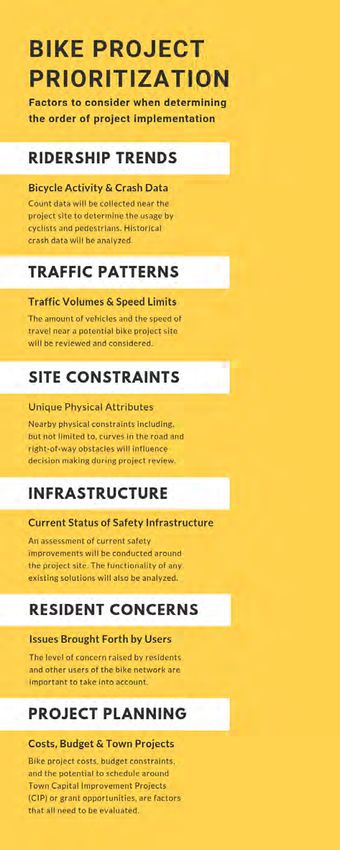
BIKE GILBERT

PROJECT PRIORITIZATION STRATEGY
The process of creating the 2019 Bike Gilbert Plan has been,
and will continue to be, a way to initiate conversations relating to
bicycle safety and its importance in our community. This document
was never intended to be a complete set of solutions to all of our
concerns, but it will serve as a starting point to lay out a path for
how we will move forward and grow in a manner that prioritizes a
multi-modal network of alternatives that residents will be able to
utilize for decades.
The approach for implementation of the 2019 Bike Gilbert Plan, is to
identify the steps that need to be made to prioritize bike improvement
projects and to identify the priority action items that are immediate
(urgent priority level), short-term (high priority level) and long-term
(low priority level).
The method for project implementation will include utilization
of an internal working group of Transportation-related experts
(Engineering, Planning, CIP, Police, etc.) that will be tasked with
analyzing and prioritizing bike improvement projects. Due to the
wide variety of potential projects, each one will have unique factors
that influence the decision making and therefore a set “weight” has
not been assigned to each factor.

The following factors will be evaluated and weighed when
analyzing individual projects:
• Ridership levels / bicycle usage data
• Crash data and trends analysis
• Traffic volumes
• Site constraints
• Status of current safety infrastructure
• Concerns/complaints/etc. from residents
• On-going or planned Town project or grant opportunity

 30
BIKE GILBERT

PRIORITY ACTION ITEMS
The following table identifies priority action items that we need to immediately begin implementing in order to improve the safety
and success of biking in Gilbert.

 PRIORITY LEVEL GOAL CATEGORY NO. PRIORITY ACTION ITEM
 Urgent Education 1.0 Implement a bike safety education campaign to
 reach all Gilbert road users
 Urgent Infrastructure 1.1 Analyze all canal crossings to identify infrastructure
 deficiencies and prioritize necessary life safety
 improvements
 Urgent Infrastructure 1.2 Make small enhancements to the existing network
 to improve safe cycling and driving behaviors
 Urgent Planning & Research 1.3 Create an internal “Bike Incident Review Team” to
 routinely and consistently analyze bike crashes
 Urgent Planning & Research 1.4 Identify and plan for future “Bike Safety Corridors”
 High Education 2.0 Implement new strategies for Police officers to help
 educate motorists and bicyclists in the field
 High Encouragement 2.1 Organize a Town Council proclamation for March to
 be celebrated as “Gilbert Bike Month”
 High Infrastructure 2.2 Develop an internal policy to specify warrants for
 use of High-Intensity Activated Crosswalks (HAWK)
 High Planning & Research 2.3 Identify and prioritize completion of bike network
 gaps including the implementation of “Bike Safety
 Corridors”
 Low Education 3.0 Create and implement a “Bike Friendly Driver
 Program”
 Low Encouragement 3.1 Develop a series of annual bike-focused
 community events
 Low Planning & Research 3.2 Conduct a roadway level of stress analysis,
 leading to development of a low-stress bike route
 identification map

PRIORITY ACTION ITEMS: MORE DETAILS

Urgent Priority Level Items
1.0: Bike Safety Education Campaign
• Partner with multiple Town departments, and community partners including bike shops and schools to promote bike safety
 education for all road and network users.
1.1: Canal Crossings Analysis
• Assess the current infrastructure at all intersections where canals cross major roadways. Inventory and plan for necessary
 life-safety improvements that will bring the crossings up to current national standards.

 31
BIKE GILBERT

1.2: Bike Network Improvements
• Complete small network enhancements that are identified in the 2014 Transportation Master Plan to improve the safety and
 comfort for bicycle riders on the Town’s roadways.
• Working with the Parks and Recreation Department, identify improvement needs along the trails and canal system and
 identify how the Town can work with regional partners and neighboring cities to ensure trails are designed consistently across
 the region.
1.3: Bike Incident Review Team
• Assemble an internal working group who will meet quarterly to complete a comprehensive review and analysis of bike crashes
 that have occurred in Gilbert. Representatives from the Police Department, Streets, Engineering and Transportation Planning
 should be involved. Some of the data that would be analyzed includes: Manner of crash, number of vehicle lanes, lane
 configuration, adjacent land uses, lighting conditions, asphalt condition, closest crossing/crossing type, vehicle speeds, and
 nearby bus stops.
1.4: Bike Safety Corridors
• Initiate long–range planning efforts to identify routes within Gilbert that can be designed as high-quality “complete corridors,”
 where bicyclists will have a truly safe and low-stress route to travel across the community.

High Priority Level Items
2.0: Road and Bike Safety Education
• Work with the Police Department to identify and implement new safety education strategies for Officers to utilize when making
 contact with bicyclists and motorists in the field.
2.1: Gilbert “Bike Month” Proclamation
• Organize the proclamation of March as Gilbert’s “Bike Month” by the Mayor and Council.
2.2: High-Intensity Activated Beacon (HAWK) Policy
• Develop an internal policy describing in detail the warrants for the use of HAWKS at canal crossings and other intersections
 in the community.
2.3: Bike Network Gaps
• Identified in Table 8-5 of the Gilbert Transportation Master Plan are remaining network gaps that were identified in 2014.
 An assessment of what has been accomplished in the past 4-5 years needs to be completed in order to help prioritize the
 completion of remaining gaps.

Low Priority Level Items
3.0: Bike Friendly Driver Program
• Utilize the City of Fort Collin’s template and resources for the development of a voluntary “Bike Friendly Driver Program” that
 could be used in the community, including possibly in schools, to provide education on bike safety and bike traffic laws.
3.1: Annual Bike-focused Community Events
• Develop annual events that will provide education and encouragement opportunities for bicycling in Gilbert. Events could
 include an annual Mayor-led bike ride during “Bike Month,” a bike safety “rodeo”, and other events with community partners
 such as schools, bike shops and local bike advocacy groups.
3.2: Roadway Level of Stress Analysis and Low Stress Bike Route Identification Map
• Develop a GIS-based, user-friendly, route identification tool that will allow bicyclists on the Gilbert road network to plan trips
 that avoid routes with high levels of stress. This tool could provide families and younger children the opportunity to ride to
 destinations that previously didn’t seem possible due to safety concerns.

 32
BIKE GILBERT

CONCLUSION
The process of developing the 2019 Bike Gilbert Plan helped identify and prioritize the next steps for how to improve the conditions
for bicycling in Gilbert. Vital information gathered as a part of this planning process has been compiled into useful data sets,
tools, and action items that will guide our efforts moving forward to focus on improving the safety conditions for bicyclists utilizing
Gilbert’s network. For example, the findings from the thorough existing conditions analysis gave us a defined baseline for the
current conditions of bicycling in Gilbert today. With this baseline now established, there will be opportunities to see measurable
change as we begin implementation of the Plan.
Throughout the bike planning process, Staff members across many departments were engaged to help work through the data
analysis and other steps to complete the plan. These relationships and teams will continue to be crucial to the success of the Plan.
As the implementation of the Bike Gilbert Plan advances, progress will be closely evaluated and monitored and routinely reported
back to Town Management, Mayor and Town Council.
The identification and planning for funding opportunities, while not directly addressed in the Plan, is a required step that ultimately
will determine the rate of implementation and success of the Bike Planning Toolbox and Priority Action Items. The current options
available for the Town to deliver bike safety and improvement projects are through state and regional grant opportunities, and
through the Capital Improvements Program (the Town’s infrastructure budget), including routine maintenance and restriping
projects. Efforts to identify funding for bike projects will be an on-going discussion in the Town that needs to remain a priority if we
are to improve the safety conditions for bicycling in Gilbert.

 33
BIKE GILBERT

APPENDIX

 34
Gilbert Bike Plan Survey Results Feedback Period: 4/19/2018-5/21/2018

 18 to 24
 2%

 747
 65 or older
 4%
 46.6% 55 to 64
 Male 16% 35 to 44
 35%

 53.3 25 to 34
 Total Survey Submissions Female
 13%

 45 to 54
 30%

 On average, I bicycle... I bicycle to...
400 700

300 525

200 350

100 175

 0
 0
 k

 ly

 th

 ar

 er
 ee

 ai

 on

 rk

 at

 s

 op
 Ye

 ev

 k

 ol

 er
 nd

 or
 D
 W

 ho
 a

 /E

 th
 M

 N

 St
 /P

 W
 a

 ra

 O
 ng

 Sc
 a

 a

 se

 s
 e

 Er
 e

 Bu
 pi
 nc
 e
 nc

 ci
 nc

 op

 un
 ~O

 er
~O

 ~O

 Sh

 R
 Ex
The factors below limit how often I bicycle in Gilbert:
743 out of 747 people answered this question (with multiple choice)

Bad Driver Behaviors

61% 452 Responses

Unsafe Intersections
 452 Responses
49%
Not Enough Bike Lanes

42% 310 Responses

Automobile Traffic Levels

40% 300 Responses

Traveling with Small Children

16% 117 Responses

Destinations are Too Far Away

14% 103 Responses

None of These Apply to Me

13%
 96
 Responses

Unsure of Route
12%
 87
 Responses
Please rate which improvements you think would support more
bicycling in Gilbert:
Overall, under current conditions, No

do you feel safe riding a BICYCLE in 44%

 Gilbert? Yes
 56%
 741 out of 747 people answered this question

 Yes
 8%

 For parents of children under age
 18, do you feel safe allowing your
 Somewhat
 children to BICYCLE in Gilbert? 33%

 555 out of 747 people answered this question Not at all
 59%
Which bicycle lane design(s) would make you feel the most safe and
comfortable when bicycling?
741 out of 747 people answered this question

65.8% 46.1% 43.1%

 31.9% 26.1% 13.7%
5/21/2018 General report - Gilbert Bike Plan

 On average, I bicycle
 741 out of 747 people answered this question

 1 At Least Once a Week 359 / 48%

 2 Daily 161 / 22%

 3 At Least Once a Month 135 / 18%

 4 At Least Once a Year 54 / 7%

 5 Never 32 / 4%

 I bicycle to...
 736 out of 747 people answered this question

 1 Exercise or go to a Park 678 / 92%

 2 Go Shopping or to Eat 193 / 26%

 3 Run Errands 131 / 18%

 4 Go to Work 102 / 14%

 5 Other 67 / 9%

 6 Go to School 32 / 4%

 7 Get to and from a Bus Stop 6 / 1%

 The factors below limit how often I bicycle in Gilbert:
 743 out of 747 people answered this question

 1 Bad driver behaviors 452 / 61%

 2 Unsafe intersections 361 / 49%

 3 Not enough bike lanes 310 / 42%

 4 Automobile traffic levels 300 / 40%

 5 Traveling with small children 117 / 16%

 6 Destinations are too far away 103 / 14%

https://gilbertdigital.typeform.com/report/G2kqJL/JNFbzhGCqgrGDYGj?typeform-print=1&typeform-cache=0 1/5
5/21/2018 General report - Gilbert Bike Plan

 7 None of these apply to me 96 / 13%

 8 Unsure of route 87 / 12%

 More sidewalks/bike lanes/signed bike routes/green ways
 735 out of 747 people answered this question

 dD
 D dD
 dDd
 3.49 Average rating

 1 dddd 522 / 71%

 2 ddd 105 / 14%

 3 dd 55 / 7%

 4 d 53 / 7%

 Better intersections (pedestrian signals/crosswalks)
 737 out of 747 people answered this question

 dD
 D dD
 dDd
 3.22 Average rating

 1 dddd 401 / 54%

 2 ddd 158 / 21%

 3 dd 116 / 16%

 4 d 62 / 8%

 More separation from vehicle traffic
 740 out of 747 people answered this question

 dD
 D dD
 dDd
 3.69 Average rating

 1 dddd 592 / 80%

 2 ddd 83 / 11%

https://gilbertdigital.typeform.com/report/G2kqJL/JNFbzhGCqgrGDYGj?typeform-print=1&typeform-cache=0 2/5
5/21/2018 General report - Gilbert Bike Plan

 3 dd 45 / 6%

 4 d 20 / 3%

 Education/enforcement for motorists, pedestrians, & bicyclists
 738 out of 747 people answered this question

 dD
 D dD
 dDd
 3.06 Average rating

 1 dddd 387 / 52%

 2 dd 132 / 18%

 3 ddd 114 / 15%

 4 d 105 / 14%

 Secure bicycle parking
 736 out of 747 people answered this question

 dD
 D dD
 dd
 2.67 Average rating

 1 dddd 251 / 34%

 2 dd 188 / 26%

 3 d 154 / 21%

 4 ddd 143 / 19%

 Bicycle route map
 738 out of 747 people answered this question

 dD
 D dD
 dd
 2.95 Average rating

 1 dddd 344 / 47%

 2 ddd 137 / 19%

https://gilbertdigital.typeform.com/report/G2kqJL/JNFbzhGCqgrGDYGj?typeform-print=1&typeform-cache=0 3/5
5/21/2018 General report - Gilbert Bike Plan

 3 dd 132 / 18%

 4 d 125 / 17%

 Overall, under current conditions, do you feel safe riding a BICYCLE in Gilbert?
 741 out of 747 people answered this question

 1 Yes 413 / 56%

 2 No 328 / 44%

 Which bicycle lane design(s) would make you feel the most safe and comfortable when bicycling?
 741 out of 747 people answered this question

 1
 Concept 1 487 / 66%

 2
 Concept 2 341 / 46%

 3
 Concept 3 319 / 43%

 4
 Concept 4 236 / 32%

 5
 Concept 5 193 / 26%

 6
 Concept 6 102 / 14%

 For parents of children under age 18, do you feel safe allowing your children to BICYCLE in Gilbert?
 555 out of 747 people answered this question

 1
 Not at all – We only allow them to ride in close proximity to our house (i.e. small neighborhood streets) or on 327 / 59%
 trails only while we are with them

 2 Somewhat- they are only allowed to ride when we are with them, but we use the trails and roadways 185 / 33%

 3 Yes, they ride alone all the time 43 / 8%

 Gender:
 730 out of 747 people answered this question

 1 Female 389 / 53%

 2 Male 341 / 47%

https://gilbertdigital.typeform.com/report/G2kqJL/JNFbzhGCqgrGDYGj?typeform-print=1&typeform-cache=0 4/5
5/21/2018 General report - Gilbert Bike Plan

 Age category you fall into:
 739 out of 747 people answered this question

 1 35 to 44 257 / 35%

 2 45 to 54 221 / 30%

 3 55 to 64 118 / 16%

 4 25 to 34 98 / 13%

 5 65 or older 28 / 4%

 6 18 to 24 16 / 2%

 7 Other 1 / 0%

https://gilbertdigital.typeform.com/report/G2kqJL/JNFbzhGCqgrGDYGj?typeform-print=1&typeform-cache=0 5/5
LEGEND
D Driving behavior
EE Education & Events
EN Enforcement
 F Funding
 I Infrastructure
O Other

D Make it illegal to text and drive! Have been hit by distracted driver!! Also have had cans and water bottles thrown at us!
 Check out Central Florida's bike trails. With their comprehensive system of trails, I know they have extensive research and experience regarding a well thought out set of trails. I do
 know Orange and Seminole counties utilized my dad to come up with watercolor paintings to promote their trails. They wrapped several buses with the images and created swag
D and brochures to promote. I usually just ride on the sidewalk here in Az due to crazy drivers. I also won't bike Az trails due to terrain and natural habitat. I don't want to have to
 bike on gravel trails or in the gutter with the trash as crazy drivers are whizzing by me from behind that I can't see just to go to the corner store. Recycled tire asphalt is awesome
 for riding and it puts the old material to use.
D Ban texting for motorists! Strict enforcement with heavy fines. Especially millennials!
D In my opinion, a lot would need to be changed in order for me or my children to ride a bike in Gilbert. With so many distracted drivers, ie: texting and driving.
 Drivers are always looking down and not watching the road and swerve into the bike lanes. I use sidewalks for this reason if i can. There should be some kind of divider. Ive almost
D been hit multiple times crossing an intersection by someone turning left from across the way when i have a green walk signal. Cars also decide to use the bike lane whenever it
 benefits them (for parking or to go around the first person at an intersection if they want to turn right).
 I rode daily in Denver. Don’t feel safe off sidewalk in Gilbert. Too many near misses by distracted or rushed drivers that don’t expect to see me out there. Dangerous and not
D
 chancing it.
D Not sure how to fix it, but the number 1 issue I see is distracted automobile drivers. Also, with it being so hot here, walking & bicycling isn't super desirable for half of the year.
D Drivers also need to be far more accountable distracted driving.
D Outlaw driving and texting. People need to pay attention to their surroundings.
 drivers drive way too fast are distracted with multitasking making the 6 lane roadways nonconducive towards safely sharing with a bike path
D
 I am a older cyclist who rides for exercise, usually riding 15 to 20 miles, 3-5 days a week. I ride a cruiser, so I am too slow to ride in the existing bike lanes because I push street
D cyclists out into the road when they need to pass me. I, like young children, usually ride on the sidewalk. I have found that the most dangerous hazard is either inattentive drivers,
 or ill informed drivers who think they have the right away over cyclist, and turn across the path of a cyclist who are moving straight forward.
D Statute against cell phone use in cars.
D Enforcing a hands free law, so drivers can focus on driving.
 So many distractions nowadays with driving, mostly texting. I will be driving behind someone and they are driving into the bike lane for a few seconds and then swerve back over.
D Ridiculous. If there was a median/curb they would hit rather than a poor bicyclist first that would be great. Luckily I’ve never seen someone hit a cyclist in the bike lane but it still
 makes me sick thinking it can and will happen.
D People are too distracted while driving and there is of lack of care. I do not know if educating drivers or cyclist would be beneficial.
D Unfortunately, distracted driving is a big problem and not likely to go away any time soon, even with enforcement and education.
 Most drivers know the laws about being around bicycles, but they just don't care. With the little to no repercussions when they do injure/kill a cyclist they will not change they way
D
 they think about us cyclelist
 I would like to see keeping cyclists alive on our streets a major priority of this city. Far too many have been seriously injured or killed with little consequences for the driver. Cell
D phones need to be illegal in cars and drivers need to understand and be ok with the fact that there is a LARGE cycling community in this wonderful city. We have beautiful weather
 and wonderful roads and cyclists are being punished because impatient, angry drivers are unwilling to share.
 Riding my bike on our city streets with a speed limit of 45mph, and people texting and weaving while they drive scares the bejesus out of me. I only ride the canal or stay on the
D
 sidewalks. Hardly anybody walks on the sidewalks here anyway.
D We don't use bike Lanes because I don't trust the texting distracted auto drivers. We ride on the sidewalk, which is still dangerous, or the trails (canals) but they cross busy streets
D I see a lot of cars that drive in the bike lane, or use it as a right turn lane. Perhaps some signage explaining bike lane restrictions for cars would help?
D Motorists don’t notice foot or cycle traffic. I’ve nearly been hit more than once by red light runners.
 People do not pay attention when driving. I have seen too many situations that could have gone really bad if we/ pedistrians didn't stop and let the person driving just go since they
D
 didn't seem to want to yield to bicyclists and or pedistrians
D I don’t feel comfortable on my bike even in bike lanes. Drivers do not pay enough attention. I only ride the canals for that reason but still hate crossing roads.
You can also read