2019 PBR Progress Report 2017 - 2021 Performance Based Regulation Water Services, EPCOR
←
→
Page content transcription
If your browser does not render page correctly, please read the page content below
2019 PBR
                               Progress Report

       2017 – 2021 Performance Based Regulation
                   Water Services,
            Wastewater Treatment Services,
                and Drainage Services

2019
PBR Progress Report
EPCOR Water Services Inc.                                                                                                                   PBR 2017-2021

                                                                 Table of Contents

1      EXECUTIVE SUMMARY............................................................................................................................... 1
    1.1        FINANCIAL PERFORMANCE ....................................................................................................................... 1
    1.2        CAPITAL EXPENDITURES .......................................................................................................................... 2
    1.3        OPERATIONAL PERFORMANCE ................................................................................................................. 3
    1.4        RATES AND BILL COMPARISONS ............................................................................................................... 4
    1.5        NON-ROUTINE ADJUSTMENTS .................................................................................................................. 5
2      IN-CITY WATER SERVICES ........................................................................................................................ 8
    2.1     ACCOMPLISHMENTS AND CHALLENGES ..................................................................................................... 8
    2.2     CUSTOMERS AND CONSUMPTION ............................................................................................................. 8
    2.3     FINANCIAL PERFORMANCE ..................................................................................................................... 10
       2.3.1 Revenue ......................................................................................................................................... 10
       2.3.2 Operating Expenses by Function ................................................................................................... 12
       2.3.3 Operating Expenses by Cost Category .......................................................................................... 14
       2.3.4 Depreciation and Amortization ....................................................................................................... 15
       2.3.5 Rate Base ....................................................................................................................................... 16
       2.3.6 Return on Rate Base ...................................................................................................................... 17
       2.3.7 Transactions with Affiliates ............................................................................................................. 18
    2.4     CAPITAL PROGRAMS ............................................................................................................................. 19
       2.4.1 Capital Expenditures ...................................................................................................................... 19
       2.4.2 Construction Work in Progress ....................................................................................................... 25
    2.5     OPERATIONAL PERFORMANCE ............................................................................................................... 26
       2.5.1 Water Quality Index ........................................................................................................................ 26
       2.5.2 Customer Service Index ................................................................................................................. 27
       2.5.3 System Reliability and Optimization Index ..................................................................................... 28
       2.5.4 Environment Index.......................................................................................................................... 30
       2.5.5 Safety Index .................................................................................................................................... 31
    2.6     RATES AND BILL COMPARISONS ............................................................................................................. 32
       2.6.1 Residential Water Bills.................................................................................................................... 32
       2.6.2 Commercial Water Bills .................................................................................................................. 33
3      WASTEWATER TREATMENT SERVICES ................................................................................................ 34
    3.1     ACCOMPLISHMENTS AND CHALLENGES ................................................................................................... 34
    3.2     CUSTOMERS AND CONSUMPTION ........................................................................................................... 34
    3.3     FINANCIAL PERFORMANCE ..................................................................................................................... 35
       3.3.1 Revenue ......................................................................................................................................... 35
       3.3.2 Operating Expenses by Function ................................................................................................... 36
       3.3.3 Operating Expenses by Cost Category .......................................................................................... 38
       3.3.4 Depreciation and Amortization ....................................................................................................... 39
       3.3.5 Rate Base ....................................................................................................................................... 39
       3.3.6 Return on Rate Base ...................................................................................................................... 40
       3.3.7 Transactions with Affiliates ............................................................................................................. 41
    3.4     CAPITAL PROGRAMS ............................................................................................................................. 42
       3.4.1 Capital Expenditures ...................................................................................................................... 42
       3.4.2 Construction Work in Progress ....................................................................................................... 46
    3.5     OPERATIONAL PERFORMANCE ............................................................................................................... 47
       3.5.1 Water Quality and Environmental Index ......................................................................................... 47

i                                                                                                                                              July 15, 2020
PBR 2012-2016 EPCOR Water Services Inc.
3.5.2 Customer Service Index ................................................................................................................. 48
3.5.3 System Reliability and Optimization Index ..................................................................................... 49
3.5.4 Safety Index .................................................................................................................................... 50
3.6 RATES AND BILL COMPARISONS ............................................................................................................. 51
3.6.1 Residential Wastewater and Drainage Bills ................................................................................... 51
3.6.2 Commercial Wastewater and Drainage Bills .................................................................................. 52
4 DRAINAGE SERVICES .............................................................................................................................. 54
4.1 ACCOMPLISHMENTS AND CHALLENGES ................................................................................................... 54
4.2 CUSTOMERS AND CONSUMPTION ........................................................................................................... 55
4.3 FINANCIAL PERFORMANCE ..................................................................................................................... 55
4.3.1 Revenue ......................................................................................................................................... 56
4.3.2 Operating Expenses by Function ................................................................................................... 57
4.3.3 Operating Expenses by Cost Category .......................................................................................... 59
4.3.4 Depreciation and Amortization ....................................................................................................... 60
4.3.5 Rate Base ....................................................................................................................................... 60
4.3.6 Return on Rate Base ...................................................................................................................... 61
4.3.7 Transactions with Affiliates ............................................................................................................. 62
4.4 CAPITAL PROGRAMS ............................................................................................................................. 63
4.4.1 Capital Expenditures ...................................................................................................................... 63
4.4.2 Construction Work in Progress ....................................................................................................... 69
4.5 OPERATIONAL PERFORMANCE ............................................................................................................... 69
4.5.1 Water Quality and Environmental Index ......................................................................................... 69
4.5.2 Customer Service Index ................................................................................................................. 70
4.5.3 Reliability and Optimization Index .................................................................................................. 70
4.5.4 Safety Index .................................................................................................................................... 71
4.6 RATES AND BILL COMPARISONS ............................................................................................................. 72
5 2019 ANNUAL OPERATING PLANS ......................................................................................................... 73
5.1 WATER SERVICES AND WASTEWATER TREATMENT SERVICES ................................................................. 73
5.2 DRAINAGE SERVICES ............................................................................................................................ 79
APPENDIX A: PBR PLAN 2017-2021 ................................................................................................................ 88
A.1 IN-CITY WATER AND WASTEWATER .............................................................................................................. 88
A.1.1 PBR Framework ................................................................................................................................. 88
A.1.2 Risks and Incentives .......................................................................................................................... 88
A.1.3 Customer Classes and Rate Structure .............................................................................................. 89
A.2 DRAINAGE ................................................................................................................................................... 91
A.2.1 PBR Framework ................................................................................................................................. 91
A.2.2 Customer Classes and Rate Structure .............................................................................................. 91
July 15, 2020 iiEPCOR Water Services Inc. PBR 2017-2021
1 Executive Summary
This report provides an annual update to the City of Edmonton on the operational and financial results
for the year ended December 31, 2019 for water services (“In-City Water”), wastewater treatment
services (“Wastewater”), and, sanitary and storm water sewer services (“Drainage”) provided within
Edmonton by EPCOR Water Services Inc. (“EWSI”). The City of Edmonton City Council regulates In-City
Water and Wastewater in accordance with the Performance Based Regulation (“PBR”) Plan approved in
the EPCOR Water Services and Wastewater Treatment Bylaw No. 17698 (“Bylaw 17698”) and Drainage
in accordance with the PBR Plan approved in EPCOR Drainage Services Bylaw No. 18100 (“Bylaw
18100”).
1.1 Financial Performance
In-City Water, Wastewater and Drainage’s financial performance for 2019 are summarized in Table 1.1
below1:
Table 1.1
Revenue and Return on Equity
($ millions)
A B C D
2019 2017-2019
Revenue and Return on Equity PBR PBR
Forecast Actual Forecast Actual
1 In-City Water
2 Revenue 205.8 191.3 593.9 571.2
3 Return on Equity 40.8 34.4 117.1 110.2
4 Rate of Return on Equity 10.18% 8.56% 10.18% 9.61%
5 Wastewater
6 Revenue 105.6 99.1 297.4 286.0
7 Return on Equity 19.2 19.3 53.0 58.5
8 Rate of Return on Equity 10.18% 10.93% 10.18% 11.84%
9 Drainage
10 Revenue 202.4 199.0 399.0 393.6
11 Return on Equity 22.8 28.5 58.9 61.4
12 Rate of Return on Equity 3.98% 4.76% 5.21% 5.21%
In 2019, In-City Water achieved an 8.56% rate of return on equity (9.61% for 2017-2019), compared to
its forecast rate of return of 10.175%. In-City Water returns were challenged by lower than forecast
revenue driven by lower than forecast inflation adjustments to rates, and lower than forecast
consumption, partially attributable to higher than average precipitation over the summer months.
Operating expense reductions achieved by In-City Water ($8.9 million) were unable to fully offset
reductions to revenue.
1
Consistent with the 2017-2021 PBR Application, all financial data in this report, including totals and sub-totals, are rounded to
the nearest $0.1 million. This practice ensures continuity of data between tables and between years. However, the sum of the
rounded detailed data in certain tables may not be equal to the related rounded total or sub-total.
1 July 15, 2020PBR 2012-2016 EPCOR Water Services Inc.
Wastewater’s revenues have been affected by the same factors as In-City Water, with lower than forecast
operating expenses, combined with a lower than forecast rate base, enabled Wastewater to achieve a
10.93% rate of return in 2019 (11.84% for 2017-2019), compared to its forecast rate of return of 10.175%.
In 2019, Drainage realized a 4.76% rate of return on equity, 0.78% greater than its forecast rate of return.
Lower revenues resulting from lower than forecast consumption was offset by lower than forecast
operating expenses and lower than forecast rate base. Since Drainage does not have a City of
Edmonton-approved PBR forecast, Drainage’s actual financial performance for 2018 has been compared
to its EPCOR budget, adjusted (1) to remove one-time costs related to the transition of Drainage to
EPCOR, and (2) from IFRS to a regulatory accounting basis. The adjusted budget, escalated at an
appropriate inflation rate, will serve as the basis for comparison of actual to forecast financial results for
the remainder of the 2017-2021 PBR term.
Detailed analyses of In-City Water, Wastewater and Drainage’s financial performance for 2019 and for
the 2017-2019 period are provided in sections 2.3, 3.3, and 4.3, respectively.
1.2 Capital Expenditures
In-City Water, Wastewater and Drainage’s capital expenditures for 2019 and for the five-year term of the
PBR Plan (the “2017-2021 PBR term”) are summarized in Table 1.2 below:
Table 1.2
Capital Expenditures
($ millions)
A B C D E F
2019 2017-2019* 2017-2021
Capital Expenditures PBR PBR PBR Current
Forecast Actual Forecast Actual Forecast Projection
1 In-City Water 87.0 113.0 276.4 307.6 475.8 574.1
2 Wastewater 53.3 49.3 165.6 148.5 235.4 238.6
3 Drainage 169.1 141.9 291.7 250.9 667.4 711.6
* Drainage Forecast and Actual results only include 2018-2019, 2018 is the first full year of Drainage operation following the
transfer to EPCOR in September 2017.
Over the course of the PBR term, changes to capital programs are required to address unforeseen needs
for repairs or rehabilitation, changes in regulatory or operational requirements, customer demands, and
other external factors. These changes are coordinated through EWSI’s Project Management Office and
are authorized by EWSI’s Capital Project Steering Committee, EUI’s Financial Review Council, or
EPCOR’s Board of Directors, depending on the amount of the expenditure. EWSI also presents
information on its capital programs, as well as business cases supporting significant new capital projects
to the Utility Committee throughout the year.
1. In-City Water’s 2017-2021 projected capital expenditures of $574.1 million are $98.4 million (20.7%)
greater than the PBR forecast. Significant projects contributing to this variance includes the E.L. Smith
Solar Farm ($35.3 million), which is funded through the special rate adjustment for Environmental
Initiatives; changes to the scope of the Water D&T Facility Expansion, which adds an additional $8.8
million to its cost. Besides these projects, there are three projects that the City has approved as non-
July 15, 2020 2EPCOR Water Services Inc. PBR 2017-2021
routine adjustments, including: (i) an enhanced Lead Mitigation Program ($25.3 million) needed to
conform to new Health Canada Guidelines; (ii) additional costs of LRT Relocations ($12.2 million)
needed to realign distribution network infrastructure; and (iii) the acquisition of the Discovery Park
Reservoir and Capital Region Southwest Water Services Commission (CRSWSC) Water Pipeline
($9.5 million), following the City of Edmonton’s annexation of land in Leduc County. Compared to
the prior year forecast, the 2017-2021 projected capital expenditures have decreased by $40.7
million. This reduction reflects the preliminary impacts of the ongoing COVID-19 pandemic on In-City
Water’s capital program.
Wastewater’s 2017-2021 projected capital expenditures of $238.6 million are $3.2 million (1.4%)
greater than the PBR forecast. The Gold Bar Wastewater Treatment Plant’s aging infrastructure
poses challenges to capital planning. Since the plant cannot be shutdown for maintenance, it is often
difficult to accurately assess asset condition and the scope of rehabilitation needed before
commencing work on a project. During preliminary engineering in 2017 and 2018, EWSI identified
significant needs for repairs to critical infrastructure that had not been anticipated in the PBR forecast.
EWSI reviewed design options and employed value engineering to reprioritize reliability and life cycle
replacements. These efforts have ensured that changes to projections of the total cost of the 2017-
2021 capital expenditures program have resulted in only a slight increase from the PBR forecast.
Drainage’s 2018-2021 projected capital expenditures of $667.4 million are $44.2 million (7%)
greater than its long-term plan. This increase includes a $37.3 real estate initiative (a combined water
and drainage facility – also referenced in water’s capital expenditure section above), as well as
substantial shifts of projected costs between programs as drainage continues to refine and
reprioritize its overall capital expenditures program to address asset condition, mitigate the risk of
failure, and maintain required service levels.
Detailed explanations for differences between capital expenditures in PBR forecast and EWSI’s current
projections are provided in Sections 2.4, 3.4 and 4.4.
1.3 Operational Performance
In-City Water’s and Wastewater’s operational performance is measured by the results of indices
prescribed in Schedule 3 of Bylaw 17698 with each index consisting of one or more performance
measures. Performance under each index is measured independently on a point basis with 100 base
points available if the standards for all performance measure indices are achieved. Bonus points are
available for performance above standards and financial penalties are applied if EWSI does not meet the
100 base point standard.
In 2019, In-City Water exceeded the performance standards for all five of its performance measure
indices and Wastewater exceeded the performance standards for all four of its performance measure
indices. Detailed discussions of the performance measures making up each of the indices and
operational performance highlights are provided in Section 2.5 for In-City Water and Section 3.5 for
Wastewater.
3 July 15, 2020PBR 2012-2016 EPCOR Water Services Inc.
Table 1.3-1
2019 Performance Measures
A B C D
In-City Water Wastewater
Performance Index Actual Actual
Standard Score Standard Score
1 Water Quality Index(1) 25.0 25.0 55.0 60.5
2 Customer Service Index 20.0 21.0 15.0 16.5
3 System Reliability and Optimization Index 25.0 28.5 15.0 16.5
4 Environmental Index(1) 15.0 16.5 n/a n/a
5 Safety Index 15.0 16.5 15.0 16.5
6 Aggregate Points Earned 100.0 107.5 100.0 110.0
1 Water Quality and Environmental are combined into one index for Wastewater’s operational performance
Drainage’s operational performance is measured by the results of four indices prescribed in Schedule 3
of Bylaw 18100 with each index consisting of one or more performance measures. These performance
measures are patterned after previous Drainage Utility service quality metrics and do not include a
scoring system similar to those of In-City Water and Wastewater.
In 2019, Drainage met or exceeded performance standards for ten of thirteen performance measures
included in the four performance measure indices. Detailed discussions of the performance measures
making up each of index and highlights of Drainage’s operational performance are provided in Section
4.5.
2019 is the last year Drainage Services will be reporting on these performance measures. Pursuant to
City Council’s approval of amendments to Bylaw 18100 on February 19, 2020, EWSI introduced new
PBR performance metrics, scoring and penalties beginning in 2020. The new proposed PBR metrics
program is effective for the remainder of the PBR term (2020 and 2021), and is patterned after the water
and wastewater PBR metrics and meets the requirements of the Letter of Intent developed for the
transition of Drainage Services from the City to EPCOR.
1.4 Rates and Bill Comparisons
In 2019, the average monthly bill for In-City Water customers, based on 2019 average monthly
consumption per residential customer of 13.8 m3, was $36.15, an increase of 2.8% from 2018. This
increase consists of the 1.2% inflation adjustment discussed in Section 2.3.1, and special rate
adjustments approved in Bylaw 17698 for Environmental Initiatives (0.3%), Accelerated Programs (0.5%)
and Rebasing (0.8%).
The average residential customer’s wastewater treatment bill in 2019, also based on monthly
consumption of 13.8 m3, was $17.33, an increase of 5.5% from 2018. This increase includes the 1.2%
inflation adjustment, and the special rate adjustment for rebasing of 4.3% needed to support
Wastewater’s 2017-2021 capital programs.
The average residential customer’s drainage bill in 2019, again based on monthly consumption of 13.8
m3, was $34.55, an increase of 3.0% from 2018. Drainage rates from January 1, 2018 to March 31, 2022
July 15, 2020 4EPCOR Water Services Inc. PBR 2017-2021
have been set in Bylaw 18100, which, except for Non-Routine Adjustments (Section 1.5), limits average
annual bill increases to 3.0%.
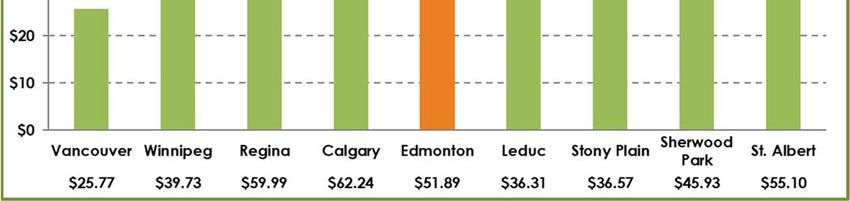
EWSI undertakes annual bill comparison surveys with various cities and local communities. Section 2.6
shows that EWSI’s residential water rates are lower than most of the cities and communities included in
the comparison, with only Vancouver having lower water rates. Drainage and Wastewater bills are more
difficult to compare because of variations in the nature and extent of wastewater treatment, the inclusion
of certain services in property taxes, and geographic and climatic factors which influence the level of
investment in and approach to flood mitigation. Section 3.6 shows that Edmonton’s combined Drainage
and Wastewater treatment rates are competitive with those of other cities and communities with similar
geographic and climatic conditions. Commercial bill comparisons for both water and wastewater show
similar results to residential water and wastewater bills.
1.5 Non-Routine Adjustments
Non-routine adjustments for In-City Water and Wastewater are defined in Bylaw 17698, and for Drainage
in Bylaw 18100, as “items which are unusual, significant in size or nature, and beyond the scope of control
of EWSI”. Bylaws 17698 and 18100 allow EWSI to request adjustments to In-City Water, Wastewater
and Drainage rates for non-routine adjustments from the City Manager or City Council, depending on the
impact of the non-routine adjustment on In-City Water, Wastewater or Drainage’s revenue requirements.
In 2019, EWSI received approval to increase In-City Water and Drainage rates for the following projects
that qualified as non-routine adjustments outlined in Bylaw 17698, Schedule 3, Section 5.0 for Water and
Wastewater, or in Bylaw 18100, Schedule 3 Section 4.1 for Drainage. These non-routine adjustments
will be included in Drainage rates commencing January 1, 2020, January 1, 2021, and January 1, 2022,
and will be included in In-City Water rates commencing April 1, 2020 and escalating by inflation less the
productivity factor in April 1, 2021.
Lead Mitigation Strategy (In-City Water) – On March 22, 2019, EWSI presented a new lead
mitigation strategy to the Utility Committee. This strategy is designed to meet new Health Canada
Guidelines that reduce the maximum concentration of lead in drinking water at the tap from 10 parts
per billion to 5 parts per billion. On July 16, 2019, EWSI received approval to apply the non-routine
adjustments to In-City water rates commencing April 1, 2020 to recover the costs of implementing
this strategy. The additional cost to an average Residential In-City Water customer will be $0.40 per
month commencing April 1, 2020 (or a total of $10.91 over the remainder of the 2017-2021 PBR
term).
Leduc County Annexation (In-City Water) – On November 27 2018, the Government of Alberta
approved the City of Edmonton’s annexation of 8,260 hectares from Leduc County. As part of the
annexation, EWSI will acquire the existing water infrastructure within or required to service the
annexed area, including a reservoir, pump house and booster station, as well as transmission mains
and a small distribution system, at a cost of $9.5 million which is comprised of $7.8 million for the
Discovery Park reservoir and the remainder for a pipeline and booster station. On November 7, 2019,
EWSI received approval to apply the non-routine adjustments to In-City water rates commencing April
1, 2020 to recover the costs related to the annexation. The additional cost to the average Residential
5 July 15, 2020PBR 2012-2016 EPCOR Water Services Inc.
In-City Water customer will be $0.26 per month commencing April 1, 2020 ($7.09 over the remainder
of the PBR term).
LRT Relocations (In-City Water and Drainage) – EWSI has identified work needed to
accommodate water main, hydrant and sewer relocations for the West Valley Line and Metro Line
Northwest Phase I LRT projects. On November 7, 2019, (Drainage) and December 23, 2019 (In-City
Water) EWSI received approvals to apply the non-routine adjustments to water rates for In-City Water
customers commencing April 1, 2020 and to sanitary utility and storm water utility rates for Drainage
customers commencing January 1, 2020. The additional cost to the average Residential In-City Water
customer is $0.17 per month commencing April 1, 2020 ($4.64 over the remainder of the PBR term).
The average monthly bill increase for Residential Drainage customers is $0.14 per month
commencing January 1, 2020, an additional $0.37 per month commencing in January 1, 2021, and
an additional $0.31 per month commencing on January 1, 2022 (or a total of $10.26 over the
remainder of the 2018-2021 PBR term).
Stormwater Integrated Resource Plan (Drainage) – On May 10, 2019, EWSI presented its
Stormwater Integrated Resource Plan (SIRP) alternatives to the Utility Committee. The plan includes
a mix of capital and operational program investments to mitigate flood risks across the City using a
mix of grey and green infrastructure components installed within the public right-of-way or within City
or EPCOR owned parcels. The SIRP approach allows for a lower overall capital investment than seen
with traditional engineering approaches through the inclusion of operational programs that support
the overall community in responding to flooding events. On December 2, 2019, EWSI received
approval to apply the non-routine adjustments to storm water utility rates commencing January 1,
2020. The additional cost to the average Residential Drainage customer is $0.51 per month
commencing January 1, 2020, an additional $0.15 per month commencing January 1, 2021, and an
additional $0.03 commencing January 1, 2022 (or a total of $16.11 over the remainder of the 2018-
2021 PBR term).
Corrosion and Odour Reduction Strategy (Drainage) – On June 28 2019, EWSI presented its
Corrosion and Odour Reduction Strategy to the Utility Committee. The Corrosion and Odour
Reduction Strategy was developed using similar principles and approaches to EWSI’s SIRP to
determine an optimized mix of operational and capital solutions to reduce corrosion and odour. The
strategy expands the previous plan by focusing on preventing the formation of hydrogen sulphide
gas, which will reduce community odour impacts and lengthen the life of sewer network assets. Areas
of focus within the strategy include: prevent the formation of hydrogen sulphide gas in the sewer
system, control the release of air from the sewer system, and adapt the system using real-time
monitoring technologies and improved inspection data. On December 2, 2019, EWSI received
approval to apply the non-routine adjustments to sanitary utility rates commencing January 1, 2020.
The additional cost to the average Residential Drainage customer is $0.53 per month commencing
January 1, 2020, an additional $0.42 per month commencing January 1, 2021, and an additional
$0.06 per month commencing January 1, 2022 (or a total of $20.79 over the remainder of the PBR
term).
Table 1.5 summarizes the average Residential customer monthly bill impact for all non-routine adjustment that
have been approved over the 2017-2021 PBR term. These non-routine adjustments include the five non-
routine adjustments detailed above, plus the negative non-routine adjustment approved in 2018, passing on
July 15, 2020 6EPCOR Water Services Inc. PBR 2017-2021
reductions in corporate shared service cost allocations resulting from the transfer of Drainage Services assets
to EPCOR to In-City Water and Wastewater customers.
Table 1.5
Non-Routine Adjustments
Monthly Residential Bill Impacts
($)
A B C
2022*
Non-Routine Adjustment
2020 2021 (Jan to Mar)
1 Corporate Cost Reduction (Drainage Transfer) (1.04) (1.05) (1.05)
2 Lead Mitigation Strategy 0.40 0.41 0.41
3 Leduc County Annexation 0.26 0.26 0.26
4 LRT Relocations 0.31 0.68 0.99
5 Corrosion and Odour Reduction Strategy 0.53 0.95 1.01
6 Stormwater Integrated Resource Plan 0.51 0.66 0.69
7 Total Monthly Bill Impact 0.97 1.91 2.31
* EWSI’s current bylaws expire on March 31, 2022. New bylaws with updated rates would be in effect for
the remainder of 2022.
7 July 15, 2020PBR 2012-2016 EPCOR Water Services Inc.
2 In-City Water Services
2.1 Accomplishments and Challenges
In 2019, In-City water had significant accomplishments, including:
In June, at the American Water Works Association’s (AWWA) Annual Conference and Exposition
Edmonton's tap water was named the People's Choice Winner of AWWA Tap Water Taste Test,
as voted by thousands of water experts who attended the AWWA conference;
In partnership with Alberta Environment and Parks, the City of Edmonton and the North
Saskatchewan Watershed Alliance, The WaterSHED (Water: Saskatchewan Headwaters,
Edmonton and Downstream) Monitoring Program was launched. In 2019 installation and
upgrades were completed on a network of 19 monitoring stations along the North Saskatchewan
River, from its headwaters in the Columbia Icefields to the Saskatchewan border. As Alberta's
most extensive water quality monitoring and sampling program, it will improve understanding of
how the river functions, how it is being impacted by land-use decisions and actions, and how it
may change in the future;
In February, Edmonton experienced one of the coldest months in nearly 40 years. This colder
than average temperate resulted in a significant increase in the number of frozen services in 2019.
EWSI’s D&T crews identified innovative methods to quickly and cost effectively thaw frozen
service lines, and restore service to affected customers;
In early 2019, EWSI received approval, from the City of Edmonton Utility Committee, to proceed
with its comprehensive Lead Mitigation Strategy to meet new Health Canada Guidelines for
Canadian Drinking Water Quality. This strategy is intended to reduce lead levels in over 4,400
homes with lead service lines and over 23,000 homes with high lead levels related to lead
plumbing and plumbing fixtures ensuring that EWSI provides safe drinking water to the citizens
of Edmonton;
Additional accomplishments are included in the 2019 Operating Plan below.
2.2 Customers and Consumption
In-City Water provides services to three customer classes: Residential; Multi-Residential; and
Commercial (see Appendix A). These classes are unchanged from the previous PBR term and are
described in detail in Appendix A. Customer counts, total annual consumption and monthly consumption
per customer are shown in Table 2.2 below:
July 15, 2020 8EPCOR Water Services Inc. PBR 2017-2021
Table 2.2
Customers, Consumption and Consumption per Customer
A B C D
2019 2017-2019
Customers and Consumption PBR PBR
Forecast Actual Forecast Actual
Customers
1 Residential 266,138 269,842 261,207 264,554
2 Multi-Residential 3,837 3,779 3,792 3,765
3 Commercial 19,761 19,918 19,509 19,679
4 Total 289,736 293,539 284,507 287,998
Consumption per Customer (m3 per month)
5 Residential 14.2 13.8 14.4 14.3
6 Multi-Residential 408.6 391.8 408.6 392.7
7 Commercial 120.3 109.3 121.9 114.2
Annual Consumption (ML)
8 Residential 45,215.1 44,603.1 135,406.1 135,913.0
9 Multi-Residential 18,813.6 17,766.6 55,774.0 53,234.2
10 Commercial 28,529.4 26,133.3 85,602.5 80,897.8
11 Total 92,558.0 88,502.9 276,782.7 270,045.0
The factors contributing to actual to forecast differences for 2019 and for 2017-2019 differ by customer
class, as explained below:
Residential. Customer counts in 2019 are 1.4% greater than forecast, primarily because of higher
than expected actual customer counts at the beginning of the 2017-2021 PBR term. In 2019,
consumption per customer was 2.7% lower than forecast, primarily attributable to higher than average
precipitation over the summer months. Over the 2017-2019 period actual consumption per customer
is slightly lower then the PBR forecast, confirming the robust residential forecasting methodology
developed for the 2017-2021 PBR forecast. The combined effect of these factors is that total
residential consumption for 2019 is 1.4% lower than forecast (0.4% greater for 2017-2019).
Multi-Residential. Growth in the multi-residential customer counts continue to be lower than forecast,
in 2019 customer counts decreased to 1.5% lower than forecast (from 0.7%). Lower than forecast
consumption per customer, combined with lower customer counts, meant that total consumption was
5.6% less than forecast. Lower than forecast consumption per customer is not attributable to a
specific cause, but reflects a variety of factors, including: vacancy rates, renovations of older
buildings; and the number of units in new multi-residential buildings.
Commercial. Consumption in the commercial customer class was 8.4% less than forecast, despite
a 0.8% increase in customer counts. This class includes a large number of customers that use very
little water (offices, convenience stores, etc.) and a small number of customers with very high levels
of consumption (food and beverage producers, malls, etc.). In 2019, EWSI’s billing system data
showed that 217 (1.1%) of commercial customers accounted for 50% of commercial consumption.
Therefore, the loss of a large customer can cause significant shifts in consumption per customer for
the entire class. As well, since new customers tend to be low water consumers, increases in customer
counts may not have significant effects on overall consumption for the commercial customer class.
Accordingly, EWSI is exploring opportunities to expand the application of the forecasting methodology
developed for the residential class to the commercial and multi-residential customer classes for future
PBR periods.
9 July 15, 2020PBR 2012-2016 EPCOR Water Services Inc.
2.3 Financial Performance
In-City Water’s net income is derived from the provision of water services within Edmonton’s boundaries.
Besides these services, EWSI provides water services to surrounding communities under bulk water
supply agreements with regional water service commissions (“RWCG” or “Regional Customers”), and
fire protection services to the City of Edmonton under a service agreement (“Fire Protection”).
EWSI’s water system is fully integrated, with services jointly provided to In-City Water, Regional
Customers and Fire Protection. Therefore, in sections 2.3.1 to 2.3.7, operating costs, depreciation, rate
base and capital expenditures are presented and analyzed on a total system basis. In-City Water’s share
of these expenses, as well as its returns on rate base, are calculated in accordance with a cost of service
model developed jointly by EWSI, the regional water service commissions and the City of Edmonton, and
are shown as separate line items on each applicable table. In-City Water’s total revenue and revenue
requirements are summarized in Table 2.3 below:
Table 2.3
In-City Water Revenue Requirements
($ millions)
A B C D
2019 2017-2019
Summary of Revenue Requirements PBR PBR
Forecast Actual Forecast Actual
1 In-City Water Rate Revenue(1) 200.8 185.8 579.0 554.5
2 In-City Water Revenue Requirement
3 Operating expenses 108.1 99.5 314.8 295.5
4 Other revenue (5.0) (5.5) (14.9) (16.8)
5 Depreciation and amortization 28.4 28.4 81.1 81.3
6 Return on rate base financed by debt 29.4 29.0 84.3 84.2
7 Return on rate base financed by equity 40.8 34.4 117.1 110.2
8 In-City Water Revenue Requirement* 201.6 185.8 582.4 554.5
9 Return on Rate Base Financed by Equity 10.18% 8.56% 10.18% 9.61%
1 In the PBR forecast, rebasing and other special rate adjustments have been smoothed over the PBR term. Therefore,
although forecast revenue is equal to the revenue requirement over the 2017-2021 PBR term, in any year within the PBR
term, forecast revenue may be greater or less than the revenue requirement.
2.3.1 Revenue
In-City Water’s rate revenues include fixed monthly services charges which vary by meter size and
consumption charges applied to each cubic meter of water consumed. Besides rate revenue, In-City
Water revenues also include other revenue derived from temporary services, connection fees, water
permits, late payment charges and other incidental services. Table 2.3.1-1 below provides a comparison
of 2019 In-City Water revenues to the PBR forecast:
July 15, 2020 10EPCOR Water Services Inc. PBR 2017-2021
Table 2.3.1-1
In-City Water Revenue
($ millions)
A B C D
2019 2017-2019
In-City Water Revenue PBR PBR
Forecast Actual Forecast Actual
1 Fixed Monthly Service Charges
2 Residential 24.2 21.4 69.6 64.5
3 Multi-Residential 1.5 1.4 4.3 4.0
4 Commercial 4.5 3.9 12.8 11.9
5 Fixed Monthly Service Charges 30.3 26.6 86.7 80.3
6 Consumption Charges
7 Residential 100.6 95.2 291.1 283.7
8 Multi-Residential 31.5 29.1 90.4 85.3
9 Commercial 38.4 34.8 110.9 105.2
10 Consumption Charges 170.5 159.2 492.3 474.2
11 In-City Water Rate Revenue 200.8 185.8 579.0 554.5
12 Other Revenue 5.0 5.5 14.9 16.8
13 Total In-City Water Revenue 205.8 191.3 593.9 571.2
In-City rate revenues were $15.0 million less than forecast in 2019, and $24.5 million less than forecast
over the 2017-2019 PBR period. This difference is attributable to the following factors:
Lower than forecast inflation resulted in a $6.1 million decrease in 2019 ($11.0 million for 2017-2019).
The PBR plan limits Water and Wastewater’s annual routine rate adjustments to inflation less an
efficiency factor (see Appendix A.1). As shown in Table 2.3.1-2, actual PBR inflation adjustments for
2019 and 2017-2019 are significantly less than forecast. The effect of lower than forecast inflation
from 2016 to 2019 will continue to impact revenues throughout the remainder of the 2017-2021 PBR
term.
Table 2.3.1-2
2018 PBR Inflation Adjustment
A B C D
2019 2017-2019
PBR Inflation Adjustment to In-City Water
PBR PBR
and Wastewater Rates
Forecast Actual Forecast Actual
1 Forecast Inflation
2 CPI 2.20% 2.10% 6.75% 6.33%
3 Labour 2.40% 1.20% 7.37% 4.67%
4 Weighted Inflation (65% CPI, 35% Labour) 2.27% 1.79% 6.97% 5.75%
5 Less: Efficiency Factor -0.25% -0.25% -0.75% -0.75%
6 Forecast Inflation 2.02% 1.54% 4.08% 3.39%
7 Actual to Forecast Inflation Adjustment - -0.35% - -1.72%
8 PBR Inflation Adjustment 2.02% 1.18% 4.08% 1.96%
Lower than forecast consumption (see section 2.2) resulted in a $6.3 million decrease in 2019
revenues ($9.3 million for 2017-2019). These decreases were partially offset by slight increases in
customer counts which resulted in a $0.4 million increase in revenue in 2019 ($1.0 million for 2017-
2019; and
A negative non-routine adjustment to 2018 water rates decreased revenues by $3.0 million in 2019
($5.1 million for 2017-2019). This non-routine adjustment fulfills EPCOR’s commitment to the City to
11 July 15, 2020PBR 2012-2016 EPCOR Water Services Inc.
flow the benefits of any reductions in corporate shared service cost allocations resulting from the
transfer of Drainage Services assets to EPCOR to In-City Water and Wastewater customers through
a negative non-routine adjustment.
Besides rate revenues, In-City Water earned $5.5 million in other revenue in 2019, $0.5 million greater
than forecast ($1.8 million greater for 2017-2019). This increase includes $0.2 million in fees charged to
private developers for water main flushing for new developments ($0.8 million for 2017-2019), and $0.3
million in additional customer service revenue ($1.0 million for 2017-2019).
2.3.2 Operating Expenses by Function
Table 2.3.2 below provides a comparison of EWSI’s total water system operating expenses for 2019 to
the PBR forecast.
Table 2.3.2
Operating Expenses by Function
($ millions)
A B C D
2019 2017-2019
Function and Sub-function PBR PBR
Forecast Actual Forecast Actual
1 Power, Other Utilities and Chemicals
2 Power and Other Utilities 14.4 10.3 40.4 31.8
3 Chemicals 7.4 11.7 21.9 28.0
4 Power, Other Utilities and Chemicals 21.8 22.0 62.3 59.9
5 Water Operations
6 Water Treatment Plants 19.6 18.9 57.6 55.4
7 Water Distribution and Transmission 25.6 26.5 75.3 78.9
8 Operational Support Services 7.6 6.9 22.2 20.8
9 Quality Assurance and Environment 6.6 6.8 18.5 18.9
10 Capitalized Overhead Costs (7.4) (8.3) (21.8) (22.9)
11 Water Operations 52.0 50.9 151.9 151.2
12 Billing, Meters and Customer Service
13 Billing and Collections 8.4 7.8 24.3 23.6
14 Meter Reading, Repairs and Maintenance 2.8 2.2 9.0 6.2
15 Customer Service 0.9 0.4 2.3 1.7
16 Billing, Meters and Customer Service 12.1 10.4 35.7 31.4
17 EWSI Shared Services
18 EWSI Shared Services 10.2 9.1 29.9 27.9
19 Incentive and Other Compensation 3.3 2.9 9.6 9.0
20 EWSI Shared Services 13.4 12.0 39.6 36.9
21 Corporate Shared Services 15.6 12.1 45.9 37.0
22 Franchise Fees and Property Taxes
23 Franchise Fees 15.8 14.7 45.7 43.8
24 Property Taxes 0.4 0.2 1.3 0.7
25 Franchise Fees and Property Taxes 16.3 14.9 47.1 44.5
26 Total Operating Expenses by Function 131.2 122.3 382.4 361.0
27 In-City Water Share - % 82.4% 81.4% 82.3% 81.9%
28 In-City Water Share - $ 108.1 99.5 314.8 295.5
Overall, total operating expenses for 2019 were $8.9 million lower than the PBR forecast, and $21.4
million lower over the 2017-2019 PRB period. Key factors contributing to this difference include:
July 15, 2020 12EPCOR Water Services Inc. PBR 2017-2021
Power and Other Utilities – $4.1 million less than forecast in 2019 ($8.6 million less for 2017-2019)
due to lower than forecast power prices ($2.2 million in 2019 and $4.8 million for 2017-2019) and
$1.9 million in savings associated with the green energy premium ($3.8 million for 2017-2019) that
was included in the PBR forecast. The PBR forecast included annual renewable (green energy) power
purchases of $1.9 million annually, starting in 2018. Rather than purchasing locally produced
renewable energy, EWSI plans to construct a solar farm on land adjacent to the E.L. Smith water
treatment plant.
Chemicals – $4.3 million greater than forecast in 2019 ($6.1 million greater than forecast for 2017-
2019). In 2019, higher than average precipitation (surface run off) resulted in unusually high colour in
the river over the summer months requiring the use of more chemicals (alum and caustic soda) in the
water treatment process. The unusually high colour continued into the fall causing a significant delay
in the conversion to direct filtration and extending the use of chemicals in the water treatment process.
Higher than forecast costs for the 2017-2019 PBR period are also attributable to unexpected changes
in river water quality, including early spring run offs and high colour in the fall.
Water Treatment Plants – $0.7 million less than forecast in 2019 ($2.2 million less than forecast for
2017-2019). Lower than forecast costs for 2017-2019 are attributable to several factors, including: a
higher than forecast proportion of internal labour working on capital projects, which increased capital
recoveries by $2.0 million, reductions in fringe benefit costs, primarily due to lower pension
contribution rates, which provided savings of $0.6 million; capitalization of filter media costs, which
had previously been considered an operating expense of $0.2 million; which is partially offset by
higher salary costs of $1.0 million attributable to an increase in head count. The remainder of the
actual to forecast difference consists of numerous small items, none of which are individually
significant.
Water Distribution and Transmission – $0.9 million greater than forecast in 2019 ($3.6 million
greater for 2017-2019). Seasonal freeze-thaw cycles in 2017 and 2018 combined with a colder than
average winter in 2019 resulted in higher than normal volumes of emergency repairs (main breaks
and frozen services) over the 2017 to 2019 period, resulting in increased overtime costs of $0.7
million ($2.1 million for 2017-2019), higher contractor costs of $1.8 million ($3.5 million for 2017-
2019), and additional material costs of $0.6 million ($1.7 million for 2017-2019). These increases
were partially offset by reductions in fringe benefit costs of $1.0 million in 2019 ($2.5 million for 2017-
2019), and an increase in the recovery of fleet costs attributable to an increase in capital work of $0.6
million in 2019 ($0.7 million for 2017-2019) The remainder of the actual to forecast difference consists
of numerous small items, none of which are individually significant.
Operational Support Services – $0.7 million less than forecast in 2019 ($1.4 million less for 2017-
2019). The 2017-2019 variance in this function is primarily attributable to lower staff costs of $0.9
million related to vacant positions within the Project and Asset Management functions and a transfer
of the Knowledge Management function to Corporate Shared Service in 2019, combined with lower
than forecast legal costs of $0.4 million, as less external legal support was required.
Billing, Meters, and Customer Service – $1.7 million less than forecast in 2019 ($4.3 million less
for 2017-2019). Meter reading process improvements provided cost savings in staff costs of $1.0
million ($2.6 million for 2017-2019), $0.3 million in vehicle expenses ($0.7 million for 2017-2019), and
$0.6 million in lower billing and customer service charges from EPCOR Energy Alberta LP ($0.7
13 July 15, 2020PBR 2012-2016 EPCOR Water Services Inc.
million for 2017-2019). The remainder of the actual to forecast difference consists of numerous small
items, none of which are individually significant.
EWSI Shared Services – $1.4 million less than forecast in 2019 ($2.7 million less than forecast for
2017-2019). The 2019 favorable variance in this category reflects EWSI’s continuing efforts to
manage shared services costs, with savings of $0.3 million arising from delays in filling vacant
positions in Regulatory Services, a $0.5 million decrease in technical training charges from EPCOR
Distribution and Transmission Inc. (training functions consolidated to Corporate Shared Service in
2019), and $0.4 million of recoveries from Drainage, as the organization is gradually consolidating
functions from each of EWSI’s business units into a single EWSI’s shared services area.
Corporate Shared Services – $3.5 million less than forecast in 2019 ($8.9 million less than forecast
for 2017-2019). These differences reflect both the reduction in corporate shared services cost
allocations resulting from the transfer of Drainage from the City of Edmonton to EPCOR, which are
fully offset by the non-routine adjustment to rates described in Section 2.1.1, as well as cost savings
in EPCOR Utilities Inc.’s corporate functions.
Franchise Fees and Property Taxes – $1.4 million less than forecast in 2019 ($2.6 million less than
forecast for 2017-2019). Lower than forecast revenue resulted in a $1.2 million reduction in franchise
fees in 2019 ($2.0 million for 2017-2019). Lower than forecast property taxes relate to the deferral of
the Distribution and Transmission facility which had been expected to increase Water Services
property taxes by $0.2 million annually commencing in 2017.
Variances in other operating expense functions and sub-functions are not significant, either individually
or in aggregate.
In 2019, In-City Water’s share of operating expenses was $99.5 million (81.4%), compared to $108.1
million (82.4%) in the PBR forecast. This result reflects both lower total operating expenses for EWSI’s
total water system and a 1.0% decrease in In-City Water’s share of operating expenses determined
through the cost of service model.
2.3.3 Operating Expenses by Cost Category
Table 2.3.3 below shows operating expenses by cost category for Water Operations, Billing Meters and
Customer Service, and EWSI Shared Services, where cost categories differ from the sub-functions in
Section 2.3.2.
July 15, 2020 14EPCOR Water Services Inc. PBR 2017-2021
Table 2.3.3
Operating Expenses by Cost Category
($ millions)
A B C D
2019 2017-2019
Cost Category PBR PBR
Forecast Actual Forecast Actual
1 Water Operations
2 Staff Costs and Employee Benefits 42.2 40.6 124.2 120.3
3 Contractors and Consultants 8.0 9.3 22.5 25.8
4 Vehicles 1.5 1.1 4.5 3.6
5 Materials and Supplies 3.2 3.9 9.3 11.1
6 Other 4.5 4.3 13.1 13.2
6 Capitalized Overhead Costs (7.4) (8.3) (21.8) (22.9)
7 Water Operations 52.0 50.9 151.9 151.2
8 Billing, Meters and Customer Service
9 CUS Charges 8.4 7.8 24.3 23.6
10 Staff Costs and Employee Benefits 7.0 6.0 20.4 17.9
11 Contractors and Consultants 0.5 0.4 1.6 1.2
12 Vehicles 0.3 0.1 0.9 0.6
13 Other 0.6 0.7 1.6 1.4
14 Meter Reading Services (Recoveries) (4.8) (4.6) (13.1) (13.1)
15 Billing, Meters and Customer Service 12.1 10.4 35.7 31.4
16 EWSI Shared Services
17 EWSI Shared Services Allocation 10.2 9.4 30.1 28.1
18 Staff Costs and Employee Benefits 3.3 2.8 9.6 9.2
19 Contractors and Consultants 0.2 0.1 0.6 0.4
20 Other (0.3) (0.3) (0.8) (0.8)
21 EWSI Shared Services 13.4 12.0 39.6 36.9
The information presented in this table supports the explanations of differences between 2019 actual and
forecast expenses provided in Section 2.3.2. Accordingly, no additional explanations are considered
necessary.
2.3.4 Depreciation and Amortization
EWSI total system depreciation expense and amortization of contributed assets for 2019 are shown in
Table 2.3.4 below:
Table 2.3.4
Depreciation and Amortization
($ millions)
A B C D
2019 2017-2019
Depreciation and Amortization PBR PBR
Forecast Actual Forecast Actual
1 Gross depreciation expense 45.8 47.2 132.2 134.2
2 Amortization of contributions (9.9) (11.0) (29.4) (31.2)
3 Depreciation, net 35.9 36.2 102.8 103.0
4 In-City Water Share - % 78.9% 78.4% 78.9% 78.9%
5 In-City Water Share - $ 28.4 28.4 81.1 81.3
15 July 15, 2020PBR 2012-2016 EPCOR Water Services Inc.
Depreciation expense and amortization of contributions are both slightly higher than forecast reflecting
higher than forecast levels of developer-funded assets, explained in section 2.3.5 below. These impacts
are offsetting, so actual depreciation expense, net of amortization, is within $0.2 million of forecast.
In-City Water’s share of 2019 depreciation expense is 0.5% lower than forecast, 0.7% of this difference
is attributable to higher than forecast assets additions for fire protection related assets (hydrants). The
remaining 0.2% difference is consistent with actual to forecast differences in the base and max day
peaking factors used to allocate depreciation expense between In-City customer classes versus that
charged to the RWCG.
2.3.5 Rate Base
In 2019, EWSI’s total water system rate base, shown in Table 2.3.5 below, was $12.8 million more than
forecast, with the higher than forecast gross rate base offset by higher than forecast contributions.
Table 2.3.5
Mid-Year Rate Base
($ millions)
A B
2019
Components of Mid-Year Rate Base PBR
Forecast Actual
1 Plant in Service
2 Balance, beginning of year 2,346.9 2,413.1
3 Additions - EPCOR-funded 85.5 105.4
4 Additions - Developer-funded 6.9 35.8
5 Retirements and adjustments - (9.0)
6 Balance, end of year 2,439.3 2,545.4
7 Mid-Year Plant in service 2,393.1 2,479.3
8 Accumulated Depreciation
9 Balance, beginning of year 605.1 595.5
10 Depreciation expense 45.8 47.2
11 Retirements and adjustments - (8.9)
12 Balance, end of year 650.9 633.8
13 Mid-Year Accumulated Depreciation 628.0 614.7
14 Other Rate Base Items
15 Working Capital 22.3 21.0
16 Materials and Supplies 2.9 3.6
17 Gross Mid-Year Rate Base 1,790.3 1,889.1
19 Contributions
20 Balance, beginning of year 687.1 760.2
21 Contributions in aid of construction 6.9 35.8
23 Balance, end of year 693.9 795.9
24 Mid-Year Contributions 690.5 778.0
25 Accumulated Amortization
26 Balance, beginning of year 168.1 169.1
27 Amortization of contributions 9.9 11.0
28 Balance, end of year 178.0 180.1
29 Mid-Year Accumulated Amortization 173.1 174.6
30 Mid-Year Contributions 517.4 603.5
31 Net Mid-Year Rate Base 1,272.9 1,285.7
July 15, 2020 16EPCOR Water Services Inc. PBR 2017-2021
The gross rate base reflects significantly higher than forecast levels of developer-funded assets over the
2016 to 2019 period. Developers are responsible for construction of distribution infrastructure in new
subdivisions. When these assets are placed into service, ownership of the assets is transferred to EWSI,
where the assets, together with offsetting contributions in aid of construction, are added to the rate base.
In 2019, the net mid-year rate base is $12.8 million or 1.0% more than forecast. This increase in rate
base is driven by higher than forecast capital expenditures as discussed in section 2.4.1.
2.3.6 Return on Rate Base
In 2019, In-City Water’s return on equity was $5.6 million (1.6%) less than forecast and $6.9 million (0.6%)
less for 2017-2019. In 2019, this decrease was attributable to lower than forecast net income, reflecting
a significant decline in revenue which is partially offset by EWSI’s actions to control operating costs.
Table 2.3.6-1
Return on In-City Water Share of Mid-Year Rate Base
($ millions)
A B C D
2019 2017-2019
Return on Rate Base PBR PBR
Forecast Actual Forecast Actual
1 Net Mid-Year Rate Base 1,272.9 1,285.7
2 In-City Water Share - % 78.8% 78.0%
3 In-City Water Share - $ 1,003.0 1,002.8
4 Deemed Capital Structure
5 Debt 60.00% 60.00%
6 Equity 40.00% 40.00%
7 Total 100.00% 100.00%
8 Cost Rates
9 Debt 4.88% 4.83% 4.88% 4.89%
10 Equity 10.18% 8.56% 10.18% 9.61%
11 Weighted Average Cost of Capital (WACC) 7.00% 6.32% 7.00% 6.77%
12 Return on Rate Base
13 Debt 29.4 29.0 84.3 84.2
14 Equity 40.8 34.3 117.1 110.2
15 Total Return on In-City Water Rate Base 70.2 63.3 201.4 194.4
In-City Water’s share of the total system net mid-year rate base is 0.8% less than forecast, of this
difference 1.1% is attributable to higher than forecast asset additions for fire protection related assets
(hydrants). The remaining 0.3% difference is consistent with the change in In-City Water’s demands on
water system relative to that of Regional Customers. When combined with a total system rate base the
In-City Water net mid-year rate base is within 0.02% of the forecast amount.
Returns on rate base are calculated separately for the debt-financed and equity-financed portions of In-
City Water’s net rate base. The rate of return on debt is equal to the embedded cost of debt for EWSI’s
total water system, as calculated in Table 2.3.6-2 below:
17 July 15, 2020You can also read