Adaptation of the Teacher Effi cacy Scale to Measure Effective Teachers' Educational Practices Through Students' Ratings: A Multilevel Approach
←
→
Page content transcription
If your browser does not render page correctly, please read the page content below
ISSN 0214 - 9915 CODEN PSOTEG
                                                                 Psicothema 2021, Vol. 33, No. 3, 509-517
                                                                                                                                 Copyright © 2021 Psicothema
                                                                     doi: 10.7334/psicothema2020.262                                     www.psicothema.com

Adaptation of the Teacher Efficacy Scale to Measure Effective Teachers’
          Educational Practices Through Students’ Ratings:
                       A Multilevel Approach
                                  María-José Lera1, José-M. León-Pérez1, and Paula Ruiz-Zorrilla2
                                        1
                                            Universidad de Sevilla, and 2 Universidad Complutense de Madrid

 Abstract                                                                          Resumen
Background: There is an increasing evidence of the role that teachers’           Escala de Autoeficacia del Profesorado según las Percepciones del
educational practices have for students’ school achievement and their well-      Alumnado: Un Enfoque Multinivel. Antecedentes: existen evidencias del
being. However, there is a lack of valid measures in Spanish to address          papel que las prácticas educativas de los docentes tienen en el rendimiento
effective educational practices based on students’ perceptions. In response,     escolar y el bienestar de los estudiantes. Sin embargo, faltan medidas
this study aims to provide a valid, reliable scale for measuring educational     válidas en español que permitan estudiar las prácticas educativas efectivas
practices in school settings: the Students’ ratings of Teachers’ Educational     a partir de las percepciones de los estudiantes. Por ello, este estudio tiene
Practices Scale (STEPS). Methods: We analyzed the scale’s internal               como objetivo proporcionar una escala válida y fiable para medir las
consistency and reliability, factor solution and invariance, and criterion       prácticas educativas eficaces en entornos escolares (STEPS). Método:
validity, by using a multilevel approach in a sample of 2,242 students           analizamos, en una muestra de 2.242 estudiantes anidados en 104 aulas
nested in 104 classrooms from 22 Spanish schools. Results: Indicated             de 22 escuelas españolas, la consistencia y fiabilidad interna de la escala,
that the scale exhibited good reliability according to the omega coefficient     la solución e invariancia de factores y la validez de criterio mediante el
(within =.86 and between level =.98). The multilevel confirmatory factor         uso de un enfoque multinivel. Resultados: los resultados indicaron que la
analysis (MCFA) revealed a hierarchical factor solution: classroom               escala exhibió una buena fiabilidad de acuerdo con el coeficiente omega
management, instructional strategies, and students’ engagement as first-         (intra = .86, e inter = .98); el análisis factorial confirmatorio multinivel
order factors, and a general second-order factor labeled as effective            (MCFA) reveló una estructura jerárquica: gestión del aula, estrategias de
educational practices. The scale demonstrated configural invariance              instrucción y participación de los estudiantes, como factores de primer
by teaching level, sex, and region. Effective educational practices were         orden; y un factor general de segundo orden etiquetado como prácticas
associated with student self-esteem at the individual level. Conclusions:        educativas efectivas. Además, las prácticas educativas efectivas se
This study offers a reliable, valid instrument, STEPS, for measuring             asociaron con mejor autoestima de los estudiantes. Conclusiones: este
effective educational practices.                                                 estudio ofrece un instrumento fiable y válido, STEPS, para medir prácticas
Keywords: Educational practices; teaching evaluation; multilevel                 educativas efectivas.
confirmatory factor analysis; self-esteem.                                       Palabras clave: prácticas educativas; evaluación docente; análisis factorial
                                                                                 confirmatorio multinivel; autoestima.

    During the last three decades researchers have focused on                    practices affecting students’ outcomes. His results confirmed the
teachers’ behaviours as predictors of student achievement,                       effectiveness of some educational practices, such as providing
trying to establish which specific educational practices are                     feedback, managing classroom behaviour, teacher clarity, teacher–
effective. Therefore, nowadays effective educational practices                   student relationships, cooperative learning, direct instruction,
refer to such practices that teachers implement in the classroom                 mastery learning, classroom management, peer tutoring, worked
that have consistently been connected to students’ outcomes                      examples, and concept mapping. Indeed, he concluded that teachers’
in many previous studies (for a review, see Muijs et al., 2014).                 educational practices are the most relevant factor in determining
In this regard, John Hattie (2009) clearly synthesized over 800                  students’ outcomes, over other factors grouped into the categories:
different meta-analyses and provided an overview of educational                  ‘student’, ‘home’, ‘school’, ‘curricula’, and ‘teaching approaches’
                                                                                 (Hattie, 2009).
                                                                                     More recently, a meta-analysis of 167 studies revealed seven
Received: July 20, 2020 • Accepted: March 1, 2021                                key dimensions associated with three domains that predict
Corresponding author: María-José Lera                                            students’ school achievements (Kyriakides et al., 2013): classroom
Department of Developmental and Educational Psychology
                                                                                 management (class learning environment, time management and
Universidad de Sevilla
41018 Sevilla (Spain)                                                            assessment); instruction (structuring, modelling, application);
e-mail: lera@us.es                                                               and self-regulation (i.e., teachers’ attempt to encourage self-

                                                                                                                                                        509
María-José Lera, José-M. León-Pérez, and Paula Ruiz-Zorrilla
regulation and help students understand the reasons for which measures that incorporate students’ perceptions and their multilevel
they should be engaged in certain learning tasks). These nature (see Woitschach et al., 2019).
dimensions are in line with the findings of the Tripod Project, From a theoretical perspective, we selected the TES scale
which included five different observational instruments, plus the because it follows a similar three-dimensional model of effective
assessment provided by students and teacher rates (Kane et al., teaching practices but from the teachers’ perspective or teachers’
2014). Their results indicated the existence of two clear domains: self-efficacy. In doing so, we connect research on teachers’ self-
classroom management, and instruction; together with a third efficacy -or “self-referent judgments of capability to organize and
unprecise domain that comprised emotional climate and students’ execute actions required to successfully perform teaching tasks and
engagement. Also, the observational instrument TEACH (Molina positively impact student learning” (Perera et al., 2019, p. 187)-
et al., 2018) has been designed to help low- and middle-income and research on effective educational practices (i.e., assessing
countries improve teaching quality in three domains: classroom educational practices linked with students’ achievements), which
culture, instruction, and socioemotional skills. may open new venues for further research.
Based on the existing evidence, we define effective educational From a methodological perspective, as the data from research
practices as the actions that teachers take to promote a supportive conducted in educational contexts is usually hierarchically
teaching-learning environment that facilitates both students’ structured (the responses are from students nested within a
achievements and psychological development (e.g., increased self- variety of levels, such as classrooms, teaching levels or schools),
esteem: Watkins, 2000), which can be divided into three domains: multilevel factorial analysis techniques may help to shed some
(1) keeping an adequate classroom management, which allows light on the factor structure at the various levels of the data (see
creating an environment that facilitates both socioemotional and Fernández-Alonso & Muñiz, 2019). In our case, students are likely
academic student’s progress (Rolland, 2012; Vandenbroucke et to live a similar experience within their classroom (i.e., at least part
al., 2018); (2) providing high quality instruction that encourage of the variability of the measurement depends on the fact that the
students’ critical thinking and analysis (Kraft et al., 2018; respondents pertain to groups or classrooms exposed to the same
Kyriakides et al., 2013; Stockard et al., 2018); and (3) establishing teacher). Consequently, we analyse the psychometric properties of
supportive teacher-students relationships that encourage students’ the STEPS by considering: (a) its internal consistency and reliability
to value learning and promote their engagement (Korpershoek et (Cronbach’s alpha and omega coefficient); (b) its multilevel factor
al., 2016). solution through confirmatory factor analysis (MCFA); (c) its
The assessment of such educational practices and its domains invariance configuration across contextual factors such as region,
has traditionally been carried out through three sources of sex, and teaching level; and (d) its criterion validity as a predictor
information: teachers’ self-assessments, classroom observation, of students’ self-esteem, which is correlated with higher quality
and students’ perceptions. Each method has its own pros and cons learning process (for a meta-analysis, see Watkins, 2000).
in terms of reliability, cost-efficiency, and quality of the feedback In sum, this study contributes to the existing literature by
to provide ongoing teachers’ coaching and training. Therefore, adapting a widely used valid and reliable measure that is rooted in
recent calls in the literature advocate for incorporating different a theoretical framework, which allows cross-cultural comparisons
sources of information to improve the predictive power to measure and reduces students’ bias when rating teachers’ effective teaching
effective educational practices (see findings from the MET project: practices. Moreover, when offering the psychometric properties of
Kane et al., 2014). the scale, we overcome previous limitations in the literature and
However, although there are several reliable instruments based apply a multilevel approach that considers that teachers’ teaching
on previous evidence to both obtain teachers’ self-assessments (i.e., practices affect a certain group of students that are nested in
self-reported scales in which teachers rate their own educational classrooms, and therefore students’ ratings can be aggregated.
practices), and classroom observation by experts such as inspectors
and researchers (e.g., ICALT: van de Grift, 2007; CLASS: Pianta Method
et al., 2008; TEACH: Molina et al., 2018); there is a lack of valid
measures based on students’ ratings. Moreover, student ratings have Participants
not been always considered as valid, either because of possible bias
or the lack of a theoretical model that guided measuring educational Our sample was composed of 2,242 students (48.4% girls) with
practices from students’ perceptions (van der Lans et al., 2019; van a mean age of 12.76 years (SD = 1.95, range between 9 and 20
der Scheer et al., 2019). Indeed, previous studies have shown both a years old) nested into 104 classrooms from 22 schools in Basque
low correlation between teachers and students’ ratings when similar Country and Andalusia (Spain). Regarding the teaching level,
questionnaires have been administered to them, and a substantial 28.1% were enrolled in upper levels of primary school (8-12
variation from student-to-student rates (Klassen & Tze, 2014; years), 68.9% in secondary school (12-16 years), and 3% in high
Wagner et al., 2016), which makes difficult integrating different school (16-18 years).
sources of information to gauge and improve educational practices.
In response, this study aimed to examine the psychometric Instruments
properties of the teacher efficacy scale (TES: Tschannen-Moran
& Hoy, 2001) when students’ rates are used both at the individual Sociodemographic factors. Participants’ age (years old), sex
(student level) and the group level (classroom-teacher level) to (girls vs. boys), teaching level (primary, secondary, and high
assess effective educational practices. This new version of the school), and region (Basque Country vs. Andalusia) were controlled
TES scale is labelled as the Scale of Teachers’ Effective Practices or included to check for measurement invariance.
rated by Students (STEPS), which tries to fill a gap in the effective Effective educational practices. There is a teacher responsible
educational practices literature concerning the lack of available for each classroom, whose educational practices were rated by
510Adaptation of the Teacher Efficacy Scale to Measure Effective Teachers’ Educational Practices Through Students’ Ratings: A Multilevel Approach
students. Accordingly, we adapted the 24 items of the Ohio State the North that represents a medium-high socioeconomic level;
Teacher Efficacy Scale (TES: Tschannen-Moran & Hoy, 2001) in and Algeciras in the South, an area representing low-medium
order to be answered by students. Students rated in a Likert scale socioeconomic level. In both areas a school counselor facilitated
ranging from 1 (“nothing”) to 5 (“absolutely”) the degree in which approaching the schools (i.e., convenience sampling). In Gipuzkoa
their teachers use different educational practices according to 40 classrooms belonging to 13 schools agreed to participate in the
three domains: classroom management (e.g., “Does your teacher project (as intervention group). Then, we invited other schools
get you and your classmates to follow classroom rules?” instead (as comparison group) that were randomly selected for being in
of the original “How much can you do to get children to follow the same area than those who agreed to participate. Therefore, 20
classroom rules”), instructional strategies (e.g., “Does your teacher classrooms from 6 schools were added to our initial sample as they
craft good questions in class?” instead of the original item “To decided to participate in our project. All the schools were funded
what extent can you craft good questions for your students?”), and by public funds, although half of them were managed by parents’
students’ engagement (e.g., “Does your teacher help you and your cooperatives (30 classrooms in the cooperative schools), while the
classmates value learning?” instead of the original “How much can other half were run by the regional authorities (30 classrooms in the
you do to help your students value learning”). See Table 1. state schools). Finally, in Algeciras, a total of 53 classrooms from 4
Students’ self-esteem. This variable was measured with the state schools voluntarily decided to take part in the project.
Rosenberg Self-Esteem Scale (RSES: Rosenberg, 1965) in its After signing an agreement with the School Council,
Spanish version (Martín-Albo et al., 2007). The scale consists of headmasters informed their teachers verbally about the study. Then,
10 items following a Likert response scale ranging from 1 (strongly information sheets explaining the purpose of the project were given
disagree) to 5 (strongly agree). After recoding negative items, the through teachers to the students and their parents, who gave their
scale provides a total score ranging from 10 to 40 points, where written consent to participate in the study. Some research assistants
higher scores indicate a higher general self-esteem. under the supervision of the first author collected the data in each
classroom during the school schedule as part of routine schoolwork.
Procedure Participation was voluntary and confidentiality was guaranteed.
The study followed the American Psychological Association Data analysis
(APA) Ethical Principles and Code of Conduct. This study is part
of a larger project aimed at improving educational practices. We First, descriptive statistics, sample adequacy and multivariate
approached schools located in two regions of Spain that represent normality tests were conducted to ensure that our data met the
two socio-economic extremes within this country: Gipuzkoa in needs for the analyses. Second, we performed several multilevel
Table 1
Scale items adapted from Tschannen-Moran and Woolfolk-Hoy (2001)
Item no. Item content
Please indicate your opinion about each of the statements below… [Por favor expresa tu opinión sobre las siguientes frases. Indica si tu profesor…]
1 How much can you do to get through to the most difficult students? [Te explica de manera que lo entiendes]
2 How much can you do to help your students think critically? [Te ayuda a pensar de manera crítica]
3 How much can you do to control disruptive behavior in the classroom? [Te ayuda a controlar el mal comportamiento (si lo tienes)]
4 How much can you do to motivate students who show low interest in schoolwork? [Te motiva cuando tienes poco interés por las tareas]
5 To what extent can you make your expectations clear about student behavior? [Te dice cómo te debes comportar]
6 How much can you do to get students believe they can do well in schoolwork? [Te ayuda a creer que puedes hacer bien las tareas]
7 How well can you respond to difficult questions from your students? [Te responde adecuadamente a las preguntas difíciles que haces]
8 How well can you establish routines to keep activities running smoothly? [Te ayuda a tener rutinas para hacer mejor tu trabajo]
9 How much can you do to help your students value learning? [Te ayuda a valorar el aprendizaje]
10 To what extent can you gauge student comprehension of what you have taught? [Sabe medir lo que has aprendido]
11 To what extent can you craft good questions for your students? [Te realiza buenas preguntas]
12 How much can you do to foster student creativity? [Fomenta tu creatividad]
13 How much can you do to get children to follow classroom rules? [Te ayuda a que sigas las normas del aula]
14 How much can you do to improve the understanding of a student who is failing? [Te ayuda a mejorar tu comprensión cuando suspendes]
15 How much can you do to calm a student who is disruptive or noisy? [Te calma cuando tienes un mal comportamiento]
16 How well can you establish a classroom management system with each group of students? [Trabajáis por grupos]
17 How much can you do to adjust your lessons to the proper level for individual students? [Adapta las lecciones a un nivel adecuado para ti]
18 To what extent can you use a variety of assessment strategies? [Te evalúa de diferentes maneras]
19 How well can you keep a few problem students from ruining an entire lesson? [Puede controlar a los estudiantes más problemáticos]
20 To what extent can you provide an alternative explanation or example when students are confused? [Te proporciona una explicación o un ejemplo alternativo cuando no entiendes algo]
21 How well can you respond to defiant students? [Responde adecuadamente a los/as alumnos/as difíciles]
22 How much can you assist families in helping their children do well in school? [Puede ayudar a tu familia para que tengas buenos resultados en el colegio]
23 How well can you implement alternative strategies in your classroom? [Te deja elegir entre distintas maneras de hacer las tareas]
24 How well can you provide appropriate challenges for very capable students? [Te proporciona retos adecuados para motivarte más]
511María-José Lera, José-M. León-Pérez, and Paula Ruiz-Zorrilla
confirmatory factor analyses (MCFA), in order to test the sphericity. Univariate normality (Komogorov-Sminrov test) was
dimensionality within the STEPS scale. For this purpose, several not accomplished for neither of the items, nor the overall scale
common exploratory factor analyses (EFA) and confirmatory score. Multivariate normality was checked through Mardia test,
factor analyses (CFA) were made to compare differences on the showing that the data also violates this assumption (p < .01 for both
measure structure when we consider the nested (hierarchical) data multivariate skewness and kurtosis). Finally, sample adequacy and
or not. According to the recommendations of Hu and Betler (1999), sphericity were tested with the KMO test (Kaiser-Meyer-Olkin
model fit was assessed through: (a) the chi squared coefficient (χ²/ values ranged between .95 and .98) and Bartlett’s test of sphericity
df) whose optimal values are below 3; (b) comparative fit index (p < .01), showing that our data fitted sample assumptions (Cerny &
(CFI) and the Tucker-Lewis fit index (TLI), whose recommended Kaiser, 1977). Then, according to the recommendations of Muthén
values are above .95 (indicating a good fit); (c) root mean (1994), we performed several ordinary exploratory factor analyses
square error of approximation (RMSEA), with values below .01 and confirmatory factor analyses, to compare results from data
indicating excellent fit, below .05 indicating good fit and below treated as independent with posterior multilevel analysis (which
.08 indicating mediocre fit; and (d) standardized root mean square assumes non-independency among data). For this preliminary step,
residual (SRMR), which is better as closer to 0 (perfect fit).Third, the sample was randomly split in two halves (N = 1,121 each).
and invariance analysis was performed, comparing three grouping Regarding missing data, we used maximum likelihood (ML)
demographic variables (teaching level, sex, and region). Fourth, estimation for one-level models, and the expectation-maximization
a multilevel linear regression was performed to assess whether (EM) algorithm for multilevel models (see Fernández-Alonso et
the measure was related to one critical output (criterion validity), al., 2012).
a self-esteem scale. All analyses were performed with the free- First, a parallel analysis revealed the presence of seven
access statistical software R Studio version 1.2.1335 and SPSS underlying factors in our data, with eigenvalues of 7.84, 0.45,
version 25. 0.38, 0.27, 0.25, 0.19 and 0.15, respectively. An ordinary EFA with
Unweighted Least Squares (ULS) estimation method was then
Results performed. Table 2 also reports ICC values by item. For values
closer to one, ICC indicates that there is a significant amount of
Descriptive statistics and reliability variance that can be due to level 2 (group) properties, and thus,
that multilevel CFA would be an accurate analytic choice (James,
Table 2 shows descriptive statistics for our study variables at 1982).
the individual level. As sociodemographic factors, we included Second, five competing models were estimated through ordinary
students’ sex, age, and educational stages. Reliability was assessed CFA (unidimensional, uncorrelated three-factor, correlated three-
through the multilevel omega reliability index (Green & Yang, factor, hierarchical and bifactor models). Table 4 shows the fit
2015; Peters, 2014), which showed acceptable values for the report for those models (five top rows). Overall, the bifactor model
subscales’ within-group component (ωw = .58 - .76), good values was the one which achieved better fit values (χ²/df = 1.95, CFI
for the between-group component (ωb = .89 - .98), and good values = .97, TLI = .96, RMSEA = .03, SRMR = .02). However, when
for the overall STEPS scale (ωw = .86; ωb = .98). Table 3 shows focusing on standard errors, z values and significance of loadings,
item’s descriptive (mean, standard deviation, range, skewness and this bifactor model was rejected due to some abnormal parameter
kurtosis) and reliability values. Item 24 seem to be the one that estimation (data available upon request to researchers). Then, we
performs better in terms of reliability. turned to both the 3-correlated factors and the hierarchical 1-3
models (χ²/df = 2.23, CFI = .95, TLI = .95, RMSEA = .04, SRMR
Preliminary steps = .03). As both models are similarly parsimonious, we decided to
retain the hierarchical 1-3 model as it captures better the concept
In order to ensure that the data was suitable for factorial of educational practices, which is composed by 3 correlated factors
analyses, we checked for normality, sample adequacy, and (see Path diagram in Figure 1).
Table 2
Mean, standard deviation, skewness, kurtosis, reliability, and bivariate correlations among study variables
Variable M (SD) ωw ωw ICC¹ ICC² Skew Kurt 1 2 3 4 5 6 7 8
1- Sex 1.52 (0.50) – – – – -0.07 -2 –
2- Age 12.76 (1.95) – – – – 0.05 -0.29 -.01 –
3- Educational stage 1.81 (0.72) – – – – 2.25 9.19 -.00 .71** –
4- Region 1.40 (0.50) – – – – 0.09 -1.99 -.00 -.52** -.53** –
5- STEPS 3.90 (0.81) .86 .98 .31 .90 -0.81 0.71 -.04 -.24** -.18** .19** –
6- Classroom Management 3.91 (0.88) .58 .89 .22 .85 0.54 7.33 -.04 -.23** -.19** .21** .87** –
7- Instructional Strategies 3.87 (0.88) .73 .98 .27 .88 -0.53 1.65 -.03 -.22** -.14** .18** .90** .67** –
8- Student Engagement 3.91 (0.91) .76 .98 .27 .88 -0.34 3.78 -.04 -.20** -.14** .14** .92** .70** .77** –
9- Self-esteem 3.91 (0.71) .03 .79 .07 .58 -0.20 3.50 .03 -.13** -.10** .07** .20** .16** .20** .18**
* pAdaptation of the Teacher Efficacy Scale to Measure Effective Teachers’ Educational Practices Through Students’ Ratings: A Multilevel Approach
Table 3
Item descriptive statistics and reliability indicators
Item Mean (SD) Skew Kurt M Var Corr1 Corr2 α ICC
1 4.25 (1.38) 12.82 406.07 89.76 363.60 .42 .22 .899 .23
2 3.74 (1.28) -.73 -.46 90.28 361.12 .52 .30 .897 .41
3 3.83 (1.87) 11.08 323.25 90.19 357.05 .39 .18 .901 .76
4 3.78 (1.62) 4.13 73.77 90.23 353.20 .53 .33 .897 -.68
5 4.02 (2.15) 12.88 294.77 90.00 368.21 .19 .06 .909 .68
6 4.19 (1.12) 15.43 510.32 89.83 357.00 .70 .54 .895 .75
7 4.24 (1.44) 13.66 342.09 89.78 361.457 .45 .24 .899 -.38
8 3.87 (1.74) 14.20 450.18 90.15 352.77 .49 .26 .898 .97
9 4.02 (1.66) 16.85 562.651 89.99 355.51 .48 .25 .898 .86
10 4.04 (1.07) -1.02 0.42 89.97 359.45 .67 .51 .895 .96
11 4.03 (1.46) 10.92 326.68 89.98 358.26 .50 .28 .898 .91
12 3.73 (1.22) -.72 -.33 90.28 355.12 .68 .51 .895 .98
13 4.21 (1.05) -1.27 .92 89.81 363.01 .60 .39 .897 .60
14 3.99 (1.46) 3.33 82.67 90.02 352.52 .61 .40 .895 .98
15 3.89 (2.54) 13.16 267.13 90.12 351.51 .32 .15 .908 .95
16 3.60 (1.43) -.64 -.91 90.41 363.54 .41 .24 .900 .99
17 3.91 (1.21) 3.89 95.22 90.11 358.27 .62 .41 .896 .97
18 3.59 (1.43) .34 10.31 90.42 360.09 .48 .29 .898 .97
19 3.88 (1.24) 8.87 249.54 90.14 358.17 .60 .40 .896 .97
20 4.32 (1.03) 5.45 153.54 89.70 362.21 .63 .46 .896 .89
21 4.19 (1.07) -1.33 1.14 89.82 360.55 .65 .49 .896 .90
22 3.74 (1.32) -.73 -.59 90.27 353.44 .66 .47 .895 .99
23 3.36 (1.41) -.34 -1.11 90.65 354.07 .60 .46 .896 .98
24 3.60 (1.38) -.57 -.90 90.41 34.58 .70 .57 .893 .98
N = 2242; α (overall scale) = .90
Skew = Item Skewness; Kurt = Item Kurtosis; M = Scale Mean if Item Deleted; Var = Scale Variance if Item Deleted; Corr1= Corrected Item-total Correlation; Corr2= Squared Multiple
Correlation; α = Scale Cronbach Alpha if Item Deleted
Table 4
Fitting values for the competing CFA models
Model χ² df χ²/df CFI TLI RMSEA SRMR
1 factor (a)¹ 567.028 252 2.25 .95 .94 .04 .03
3 correlated factors (a)¹ 556.228 249 2.23 .95 .95 .04 .03
3 uncorrelated factors (a)¹ 2059.213 252 8.17 .65 .62 .10 .25
Hierarchical 1-3 (a)¹ 556.228 249 2.23 .95 .95 .04 .03
Bifactor (a)¹ 433.226 222 1.95 .97 .96 .03 .02
1 factor (b)² 1340.273 504 2.65 .93 .92 .03 .03 (w) .09 (b)
3 correlated factors (b)² 1291.211 498 2.59 .93 .92 .03 .03 (w) .09 (b)
3 uncorrelated factors (b)² 4333.579 504 8.59 .66 .632 .07 .21 (w) .58 (b)
Hierarchical 1-3 (b)² 1291.211 498 2.59 .93 .92 .03 .03 (w) .09 (b)
Bifactor (b)² 924.466 444 2.08 .96 .95 .03 .02 (w) .07 (b)
¹N = 1121; ²N = 2242
(a) = from common single-level CFA; (b) = from multilevel CFA
(w) = within groups; (b) = between groups
Multilevel confirmatory factor analysis information on the covariance matrix for parameter estimation,
the multilevel approach adds between-group level information.
Due to the bias implicit in previous analyses (as they do not The resulting model follows a two-level estimation method, and
consider the hierarchical nature of data), we replicated all models thus, parameters are doubly computed for each level. As subscales’
following a multilevel CFA approach. This means that while ICC(1) estimation (Table 2) showed, this technique was justified
ordinary CFA just takes into consideration within-group level for our data. In that sense, it is important that notice that both items
513María-José Lera, José-M. León-Pérez, and Paula Ruiz-Zorrilla
Educational
Practices
1.00
.98
.98
Classroom Instructional Students
Management Strategies Engagement
1 1 1 1 2 1 1 1 1 2 2 2 1 1 2
3 5 8 7 1 2 4 6 9
3 5 6 9 1 0 1 7 8 0 3 4 2 4 2
.32 .19 .75 .63 .42 .39 .63 .69 .41 .73 .46 .51 .40 .65 .60 .73 .38 -51 -51 -74 -77 -70 -58 -66
Figure 1. Path diagram for the individual-level hierarchical CFA model
4 and 7 presented negative ICCs. According to Taylor (2010), groups shared equivalent factorial structure (configural invariance),
“Negative ICC estimates are possible and can be interpreted as factor loadings (metrical invariance), means (scalar invariance)
indicating that the true ICC is low, that is, two members chosen and residuals (strict invariance). Every model was estimated and,
randomly from any class vary almost as much as any two randomly if its fit was optimal, it was then compared with the previous one.
chosen members of the whole population” (p. 8). In our scale, it Whether there were meaningful fit differences, model estimation
would indicate that items 4 and 7 capture greater variance at level was stopped, and the former model retained. Following this logic,
1 (individuals) rather than level 2 (group). Nevertheless, in order to evidence for configural invariance (same factorial structure across
preserve the original scale structure, we opted for keeping them. groups) was found for educational stages (CFI = .99, TLI = .99,
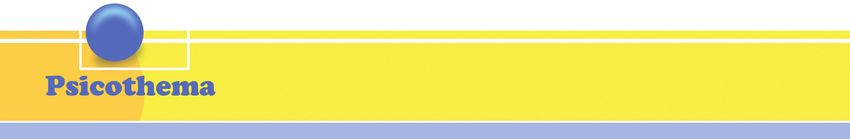
Table 5 presents the fit report (five last rows) for multilevel CFA RMSEA = .00, SRMR = .03), sex (CFI = .99, TLI = .99, RMSEA
models. Again, the bifactor model received more support from data = .00, SRMR = .03) and region (CFI = .99, TLI = .99, RMSEA =
(χ²/df = 2.08, CFI = .96, TLI = .95, RMSEA = .03, SRMR(w) = .02, .00, SRMR = .03).
SRMR(b) = .07), but, as the model estimation returned abnormal results Finally, to test criterion validity we estimated a hierarchical
regarding its standard errors, z values and significance of loadings linear regression model with self-esteem as dependent variable
(results available upon request), we followed the same rational than and STEPS as predictor (Bliese et al., 2018). As shown in Table
for ordinary CFA and retained the hierarchical one (χ²/df = 2.59, CFI = 2, ICC(1) for self-esteem was adequate for conducting multilevel
.93, TLI = .92, RMSEA = .03, SRMR(w) = .03, SRMR(b) = .09). All regression, as it was .07. In step 1, a null model and a mixed model
factor loadings were significant on the within-group level structure, with random intercepts were compared (-2Log diff = 45.55, p <
but item 5 was not significant at the between-group level. Even so, we .01), which showed that there was meaningful variation between
retained the item to preserve the original model. Figure 2 shows the group levels of self-esteem. In step 2, both predictors were
path diagram for the multilevel hierarchical solution. introduced (STEPS at individual and aggregated at educational
stage). However, STEPS was just significantly predicting self-
Invariance and criterion validity esteem at the individual level (t = 8.00, p < .01), which means
that group slopes were not significantly differing from those at the
Group invariance was tested for educational stages, sex, and individual level. Thus, STEPS scores were significantly predicting
region. Several subsequent models were run to test whether the individual levels of self-esteem, but not at the group level. This
Table 5
Educational level, sex and region group invariance models’ fit and comparison
Variable Model χ² (df) p RMSEA SRMR CFI TLI
configural 525.887 (504) .24 .00 .035 .99 .99
Educational stage metrical 688.450 (527) .00 .02 .04 .99 .99
ANOVA χ² diff: 162.56 df diff: 23 p < .01
configural 536.381 (504) .15 .00 .035 .99 .99
Sex metrical 610.104 (527) .00 .01 .037 .99 .99
ANOVA χ² diff: 73.723 df diff: 23 p < .01
configural 532.606 (504) .18 .00 .034 .99 .99
Region metrical 777.336 (527) .00 .02 .04 .99 .99
ANOVA χ² diff: 244.73 df diff: 23 p < .01
514Adaptation of the Teacher Efficacy Scale to Measure Effective Teachers’ Educational Practices Through Students’ Ratings: A Multilevel Approach
Educational
Practices
.98 (w)
.96 (w)
.99 (b)
1 (b) .96 (w)
1 (b)
Classroom Instructional Students
Management Strategies Engagement
1 1 1 1 2 1 1 1 1 2 2 2 1 1 2
3 5 8 7 1 2 4 6 9
3 5 6 9 1 0 1 7 8 0 3 4 2 4 2
Within .38 .25 .45 .61 .29 .36 .56 .65 .45 .67 .46 .56 .45 .63 .58 .66 .40 .49 .49 .68 .45 .66 .59 .63
Between .87 .01 .97 .84 .63 .58 .92 .92 .87 .96 .98 .93 .77 .90 .91 .97 .85 .82 .96 .95 .95 .97 .96 .89
Figure 2. Path diagram for the multilevel CFA hierarchical model
may be due to the nature of our dependent variable (self-esteem) instruction that encourage students’ critical thinking and analysis:
which is intrinsically individual. Kraft et al., 2018; Kyriakides et al., 2013; Stockard et al., 2018);
(2) classroom management (i.e., keeping an adequate classroom
Discussion management, which allows creating an environment that facilitates
both socioemotional and academic student’s progress: Rolland,
Giving the importance of evaluating teachers’ performance 2012; Vandenbroucke et al., 2018); and (3) engagement promotion
nowadays, there is a common assumption that effective educational (i.e., establishing supportive teacher-students relationships
practices need to be assessed by integrating information from that encourage students’ to value learning and promote their
several sources, including students’ ratings. In this regard, this engagement: Korpershoek et al., 2016). These results also support
study analysed the psychometric characteristics and multilevel the generic nature of these factors, as there were not differences
structure of a scale rated by students that measures effective between educational stages, students’ sex, or regions.
educational practices: the STEPS. In addition, effective educational practices were associated
Our results showed that the scale is valid and reliable according with higher student’s self-esteem (at individual level). In other
to both alpha and omega reliability coefficients. Furthermore, our words, students that perceived their teacher as good in managing
results supported the theoretical factor structure of the original the class, instructing in a way that facilitates learning, and caring
scale (TES). Hence, a hierarchical factor solution fitted the data about them and looking for their motivation, also reported higher
best both at the within (students) and between (classrooms) levels, levels of self-esteem. This result is in line with previous studies
which means that there are three interconnected first-order factors that have emphasize the impact of school experiences on students’
(i.e., classroom management, instructional strategies, and students’ self-esteem (Hoge et al., 1990; Watkins, 2000), which is considered
engagement) that can be grouped into a second-order core construct: a pivotal socio-cognitive resource related to students’ academic
effective educational practices. In addition, this factorial solution achievement and well-being (Li et al., 2018). Therefore, although
remains equal for several sociodemographic and contextual factors, causality need to be addressed in future studies, these results support
such as sex (girls vs. boys), educational stages (primary, secondary, to some extent that improving teachers’ educational practices might
and high school), and region (Basque Country vs. Andalusia), be a relevant way to increase students’ psychological wellbeing
which underlines the robustness of the multilevel hierarchical (Ashdown & Bernard, 2012; Fernández-Rodríguez et al., 2019;
factorial solution. In other words, as adopting an individual level Suldo et al., 2009).
approach neglects the nested nature of the phenomena and brings These results have also interesting implications for practice and
to the wrong assumption of independence of the measures (Bliese policy making. The STEPS can enrich existing training programs
et al., 2018), when a multilevel approach is considered, the scale by adding an evidence-based evaluation of teachers’ educational
seems a reliable and valid tool for measuring effective educational practices from students’ perceptions. Therefore, the STEPS can be
practices both at the individual and the classroom level. used as a research tool, but also as an intervention tool aimed at
These results highlight that, although identifying which domains providing specific feedback to teachers and increase their quality
of educational practices contribute more to students’ self-esteem of teaching. In incorporating the STEPS into teachers’ training
might be useful for tailoring interventions aimed at improving programs, attention should also be paid to the extent that the
teachers’ skills and competences (Perera et al., 2019); there is a proposed factors are equally effective across educational stages (as
higher-order general factor comprising classroom management, our study suggests).
instructional strategies, and students’ engagement that explain
more variance that each key domain separately. Therefore, this Limitations and further research
study contributes to support the integrated approach of effective
educational practices (Kyriakides et al., 2013), incorporating Besides its interesting contributions, our study has some
at least three generic factors: (1) instruction (i.e., high quality limitations that should be overcame in further research. First,
515María-José Lera, José-M. León-Pérez, and Paula Ruiz-Zorrilla
our sample followed a convenience sampling technique (i.e., practices vary within the same teacher in different contexts or
some schools were not randomly selected) and therefore is classrooms. Future research may build on these assumptions
non-representative of the Spanish schools, which limits the and explore two relevant issues: (a) establishing cut-off scores
generalizability of our findings. Second, we employed a cross- to establish which scores educational practices need to achieve
sectional research design. Thus, future studies should incorporate to be labeled as “effective enough” or categorize the quality of
longitudinal designs to evaluate the effects of teaching practices teaching; and (b) exploring the external and internal factors that
over time on relevant outcomes at different levels (e.g., classroom may explain why some teachers reach higher scores than others, or
climate, students’ school achievement). In doing so, further research even differences in the scores of the same teacher in one classroom
may benefit from other measures beyond self-report scales to both compared to another classroom.
avoid potential common method variance biases (Podsakoff et al., Despite these limitations, this study offers a reliable and valid
2003) and offer a more robust view of our findings. Moreover, scale for measuring effective teaching practices in school settings,
although self-esteem is correlated with high learning process (for considering three factors from students’ perspective: instructional
a meta-analysis, see Watkins, 2000) and can be considered a proxy strategies, classroom management, and help for students’ self-
of academic achievement, further studies should directly assess regulation and engagement.
academic achievement or include other variables tapping the
motivational or behavioral aspects of students’ achievement rather Acknowledgements
than the psychological one.
Finally, from a methodological perspective, our results This study was supported by research transfer contract FIUS
overcome previous flaws in the literature by testing the multilevel 0956/0426. PRZ is a PhD student funded by the FPU program
nature of teachers’ educational practices, which allows conducting of the Spanish Ministry of Science, Innovation and Universities
comparisons between teachers’ but also to what extent educational (FPU18/03536).
References
Ashdown, D. M., & Bernard, M. E. (2012). Can explicit instruction in social Klassen, R. M., & Tze, V. M. (2014). Teachers’ self-efficacy, personality,
and emotional learning skills benefit the social-emotional development, and teaching effectiveness: A meta-analysis. Educational Research
well-being, and academic achievement of young children? Early Review, 12, 59-76. https://doi.org/10.1016/j.edurev.2014.06.001
Childhood Education Journal, 39(6), 397-405. https://doi.org/10.1007/ Korpershoek, H., Harms, T., de Boer, H., van Kuijk, M., & Doolaard,
s10643-011-0481-x S. (2016). A meta-analysis of the effects of classroom management
Bliese, P. D., Maltarich, M. A., & Hendricks, J. L. (2018). Back to basics strategies and classroom management programs on students’
with mixed-effects models: Nine take-away points. Journal of Business academic, behavioral, emotional, and motivational outcomes.
and Psychology, 33(1), 1-23. https://doi.org/10.1007/s10869-017- Review of Educational Research, 86(3), 643-680. https://doi.
9491-z org/10.3102/0034654315626799
Cerny, C. A., & Kaiser, H. F. (1977). A study of a measure of sampling Kraft, M. A., Blazar, D., & Hogan, D. (2018). The effect of teacher
adequacy for factor-analytic correlation matrices. Multivariate coaching on instruction and achievement: A meta-analysis of the causal
Behavioral Research, 12(1), 43-47. https://doi.org/10.1207/ evidence. Review of Educational Research, 88(4), 547-588. https://doi.
s15327906mbr1201_3 org/10.3102/0034654318759268
Fernández-Alonso, R., & Muñiz, J. (2019). Calidad de los sistemas Kyriakides, L., Christoforou, C., & Charalambous, C. Y. (2013). What
educativos: modelos de evaluación. Propósitos y Representaciones, 7, matters for student learning outcomes: A meta-analysis of studies
e347. http://dx.doi.org/10.20511/pyr2019.v7nSPE.347 exploring factors of effective teaching. Teaching and Teacher Education,
Fernández-Alonso, R., Suárez-Álvarez, J., & Muñiz, J. (2012). Imputación 36, 143-152. https://doi.org/10.1016/j.tate.2013.07.010
de datos perdidos en las evaluaciones diagnósticas educativas. Kyriakides, L., Creemers, B. P., & Panayiotou, A. (2018). Using educational
Psicothema, 24(1), 167-175. effectiveness research to promote quality of teaching: The contribution
Fernández-Rodríguez, C., Soto-López, T., & Cuesta, M. (2019). Needs and of the dynamic model. ZDM Mathematics Education, 50(3), 381-393.
demands for psychological care in university students. Psicothema, https://doi.org/10.1007/s11858-018-0919-3
31(4), 414-421. https://doi.org/10.7334/psicothema2019.78 Li, J., Han, X., Wang, W., Sun, G., & Cheng, Z. (2018). How social support
Green, S. B., & Yang, Y. (2015). Evaluation of dimensionality in the influences university students’ academic achievement and emotional
assessment of internal consistency reliability: Coefficient alpha and exhaustion: The mediating role of self-esteem. Learning and Individual
omega coefficients. Educational Measurement: Issues and Practice, Differences, 61, 120-126. https://doi.org/10.1016/j.lindif.2017.11.016
34(4), 14-20. https://doi.org/10.1111/emip.12100 Martín-Albo, J., Núñez, J. L., Navarro, J. G., & Grijalvo, F. (2007). The
Hattie, J. (2009). Visible learning: A synthesis of over 800 meta-analyses Rosenberg Self-Esteem Scale: Translation and validation in university
relating to achievement. Routledge. students. The Spanish Journal of Psychology, 10, 458-467. http://
Hoge, D. R., Smit, E. K., & Hanson, S. L. (1990). School experiences dx.doi.org/10.1017/S1138741600006727
predicting changes in self-esteem of sixth-and seventh-grade students. Molina, E., Fatima, S. F., Ho, A., Hurtado, C. M., Wilichowksi, T., &
Journal of Educational Psychology, 82(1), 117. Pushparatnam, A. (2018). Measuring teaching practices at scale:
Hu, L. T., & Bentler, P. M. (1999). Cutoff criteria for fit indexes in Results from the development and validation of the TEACH classroom
covariance structure analysis: Conventional criteria versus new observation tool. Research Working Paper No. 8653. World Bank,
alternatives. Structural Equation Modeling: A Multidisciplinary Washington, DC.
Journal, 6(1), 1-55. Muijs, D., Kyriakides, L., Van der Werf, G., Creemers, B., Timperley, H.,
James, L. R. (1982). Aggregation bias in estimates of perceptual agreement. & Earl, L. (2014). State of the art-teacher effectiveness and professional
Journal of Applied Psychology, 67(2), 219-229. learning. School Effectiveness and School Improvement, 25(2), 231-
Kane, T., Kerr, K., & Pianta, R. (2014). Designing teacher evaluation 256. https://doi.org/10.1080/09243453.2014.885451
systems: New guidance from the measures of effective teaching project. Muthén, B. O. (1994). Multilevel covariance structure analysis. Sociological
John Wiley & Sons. Methods and Research, 22(3), 376-398.
516Adaptation of the Teacher Efficacy Scale to Measure Effective Teachers’ Educational Practices Through Students’ Ratings: A Multilevel Approach
Perera, H. N., Calkins, C., & Part, R. (2019). Teacher self-efficacy profiles: Tschannen-Moran, M., & Hoy, A. W. (2001). Teacher efficacy: Capturing
Determinants, outcomes, and generalizability across teaching level. an elusive construct. Teaching and Teacher Education, 17(7), 783-805.
Contemporary Educational Psychology, 58, 186-203. https://doi. https://doi.org/10.1016/S0742-051X(01)00036-1
org/10.1016/j.cedpsych.2019.02.00 Van de Grift, W. (2007). Quality of teaching in four European countries:
Peters, G. J. (2014). The alpha and the omega of scale reliability and A review of the literature and an application of an assessment
validity: Why and how to abandon Cronbach’s alpha and the route instrument. Educational Research, 49, 127-152. https://doi.
towards more comprehensive assessment of scale quality. European org/10.1080/00131880701369651
Health Psychologist, 16(2), 56-69. https://doi.org/10.31234/osf.io/ van der Lans, R. M., van de Grift, W. J., & van Veen, K. (2019). Same,
h47fv similar, or something completely different? Calibrating student surveys
Pianta, R. C., La Paro, K. M., & Hamre, B. K. (2008). Classroom Assessment and classroom observations of teaching quality onto a common metric.
Scoring System. Paul H. Brookes Publishing. Educational Measurement: Issues and Practice, 38(3), 55-64. https://
Podsakoff, P. M., MacKenzie, S. B., Lee, J. Y., & Podsakoff, N. P. (2003). doi.org/10.1111/emip.12267
Common method biases in behavioral research: a critical review of the van der Scheer, E. A., Bijlsma, H. J., & Glas, C. A. (2019). Validity
literature and recommended remedies. Journal of Applied Psychology, and reliability of student perceptions of teaching quality in primary
88(5), 879-903. education. School Effectiveness and School Improvement, 30(1), 30-50.
Rolland, R. G. (2012). Synthesizing the evidence on classroom goal https://doi.org/10.1080/09243453.2018.1539015
structures in middle and secondary schools: A meta-analysis and Vandenbroucke, L., Spilt, J., Verschueren, K., Piccinin, C., & Baeyens,
narrative review. Review of Educational Research, 82(4), 396-435. D. (2018). The classroom as a developmental context for cognitive
https://doi.org/10.3102/0034654312464909 development: A meta-analysis on the importance of teacher-student
Rosenberg, M. (1965). Society and the adolescent self-image. Princeton interactions for children’s executive functions. Review of Educational
University Press. Research, 88(1), 125-164. https://doi.org/10.3102/0034654317743200
Stockard, J., Wood, T. W., Coughlin, C., & Rasplica Khoury, C. (2018). Wagner, W., Göllner, R., Werth, S., Voss, T., Schmitz, B., & Trautwein, U.
The effectiveness of direct instruction curricula: A meta-analysis of a (2016). Student and teacher ratings of instructional quality: Consistency
half century of research. Review of Educational Research, 88(4), 479- of ratings over time, agreement, and predictive power. Journal of
507. https://doi.org/10.3102/0034654317751919 Educational Psychology, 108(5), 705-721. https://doi.org/10.1037/
Suldo, S. M., Friedrich, A. A., White, T., Farmer, J., Minch, D., & edu0000075
Michalowski, J. (2009). Teacher support and adolescents’ subjective Watkins, D. (2000). Learning and teaching: A cross-cultural perspective.
well-being: A mixed-methods investigation. School Psychology Review, School Leadership & Management, 20(2), 161-173. https://doi.
38(1), 67-85. org/10.1080/13632430050011407
Taylor, P. J. (2010). An introduction to intraclass correlation that resolves Woitschach, P., Zumbo, B. D., & Fernández-Alonso, R. (2019). An
some common confusions. Unpublished manuscript, University of ecological view of measurement: focus on multilevel model explanation
Massachusetts, Boston, USA. Retrieved from http://www.faculty.umb. of differential item functioning. Psicothema, 31(2), 194-203. https://
edu/peter_taylor/09b.pdf doi.org/10.7334/psicothema2018.303003
517You can also read