AIR QUALITY IN MONTRÉAL - Environmental Assessment Report 2017 Service de l'environnement - Ville de Montréal
←
→
Page content transcription
If your browser does not render page correctly, please read the page content below
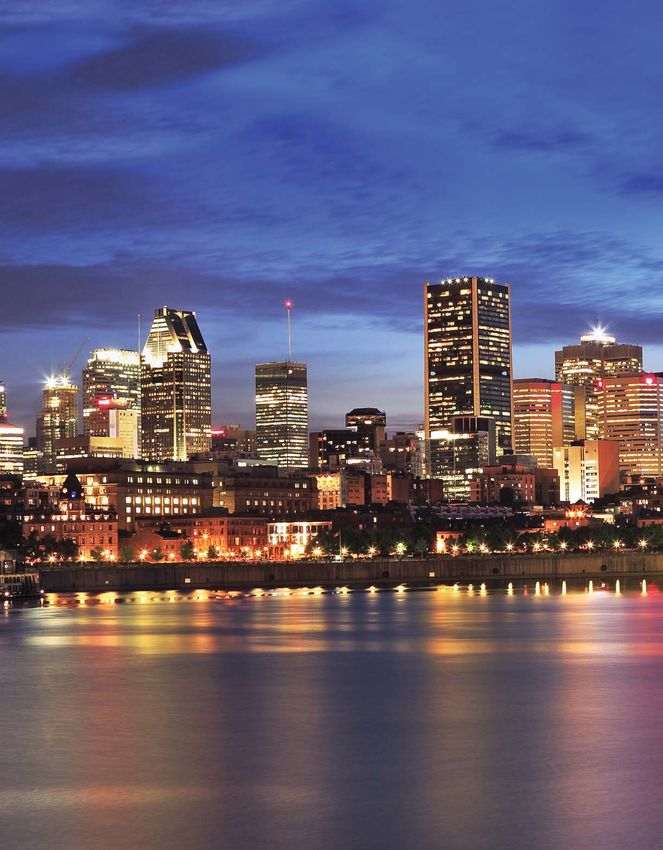
Environmental Assessment Report 2017

AIR QUALITY
IN MONTRÉAL
Service de l’environnement
Portrait of air quality
The Network in short According to established standards...
Over the past year, the Réseau de surveillance de la qualité de l’air A poor air quality day is one where concentrations of fine particulate
(RSQA) (the Network) of the Service de l’environnement pursued its matter (PM2.5) are greater than 35 μg/m3 during at least three hours
activities throughout the territory of the Montréal agglomeration. The for a given station. To be characterized as a smog day, concentrations
results of this monitoring confirm that the good quality of the air has of PM2.5 need to be greater than 35 μg/m3 during at least three hours
been maintained. Indeed, the average concentrations of fine particulate over 75% of the territory of the agglomeration. During a smog day,
matter, ozone, sulfur dioxide, nitrogen dioxide and carbon monoxide concentrations of PM2.5 generally remain high over a period of 24 hours
remained stable. Information on the air quality in Montréal is available in and sometimes longer.
real time on the RSQA’s Web site at rsqa.qc.ca.
RSQA Monitoring Stations on
the Island of Montréal in 2017
Rivière-des-Prairies
NOX O3 CO PM 2.5 PM 10
VOC PAH BC 55
Fire Station 17 Saint-Jean-Baptiste
Montréal-Nord RDP-PAT
NOX O3 CO PM 2.5 NOX O3 SO 2 PM 2.5
PM 10 TSP Anjou
17 3 PM 10 TSP VOC
PM 2.5 PM 10 TSP
6 Chénier, Anjou
7 NO SO PM VOC
X 2 2.5
Saint-Joseph
Sainte-Anne-de-Bellevue Rosemont-La Petite-Patrie
Décarie Interchange NOX O3 SO 2 PM 2.5
NOX O3 SO 2 PM 2.5
PM 10 TSP VOC Mont-Royal PM 10 TSP VOC 80 Hochelaga-Maisonneuve
99 Montréal Airport, Dorval NOX O3 CO PM 2.5
28 PM 2.5 PM 10 TSP
50
NOX O3 CO PM 2.5 VOC 66
St-Dominique, Ville-Marie
31 NOX O3 CO SO 2 PM 2.5 VOC
BC Black Carbon Notre-Dame, Le Sud-Ouest
101
Pollutants measured
CO Carbon Monoxide NOX PM 2.5 PM 10 TSP VOC PAH Richelieu, Le Sud-Ouest
NO X Nitrogen Monoxide and Dioxide 102
PM 2.5 PM 10 TSP PAH
O3 Ozone 104
PAH Polycyclic aromatic hydrocarbon Saint-Patrick, Le Sud-Ouest 103
York/Roberval, Le Sud-Ouest
PM2.5 Particulate Matter (diameter < 2.5 microns) PM 2.5 PM 10 TSP PAH
PM10 Particulate Matter (diameter < 10 microns) NOX O3 PM 2.5 PM 10 RSQA monitoring station
SO2 Sulphur Dioxide TSP PAH
TSP Total Suspended Particulates Turcot project monitoring station
VOC Volatile Organic Compounds
2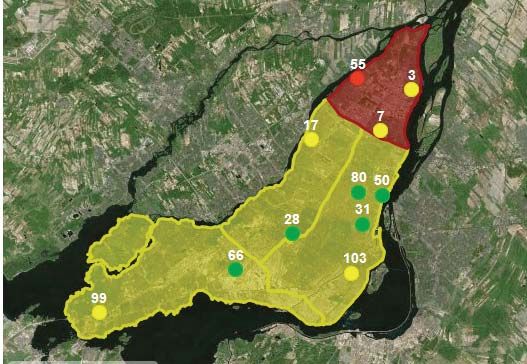
Poor air quality days Poor air quality days in Montréal in 2017
10
1
34 poor air quality days, of which 7 smog days, were recorded in 2017 8
on the territory of Montréal. Fine particulate matter were responsible
1
for all poor air quality days. As far as smog days are concerned, they 6
occurred in January, February, March and December. Indeed, all poor air 2
quality days occurred in the fall and winter. Since the closure of station 4 8
3 6
13 in 2016, a significant decline in the number of poor air quality days
2 4
has been observed compared to the results of previous years. However, 3
2 2
if their number has increased in 2017 compared to 2016, one should 1 1
0
remember that their number is bound to fluctuate from one year to J F M A M J J A S O N D
another depending on weather conditions. Month
Smog Other Sources
Poor air quality days in Montréal since 2012
Air Quality Index (AQI) by station
70
60
Did you know that the stations located nearest to sources of human
50
activities were those that recorded the greatest number of poor air
quality days? Here are a few examples: 40
38 53 57
33
• Station 3: industries in the east end of Montréal 30
• Station 17: fleet work yards of Montréal-Nord 20 21 27
• Station 28: intersection of Décarie North Blvd. and Highway 40 East 10 16 15 10 7 8 7
• Station 50: activities of the Port of Montréal and traffic on 0
Notre-Dame Est Blvd. 2012 2013 2014 2015 2016 2017
• Station 55: wood burning in the winter Smog Other Sources
Air Quality Index (AQI) by monitoring station in 2017
Number of AQI days
Good Acceptable Poor
Data collected
over 307 days
293
240
258
234
233
230
228
217
214
206
191
148
139
134
129
129
121
121
121
108
87
66
17
14
11
10
9
8
8
7
6
4
3
3 7 17 28 31 50 55 66 80 99 103
Stations that continuously measure fine particles (PM2.5)
3
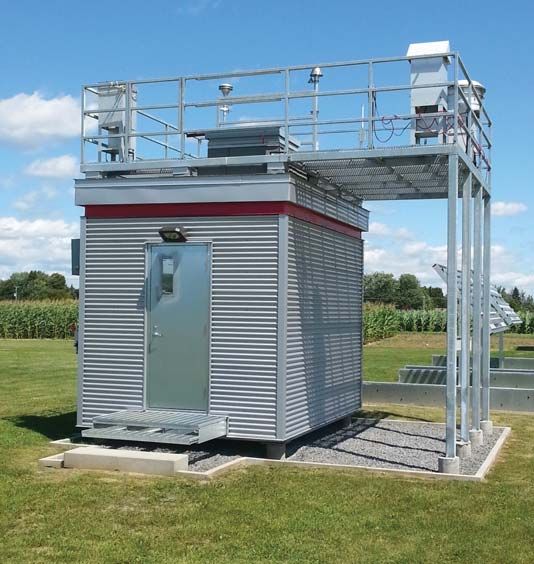
A rejuvenated station                                                          Elementary my dear… carbon !

Station 99 located in Sainte-Anne-de-Bellevue since 1997                      A continuous analyzer of black carbon was installed in station 55
has undergone a rejuvenation.                                                 in the borough of Rivière-des-Prairies. Black carbon (BC), also known
                                                                              as soot carbon, is the result of the incomplete combustion of fossil fuels
                                                                              (oil, petrol) or biomass, namely wood burning.
 Station 99
 Sainte-Anne-de-Bellevue
                                                                                    Diameter of black carbon vs. fine particulate matter

                                                                                                                         Black carbon
                                                                                                                         0.15-0.30 μm

                                                                                                                                  Fine particulate matter
                                                                                                                                         < 2.5 μm

                                                                                                                                          Human hair
                                                                                                                                           50-70 μm

                                                                              January 6, 2017 at 4 p.m., a smog warning was issued for the
                                                                              agglomeration of Montréal. Concentrations of fine particles increased
                                                                              at all stations, and this, until midnight. Station 55 was the only one
                                                                              where the air quality was poor (see map). The BC analyzer showed that
                                                                              the source of the fine particulate matter measured during the evening
                                                                              was the combustion of firewood. And this, despite the fact that, since
                                                                              August 2015, it is forbidden under Bylaw 15-069 to use a solid fuel
                                                                              appliance or fireplace during a smog warning. Given the high density of
                                                                              wood burning stoves and fireplaces in the vicinity of this station, it is very
                                                                              likely that the use of wood burning appliances, despite the smog warning
                                                                              in effect, resulted in a deterioration of the air quality, from acceptable to
             Validation of data                                               poor, in this sector.

                                                                              January 6, 2017
In order to comply with the quality assurance and control
guidelines of the program of Environment Canada’s National Air
Pollution Surveillance (NAPS) network, the results obtained by the
RSQA are submitted to a rigorous multi-step validation process. First
of all, a daily validation is conducted to ensure that all equipment is
functioning adequately. Then, any data that are deemed suspicious are
submitted to an in-depth analysis in order to determine their cause.
Each case is treated individually and documented in the data base.
After which, the data are compared with monthly and annual trends
for Montréal. Finally, the data would only be made public once the
validation process is completed.

                                                                          4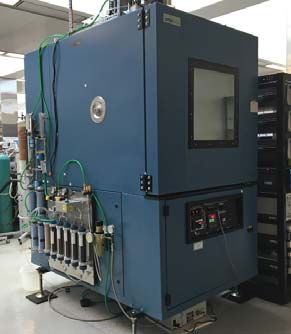
Turcot Project                                                                       Conferences

Air quality monitoring within the framework of the rebuilding of the                  In June 2017, Movin’On, an international conference sponsored
Turcot Interchange is ongoing. In 2017, average daily concentrations of               by Michelin, was held in Montréal under the theme, From
fine particulate matter (PM2.5) exceeded the Ministère du Développement               ambition to action – Smart and sustainable urban mobility for all.
durable, de l’Environnement et de la Lutte contre les changements                     The City of Montréal was well represented and the Réseau de
climatiques (MDDELCC) 30 μg/m3 standard on only 4 occasions at                        surveillance de la qualité de l’air was invited to present its report
station 102, compared to 13 in 2016. An improvement was also                          on air quality in Montréal.
observed at all other stations.

   Exceedances of standard for fine particulate matter (PM2.5)

        Stations             101          102           103            104

       Total 2016             1           13                1            3

       Total 2017             0            4                0            1

The activities underway in the vicinity of the stations strongly influence
the results observed at each one of them. Described below are some of
the characteristics of the environment surrounding the stations:
  •     Station 101: Presence of a temporary noise abatement wall,
        mitigation of the emissions of the 136 roadway
  •     Station 102: On the construction site, near the Turcot ramps
  •     Station 103: Near an exit ramp of Highway 15
                                                                                      Also, in September 2017, a team from RSQA attended a conference
  •     Station 104: Industrial sector and, near the snow dump,                       on air quality sensors, Making Sense of Sensors, organized by the
        heavy truck traffic                                                           South Coast Air Quality Management District (SCAQMD) and the
                                                                                      California Air Pollution Control Officers Association (CAPCOA). This
       Air Quality Index (AQI) by Turcot Project station in 2017                      conference, among other offerings, allowed attendees to familiarize
                                                                                      themselves with the new technologies used by the sensors now
                                                                                      on the market, to assess the quality of the data collected by the
                                                                                      sensors and to better understand the context in which they can
                                                                                      be used. The conference also afforded us a unique opportunity to
                                                                                      visit the laboratory of the AQ-SPEC (Air Quality-Sensor Performance
                                                                                      Evaluation Center) for the testing of air quality sensors.
 267

                                          230

                                                                225
                      167

                            157

                                                 122

                                                                       119
                                   41
        87

                                                                             21
                                                       12
             6

       101                  102                 103                    104
                                    Station

        Number of AQI days         Good        Acceptable       Poor

The data are available online at the Web site of the Ministère des
Transports, de la Mobilité durable et de l’Électrification des transports
(MTMDET) at seti-media.com/infopopulation/rsqa_turcot.
                                                                                                                                                   Credit: © AQ-SPEC

                                                                                  5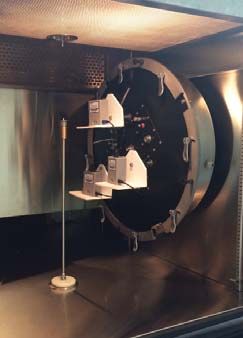
Canadian Ambient Air Quality Standards
The Canadian Ambient Air Quality Standards (CAAQS) were set for                              The results for SO2 over the last 5 years show an almost constant
fine particulate matter (PM2.5), ozone (O3) and sulfur dioxide (SO2).                        improvement and are compliant with the 2020 threshold. The variation
In December 2017, new standards were added for nitrogen dioxide                              from last year is insignificant.
(NO2). These standards are at the heart of the Air Quality Management
System (AQMS) put forward by the Canadian Council of Ministers of the                        Concentrations of sulfur dioxide (SO2) expressed in ppb
Environment. These data are presented in micrograms per cubic metre
                                                                                                          3-year average of the annual 99th percentile of the daily
(μg/m3) or in parts per billion (ppb).                                                                           maximum 1-hour average concentrations
                                                                                                             Standard = 70 in 2020 Standard = 65 in 2025
Since 2011, an improvement in concentrations of PM2.5 has been
                                                                                                2011-2013           2012-2014     2013-2015        2014-2016       2015-2017
observed in Montréal’s ambient air. However, the changes between
                                                                                                    26                 23              23              21               18
2014-2016 and 2015-2017 are insignificant. These results are below
the threshold set for 2020.                                                                                   Arithmetic average over a single calendar year
                                                                                                                   of all 1-hour average concentrations
                                                                                                            Standard = 5.0 in 2020 Standard = 4.0 in 2025
Concentrations of fine particulate matter expressed in μg/m3
                                                                                                   2013               2014           2015             2016            2017
            3-year average of the annual 98th percentile of the daily
                                                                                                    1.0                1.1            0.9              0.7             0.8
                       24-hour average concentrations
               Standard = 28 in 2015 Standard = 27 in 2020
  2011-2013        2012-2014        2013-2015         2014-2016      2015-2017               The 3-year averages for NO2 show very little variation between 2011
       26               25               24                21              20                and 2017. The concentrations recorded in 2015-2017, i.e. 45 ppb,
                                                                                             are well below the 2020 standard, but just above the 2025 standard
             3-year average of the annual average concentrations                             (42 ppb). The use of fossil fuels in automobiles and domestic heating
               Standard = 10 in 2015 Standard = 8.8 in 2020
                                                                                             systems are the main source of NO2. As far as the annual averages are
  2011-2013        2012-2014        2013-2015         2014-2016      2015-2017               concerned, they are compliant with the 2020 and 2025 standards
      9.7               9.6              9.4               8.6             8.5               despite a slight increase in 2017.

The trend, in terms of O3, is rather stable with 3-year averages                             Concentrations of nitrogen dioxide (NO2) expressed in ppb
ranging from 55 to 58 ppb between 2011 and 2017. Despite a slight
                                                                                                          3-year average of the annual 98th percentile of the daily
upward trend since 2012-2014, the concentrations recorded remain                                                 maximum 1-hour average concentrations
below the 2020 threshold.                                                                                    Standard = 60 in 2020 Standard = 42 in 2025
                                                                                               2011-2013            2012-2014     2013-2015        2014-2016       2015-2017
Concentrations of ozone (O3) expressed in ppb                                                       45                 44              46              45              45

                 3-year average of the annual 4th highest daily                                               Arithmetic average over a single calendar year
                   maximum 8-hour average concentrations                                                           of all 1-hour average concentrations
                Standard = 63 in 2015 Standard = 62 in 2020                                                  Standard = 17 in 2020 Standard = 12 in 2025
  2011-2013        2012-2014        2013-2015         2014-2016      2015-2017                     2013               2014           2015             2016            2017
       57               55               55                56              58                       9.7                9.5            8.4             10.0            10.3

PRODUCTION                                                        PHOTOGRAPHY                                                2nd quarter 2018
Ville de Montréal                                                 Ville de Montréal except if otherwise indicated            ISSN 1925-685x (print)
Service de l’environnement                                                                                                   ISSN 1925-6868 (PDF)
Division de la planification et du suivi environnemental          COVER                                                      Legal deposit – Bibliothèque et Archives
Réseau de surveillance de la qualité de l’air (RSQA)              iStock                                                     nationales du Québec, 2018
                                                                                                                             Legal deposit – Library and Archives Canada, 2018
INFORMATION                                                       GRAPHIC DESIGN
Diane Boulet, chemist                                             Rachel Mallet
dianeboulet@ville.montreal.qc.ca

                                                                   ville.montreal.qc.ca/RSQA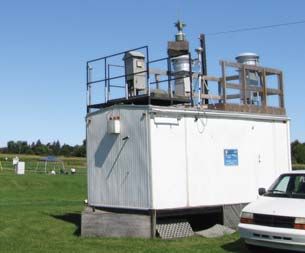
You can also read