An ADA Health Policy Institute Analysis for the North Carolina Department of Health and Human Services, Division of Health Benefits
←
→
Page content transcription
If your browser does not render page correctly, please read the page content below

An ADA Health Policy Institute Analysis for the
North Carolina Department of Health and Human
Services, Division of Health Benefits

This report was provided to North Carolina Department of Health and Human Services by the American Dental
Association’s Health Policy Institute on December 3, 2020 in accordance with their licensed agreement.

This research report was developed by the American Dental Association’s Health Policy Institute.
211 E. Chicago Avenue
Chicago, Illinois 60611
312.440.2928
HPI@ADA.org

For more information on products and services, please visit our website ADA.org/HPI.

North Carolina DHHS Report – ADA Health Policy Institute                                           2
The American Dental Association’s Health Policy Institute is a thought leader and trusted source for
data and research on critical issues affecting the U.S. dental care system. Their research agenda
includes, but is not limited to, dental practice economies, health care reform, dental education, and
oral health outcomes. Their work is led by health economists, statisticians and policy researchers and
uses data collected in-house as well as data from private and public institutions. HPI has been cited
by CNN, The New York Times, The Washington Post, The Wall Street Journal, Fox News, NOVA, and
The Atlantic. To learn more about HPI, visit ADA.org/HPI.

North Carolina DHHS Report – ADA Health Policy Institute                                                3

Table of Contents

Background on Dental Care Reform in North Carolina..................................................................... 5
Key Findings of the HPI Analysis ..................................................................................................... 11
Geographic Access to Dental Care .................................................................................................. 13
Assessing Appointment Availability for Medicaid Enrollees .............................................................. 24
Projected Supply of Dentists ............................................................................................................ 36
Research Contributors ..................................................................................................................... 54
Disclaimer........................................................................................................................................ 55

North Carolina DHHS Report – ADA Health Policy Institute                                                                                          4

Background on Dental Care Reform in North Carolina

An introduction by Mark W. Casey, DDS, MPH, NC Medicaid Dental Officer

The North Carolina Department of Health and                The best place to start in telling the story of the NC
Human Services (NC DHHS) Division of Health                Medicaid and NC Health Choice dental programs
Benefits (DHB) and its partner, the North Carolina         over the last two decades is the groundbreaking
Dental Society (NCDS), wish to thank the American          1998 North Carolina Institute of Medicine “Task
Dental Association Health Policy Institute (HPI) for       Force on Dental Access.” 1 This convening of private
its thorough examination and insightful analysis of        and public stakeholders developed a list of
claims, beneficiary enrollment, provider participation     recommendations that has been used as a blueprint
and dental workforce data in the following report:         to make improvements in the delivery of oral health
“An ADA Health Policy Institute Analysis for the           services to disadvantaged publicly insured children
North Carolina Department of Health and Human              and adults in North Carolina. Utilization data from
Services, Division of Health Benefits.”                    the Health Care Financing Administration (HCFA)
                                                           Early and Periodic Screening, Diagnosis and
DHB would also like to thank HPI for the opportunity
                                                           Treatment Participation Report (416 Report)
to present additional background information about
                                                           showed that in federal fiscal year (FFY) 1999,
the NC Medicaid and Health Choice (CHIP) dental
programs. We hope that the additional information          approximately 23% of children ages 1-20 who were
                                                           eligible at least one month during the reporting
will provide context to the detailed analysis that HPI
                                                           period received at least one dental service. 2
has generated from evaluation of calendar year
                                                           Coverage of pediatric dental services is mandated
2018 claims and eligibility data provided to them by
DHB. The in-depth report that follows this                 under Title XIX of the Social Security Act, whereas
                                                           adult dental services coverage is optional for states.
introduction demonstrates the prodigious analytical
                                                           Thus, the tracking of pediatric dental measures is
skills of the HPI team. HPI is the preeminent
                                                           critical to the oversight provided by NC Medicaid’s
authority on dental health care policy in the U.S.
and is renowned for its comprehensive analysis and         federal partners at the Centers for Medicare and
                                                           Medicaid Services (HFCA became CMS in 2001).
innovative presentation of Medicaid/CHIP data,
                                                           With less than one-quarter of NC Medicaid-enrolled
which tell the story of the oral health care delivery
system at the state and national levels.                   children receiving a dental service each year, it
                                                           became clear to all stakeholders on the NCIOM

1                                                          2
 North Carolina Institute of Medicine. Task force on        Centers for Medicare and Medicaid Services. CMS 416
dental access: report to the North Carolina General        Annual EPSDT participation report. 1999. Available from:
Assembly and to the Secretary of the North Carolina        https://www.medicaid.gov/medicaid/benefits/early-and-
Department of Health and Human Services. 1999.             periodic-screening-diagnostic-and-treatment/index.html.
Available from: https://nciom.org/task-force-on-dental-    Accessed November 17, 2020.
care-access/. Accessed November 17, 2020.

North Carolina DHHS Report – ADA Health Policy Institute                                                        5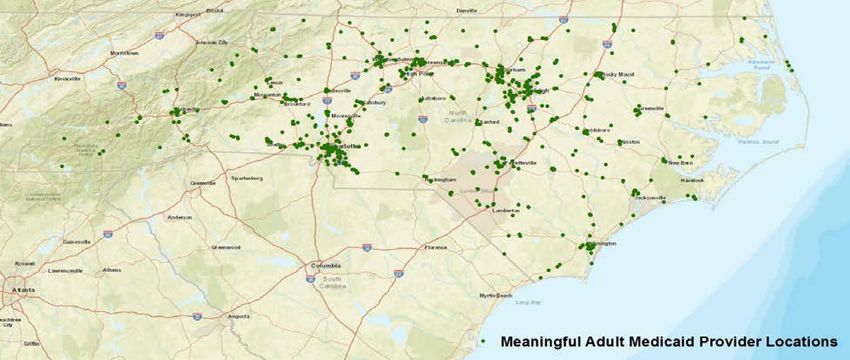
task force that the NC Medicaid and Health Choice          In 2001, NC Medicaid implemented statewide
(CHIP) dental programs were far from successful            coverage for the groundbreaking Physician Fluoride
and needed major changes.                                  Varnish Services program known as Into the Mouth

In 2000, in Antrican v. Bruton, a lawsuit was filed on     of Babes (IMB). The North Carolina model for
                                                           improving the delivery of important preventive oral
behalf of North Carolina Medicaid beneficiaries
against NC DHHS challenging the adequacy of                health services was based on a successful pilot
                                                           project, which trained medical professionals to
Medicaid dental reimbursement rates and the
                                                           apply topical fluoride as part of well-child visits
state’s efforts to ensure access to dental care. The
                                                           beginning at the eruption of the first primary tooth.
plaintiffs alleged that only 16% of North Carolina
dentists participated in the state’s Medicaid              IMB proved that early intervention through
                                                           counseling parents/caregivers, applying fluoride
program. The lawsuit was settled in 2003. To meet
                                                           varnish, and encouraging dental referrals paid
the obligations detailed in the settlement, the
                                                           dividends in significant reductions in tooth decay. 4
Division of Medical Assistance (now known as the
Division of Health Benefits) increased                     Evaluation of IMB by the UNC-CH Gillings School
                                                           of Global Public Health produced many noteworthy
reimbursement rates for a selected list of dental
                                                           evidence-based studies that were published in
procedures commonly provided to children. This set
of procedures was negotiated based on the initial          peer-reviewed journals. The findings of these

recommendations of the plaintiffs, utilization of the      studies indicated substantial gains in access to
                                                           preventive oral health services in all counties of the
services, expected cost of the rate increases, and
                                                           state, reduction in the need for caries-related
the amount of state funding made available by the
NC General Assembly. Effective April 1, 2003,              treatment and hospital-based care for the target
                                                           preschool population, and proven cost effectiveness
reimbursement rates for 36 dental procedures were
                                                           of the pioneering preventive oral health program. 5
raised to 73% of the UNC School of Dentistry
                                                           More than 45 other state Medicaid programs have
Dental Faculty Practice rates. While the procedures
chosen for rate increases were selected primarily          imitated the IMB NC medical model across the
                                                           country. In September 2008, the NC Medicaid
for their impact on children, more than two-thirds of
                                                           Dental Director testified about the success of IMB to
the procedures were services also utilized by adult
                                                           the U.S. House of Representatives Committee on
beneficiaries. 3
                                                           Oversight and Government Reform, Domestic
                                                           Policy Subcommittee. 6 The testimony was part of a

3North Carolina Institute of Medicine. Update task force   Government Reform/Domestic Policy Subcommittee
on dental care access report to the North Carolina         Hearing. September 23, 2008. Available upon request.
General Assembly and to the Secretary of the North         5
Carolina Department of Health and Human Services.           Division of Public Health. Into the mouths of babes.
2003. Available from: https://nciom.org/wp-                North Carolina Department of Health and Human
content/uploads/2017/08/dentalupdate03.pdf. Accessed       Services. 2020. Available from:
November 17, 2020.                                         https://publichealth.nc.gov/oralhealth/partners/IMB.htm.
                                                           Accessed November 17, 2020.
4Casey M. Necessary reforms to pediatric dental care       6
under Medicaid. Written testimony. U.S. House of            Casey M. Necessary reforms to pediatric dental care
Representatives Committee on Oversight and                 under Medicaid. Written testimony. U.S. House of

North Carolina DHHS Report – ADA Health Policy Institute                                                         6
panel presentation by Medicaid dental policy               payments that attracted more providers to
experts who were asked to report on                        participate in the program. Further, program staff
Medicaid/CHIP pediatric oral health program                stepped up recruitment efforts by attending and
reforms. These hearings were held in the wake of           presenting to state and local professional
the unfortunate death of Maryland Medicaid                 membership organization meetings as well as
beneficiary, Deamonte Driver, in 2002. This young          annually presenting to predoctoral and postdoctoral
man died from an infection of dental origin which          students. By 2008, the program reported over 1,900
could have been prevented if he had been able to           unduplicated billing providers in its network, a gain
access timely dental care. In 2019, the National           of almost 20% since 2001. 9
Academy of Medicine featured IMB as an example
                                                           More and more NC licensed dentists committed to
of strategies that have successfully integrated
                                                           treating the underserved in the state. According to
medicine and dentistry in the U.S. 7
                                                           Division of Medical Assistance internal reports
While improvements were made in access to care             derived from the agency’s own administrative
and in oral health outcomes for preschool-age NC           claims database, almost 50% of active licensed
Medicaid beneficiaries due to IMB, the                     dentists in the state participated in the program by
Medicaid/CHIP dental provider network was also             2011. 10 NC Medicaid implemented three separate
registering impressive gains in utilization of             reimbursement rate increases from 2006 to 2008.
services. By 2005, the mandatory children’s dental         Total NC Medicaid dental expenditures increases
benefit program saw utilization rates for children         from approximately $58 million in 2000 to $362
ages 1-20 increased to      40%. 8   Over this same        million in 2011. 11 Many observers heralded this
period, the state Medicaid agency and its fiscal           comeback as solely due to the outcome of the
agency instituted reforms to the processing of             Antrican v. Bruton lawsuit. This conclusion ignores
provider enrollment applications, prior authorization      the efforts of NC DHHS Division of Medical
requests, claims for dental services and direct            Assistance staff to implement meaningful reform to

Representatives Committee on Oversight and                 Carolina. December 12, 2012. Available from:
Government Reform/Domestic Policy Subcommittee             https://nciom.org/task-force-on-childrens-preventive-oral-
Hearing. September 23, 2008. Available upon request.       health-services/ or upon request. Accessed November
7                                                          17, 2020.
 National Academy of Medicine. Integrating oral and
general health through health literacy practices:          10 Centers for Medicare and Medicaid Services. CMS 416

proceedings of a workshop. 2019. Available from:           Annual EPSDT Participation Report. 2005. Available
https://www.nap.edu/catalog/25468/integrating-oral-and-    from: https://www.medicaid.gov/medicaid/benefits/early-
general-health-through-health-literacy-practices-          and-periodic-screening-diagnostic-and-
proceedings. Accessed November 17, 2020.                   treatment/index.html. Accessed November 17, 2020.
8 Centers for Medicare and Medicaid Services. CMS 416      11 Steinmetz E, et al. Children’s use of dental care in
Annual EPSDT Participation Report. 2005. Available         Medicaid federal fiscal years 2000-2012. The George
from: https://www.medicaid.gov/medicaid/benefits/early-    Washington University Milken Institute of Public Health.
and-periodic-screening-diagnostic-and-                     October 2014. Available from:
treatment/index.html. Accessed November 17, 2020.          https://www.medicaid.gov/sites/default/files/2019-
9                                                          12/dental-trends-2000-to-2012.pdf. Accessed November
  Casey M. North Carolina Institute of Medicine: task
                                                           17, 2020.
force on children’s preventive oral health services. The
State of Medicaid and CHIP Dental Services in North

North Carolina DHHS Report – ADA Health Policy Institute                                                          7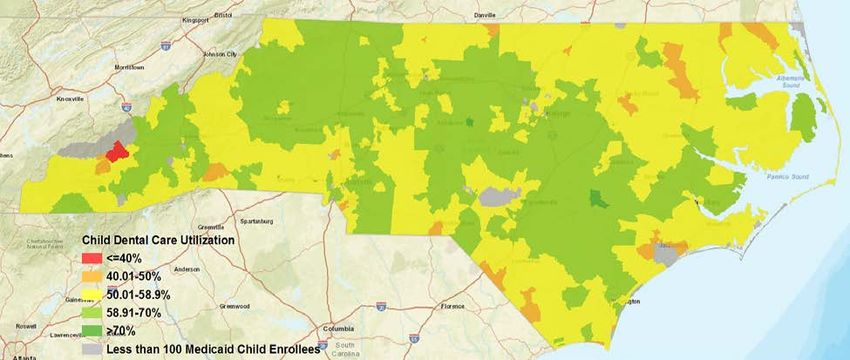
the NC Medicaid and Health Choice dental                   austerity and declining revenues, the Division of
programs.                                                  Medical Assistance reduced dental reimbursement
                                                           rates three times, and the Medicaid pediatric
At the beginning of the 2010 decade, the NC
                                                           utilization rates as calculated from the CMS 416
Medicaid dental program had completed a
                                                           report never decreased in North Carolina
remarkable turnaround in beneficiary utilization as
                                                           throughout the whole decade. 14 This was
well as provider participation metrics. The former is
                                                           remarkable in that other states did experience
typically measured by pediatric utilization rates
                                                           declining children’s utilization rates as fees paid to
calculated from the CMS 416 ESPDT participation
                                                           providers fell further and further behind market-
report. In a little over ten years, NC Medicaid went
                                                           based benchmarks. The gradual increase in
from the bottom 25% of states in terms of dental
                                                           utilization rates from 2010-2019 is characteristic of
utilization rates for children ages 1-20 to the top
                                                           the NC Medicaid/CHIP dental programs having a
25% of states by 2012. 12 The about face was so
                                                           core group of enrolled providers who remained
transformative that in 2010, CMS recognized North
                                                           active participants even as the average rates paid
Carolina’s Medicaid dental program as one of eight
                                                           for the services that dentists render to children was
state Medicaid agency dental programs with high
                                                           not in the upper echelon of reimbursement rates
pediatric dental utilization rates and/or innovative
                                                           paid by state Medicaid dental programs. The
practices that improved the delivery of oral health
                                                           program did lose some providers from its network
services. NC Medicaid qualified for this distinction
                                                           with the participation rate falling below 45% of
based on both high children’s dental utilization rates
                                                           active licensed dentists in the state throughout most
and the seminal IBM/Physician Fluoride Varnish
                                                           of the decade. 15 However, the fact that pediatric
Service   Program. 13
                                                           utilization gradually increased, albeit not as

By late 2008, during the Great Recession, state            impressively as it had increased from 2005-2010,

revenues began to decline in North Carolina. During        was a sign that other more actively participating

this period, many state Medicaid agencies spent the        providers were able to meet the demand for

next several years reducing dental reimbursement           services previously met by providers who chose not

rates and modifying covered services to stave off          to participate during the economic downturn and

even more dramatic cuts to services for the publicly       recovery.

insured. Throughout a lengthy period of economic

12 Centers for Medicare and Medicaid Services. CMS 416     14 Division of Health Benefits. Wellness visits and

Annual EPSDT Participation Report. Federal fiscal years    diagnostic and treatment Services. Federal fiscal year
1999 and 2012. Available from:                             2010–2020. NC Department of Health and Human
https://www.medicaid.gov/medicaid/benefits/early-and-      Services. Available from:
periodic-screening-diagnostic-and-treatment/index.html.    https://medicaid.ncdhhs.gov/providers/programs-and-
Accessed November 17, 2020.                                services/medical/wellness-visits-and-diagnostic-and-
13 Centers for Medicare and Medicaid Services. 2010        treatment-services. Accessed November 17, 2020.
                                                           15 Division of Health Benefits. Internal Report: DR 2018-
individual state reports. October 2010. Available from:
https://www.medicaid.gov/medicaid/benefits/dental-         5984. NC Department of Health and Human Services.
care/index.html. Accessed November 17, 2020.               March 6, 2018. Available by request.

North Carolina DHHS Report – ADA Health Policy Institute                                                            8
During tough fiscal times, state Medicaid agencies 1b. CMS asked states to strive to increase
are often directed to propose cutting optional utilization rates by 10 percentage points over a five-
services like adult dental benefits. From 2008 and year span of time. The baseline year selected by
into the first half of the next decade, many states CMS for the PDENT metric was FFY 2011. 17 Most
implemented cuts to adult dental services. The likely due to the lagging economic recovery in
primary form of reduction is to limit coverage to states over much of the decade, the objective was
emergency dental services in an effort to balance only reached by a handful of states. North Carolina
state budgets. 16 A reduction in coverage for adult was not among the states that were able to achieve
beneficiaries was formally proposed as a cost- the goal of a 10 percentage point increase in five
cutting measure at least twice during the economic years, achieving instead. However, by FFY 2019,
crisis and the lengthy recovery. However, thanks to North Carolina was able to achieve a 7 percentage
support from key stakeholders like the North point gain and did not move backwards in any of
Carolina Dental Society, the Executive Branch of the years since 2011 as did the Medicaid dental
State government and the North Carolina General programs in the neighboring states of Tennessee
Assembly decided to forgo proposed significant and South Carolina. In FFY 2019, North Carolina
reductions in the NC Medicaid adult dental benefit. Medicaid ranked 13 in the nation at 52.1% for the
Discussion of cuts to the adult dental benefit PDENT measure, approximately 4 percentage
mobilized an influential alliance of stakeholders points above the national mean and in the top third
representing both beneficiaries and dental providers of states. 18
to voice opposition to the proposed reductions.
NC Medicaid measures provider participation by
At the beginning of the decade, the CMS Medicaid using administrative claims data to calculate a
Central Office Dental staff announced an ambitious numerator of individual dentists who had been the
National Oral Health Initiative that sought significant attending or rendering provider on at least one paid
improvement on a performance measure targeting claim. This numerator is divided by a denominator
preventive dental services, known as PDENT by of the number of active licensed dentists in North
CMS. The measure numerator and denominator Carolina, which is reported to DHB by the NC State
data are reported on the CMS 416 report. The Board of Dental Examiners. In calendar year 2018,
measure is calculated by dividing line 12b by line the year examined by HPI, using the same
16 McGinn-Shapiro M. Medicaid coverage of adult dental care/downloads/cms-oral-health-strategy.pdf. Accessed
services. National Academy for State Health Policy. State November 17, 2020.
Health Policy Monitor. October 2008. Available from: 18 Centers for Medicare and Medicaid Services.
https://www.nashp.org/wp-
content/uploads/sites/default/files/Adult%20Dental%20Mo Children’s health quality measures: core set: performance
nitor.pdf. Accessed November 17, 2020. on the child core set measures, FFY 2019. September
2020. Available from:
17 Centers for Medicare and Medicaid Services. https://www.medicaid.gov/medicaid/quality-of-
Improving access to and utilization of oral health services care/performance-measurement/adult-and-child-health-
for children in Medicaid and CHIP programs CMS Oral care-quality-measures/childrens-health-care-quality-
Health Strategy. Available from: measures/index.html. Accessed November 17, 2020.
https://www.medicaid.gov/medicaid/quality-of-
North Carolina DHHS Report – ADA Health Policy Institute 9methodology described above, DHB calculated the vast majority of publicly insured children were not percentage of active licensed dentists in North receiving an annual dental visit. North Carolina has Carolina that participate in NC Medicaid at 42%. been a state that has prided itself on a progressive DHB has found that somewhere between 40-45% approach to delivering health care and its of licensed dentists in North Carolina have been leadership in the dental public health arena. The active in our program since 2015. It is important to first state dental public health agency in the U.S. note that HPI has reported a significantly lower was founded in North Carolina in 1918. The NC percentage of active dentists participating in the NC DHHS, in close collaboration with the North Medicaid program over the last few years in their Carolina Dental Society, looks forward to improving previous infographics on state Medicaid dental the delivery of oral health services to NC Medicaid programs. HPI does not use administrative claims and Health Choice beneficiaries to meet the data to calculate state Medicaid provider challenges which HPI report describes in detail. participation rates since obtaining that data for all This report is our new roadmap to success in an 50 states would be virtually impossible to do in a ongoing quest, which will not end until all timely manner. HPI’s provider participation rate for disadvantaged North Carolinians achieve optimal NC Medicaid has varied from 29% to 35% over the oral health. course of the last few years. NC Medicaid and its partner, the North Carolina Mark W. Casey DDS, MPH Dental Society, agree that there is much work left to Dental Officer do to fulfill the promise of better oral health for the NC Medicaid disadvantaged in our state. However, it is also Division of Health Benefits important to take note of the progress that has been NC Department of Health and Human Services made over the last 20 years from a time when the North Carolina DHHS Report – ADA Health Policy Institute 10
Key Findings of the HPI Analysis

In this report, the ADA Health Policy Institute provides an in-depth custom analysis specific to North Carolina in
regards to geographic access to Medicaid dentists, meaningful participation in Medicaid among dentists, and the
projected supply of dentists. Full results and in-depth descriptions of our data and methods are available in the
succeeding sections.

In summary, our analysis has determined that supply of meaningful Medicaid providers and utilization vary
geographically for children ages 1-20 and adults ages 21-64. State-wide, North Carolina Medicaid-enrolled
children have a higher dental care utilization rate (58.9 percent with a dental visit in the past year) than the
national average (51.7 percent). However, utilization among children falls below 25 percent in some counties.
Among Medicaid-enrolled adults in North Carolina, dental care utilization is 18.7 percent, below the national
average for publicly insured adults (23.2 percent). Utilization among Medicaid-enrolled adults is especially low in
the mountain west portion of the state and along the Atlantic coast in northeastern North Carolina. Meaningful
Medicaid dental providers (i.e., those meeting a threshold for reimbursement or patient volume) tend to be
clustered around major metropolitan areas. For adults and children, we found that areas with both low Medicaid
dental care utilization and an insufficient supply of Medicaid dental providers are also associated with low supply
of meaningful Medicaid providers.

To further measure access to dental care in North Carolina, we examined how dental insurance type and other
patient demographics impact ability to secure a dental appointment. Based on results of a mystery shopper
survey, Medicaid-insured callers are less likely to secure a dental appointment than privately insured individuals.
Even in areas with a sufficient supply of meaningful Medicaid providers according to the minimum thresholds we
used, Medicaid-insured callers are less likely to secure an appointment compared to privately insured callers.
This suggests that our definition of “meaningful” provider may not be pertinent from the patient perspective.
Callers from rural areas are less likely to secure a dental appointment, and African American callers have longer
appointment wait times than white callers, although there was not much variation by race. Callers most often
cited that the dental office was not accepting any new patients as the reason why they cannot secure an
appointment.

The supply of dentists in North Carolina, on a per capita basis, is projected to increase through 2039. The state
is expected to consistently gain more dentists (e.g., new graduates, in-migration) than it loses (e.g., retirement,
out-migration) and the expected net gain is larger than the expected increase in the population. In particular, the
female share of the workforce is projected to increase from about one-third in 2019 to nearly half in 2039. This

North Carolina DHHS Report – ADA Health Policy Institute                                                           11
could have important implications for practice patterns and access to care as female dentists, all else equal, are
more likely to practice in DSOs, less likely to be practice owners, and more likely to be Medicaid providers. 19

There are important policy implications to our analysis. There are several areas in North Carolina where there
appears to be a sufficient number of meaningful Medicaid providers, yet dental care utilization is lower than the
state average. In such areas, it may be that there is a lack of knowledge among Medicaid enrollees about how
to contact dentists that participate in the program. Additional patient outreach in these areas may be necessary
to inform enrollees of the locations of meaningful providers or, more broadly, to raise oral health literacy. In
areas where utilization is below the state average and there is an insufficient supply of meaningful providers, the
North Carolina Medicaid program may want to devise strategies to entice more dentists to treat Medicaid
patients. These strategies include raising reimbursement rates to providers, streamlining administrative
processes, and initiating targeted outreach to select providers and patients. 20

There are several non-traditional models of care that may improve dental care access in underserved areas of
North Carolina. These include providing basic dental services through school-based programs, mobile clinics
and Federally Qualified Health Centers (FQHCs), and matching dentists with physicians and pediatricians in
areas where Medicaid enrollees reside but there are not a sufficient number of dental offices. The North
Carolina Medicaid program may consider such strategies to increase dental care utilization.

19 Nasseh K, Vujicic M. The relationship between education debt and career choices in professional programs. JADA.

2017;148(11): 825-833.
20 Nasseh K, Vujicic M. The impact of Medicaid reform on children's dental care utilization in Connecticut, Maryland, and

Texas. Health Services Research. 2014;50(4): 1236-1249.

North Carolina DHHS Report – ADA Health Policy Institute                                                                12
Geographic Access to Dental Care in North Carolina

In May 2017, HPI released state-specific analyses comparing where Medicaid/CHIP-insured children reside and
where Medicaid/CHIP-participating dentists practice, providing states with detailed illustrations of their public
dental care accessibility. HPI found that 90 percent of Medicaid/CHIP-insured children in North Carolina resided
within 15 minutes of a Medicaid/CHIP-participating dentist. 21 While this analysis provided some idea of the North
Carolina Medicaid dental network, it was limited in that it did not demonstrate dental care utilization levels in
relation to Medicaid/CHIP-participating dentists, nor did it include a measure of how active dentists were in the
Medicaid/CHIP program. The following analysis provides more nuanced detail to support policy proposals
geared toward improving dental care utilization among North Carolina’s Medicaid population.

Data and Methods

In March 2020, the North Carolina Medicaid program provided a file detailing dental care utilization among
Medicaid-enrolled children and adults in North Carolina by census tract. It also provided a list of Medicaid-
participating dentists. All files reflect calendar year (CY) 2018 data. In our analysis, we excluded dentists and
offices located outside the state of North Carolina.

The beneficiary file provided by the North Carolina Medicaid program was based on 2018 claims data and
included the total number of Medicaid-enrolled children ages 1-20 and adults ages 21-64 by census tract.
Enrollees are defined as those enrolled in Medicaid or Health Choice for at least 180 continuous days in
CY2018. The file breaks down the total number of enrollees by those that had an office-based dental visit in the
past 12 months and those that did not.

Out of 2,285 dentists listed in the pediatric provider file provided by North Carolina Medicaid program, there
were 1,522 meaningful providers. 22 In the adult Medicaid provider file, out of 2,160 dentists listed, 988 were
meaningful providers. Dentists are considered meaningful Medicaid providers if they were reimbursed at least
$10,000 for Medicaid dental services or treated at least 100 unique Medicaid enrollees during CY2018. HPI
solicited feedback from several subject matter experts and these criteria were cited by several as “rules of
thumb” when defining a meaningful Medicaid provider. HPI also used this definition of a meaningful provider in a
similar analysis conducted for the Virginia Medicaid program.

21 American Dental Association. Geographic Access to Dental Care: North Carolina. Health Policy Institute Infographic. May

2017. Available from: https://www.ada.org/~/media/ADA/Science%20and%20Research/HPI/AccesstoDentalCare-
StateFacts/North-Carolina-Access-To-Dental-Care.pdf. Accessed June 18, 2020.
22 The number of dental providers in North Carolina used in this report vary from previously published HPI sources, likely due

to discrepancies between Insure Kids Now data and North Carolina DHHS Medicaid administrative data.

North Carolina DHHS Report – ADA Health Policy Institute                                                                 13
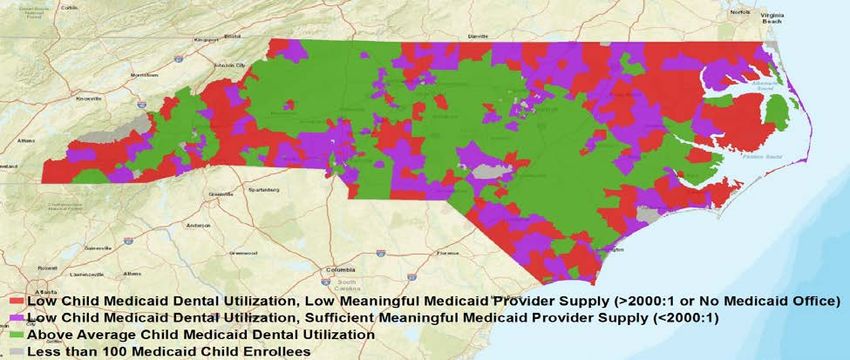
Overall, the adult provider file included 1,365 unique office locations of which 704 had a meaningful provider.
The child provider file included 1,437 office locations of which 992 had a meaningful provider. For mapping
purposes, we mapped office locations with meaningful providers.

We analyzed dental care utilization rates among Medicaid enrollees and compared this to the supply of
meaningful Medicaid providers. We conducted separate analysis for child enrollees and providers and adult
enrollees and providers. For each census tract, we calculated the dental care utilization rate defined as the
number of enrollees that used dental services at least once during CY2018 rendered by or under the
supervision of a dentist in a non-emergency department setting divided by the number of individuals enrolled in
Medicaid or Health Choice for at least 180 continuous days in CY2018. We limited our analysis to those census
tracks with at least 100 unique Medicaid enrollees.

To calculate the supply of meaningful dental providers at the census tract level, we used the 2-stage floating
area catchment method (2SFCA) using a 15-minute travel time threshold. 23 Travel times were calculated using
the ArcGIS network analyst toolbox in ArcMAP 10.8. Using the 2SFCA method, we calculated the ratio of adult
Medicaid enrollees to meaningful adult Medicaid providers and the ratio of child Medicaid enrollees to
meaningful pediatric Medicaid providers. These ratios measure the supply of meaningful Medicaid providers for
children and adults.

We created maps to illustrate supply of meaningful Medicaid providers and dental care utilization. There are two
categories of supply of meaningful Medicaid providers: low and sufficient. Low supply of meaningful Medicaid
providers indicated there was no Medicaid office within a 15-minute travel time or where the ratio of Medicaid
enrollees to meaningful Medicaid dentists was over 2000 to 1. Sufficient supply of meaningful Medicaid dentists
indicated there was a Medicaid office within a 15-minute travel time and the ratio of Medicaid enrollees to
meaningful Medicaid dentists was below 2000 to 1. These cutoffs were chosen based on HPI’s methodology to
assess geographic access to care. Separate maps were created for children and adults.

We analyzed utilization using the state’s average adult and child utilization rate for 2018 (58.9 percent for
children, 18.7 percent for adults).

The census tracts are broken into three categories: red, purple and green. Red represents census tracts where
the Medicaid utilization rate is below the state average (58.9 percent for children, 18.7 percent for adults) and
there is an insufficient supply of meaningful Medicaid providers. Purple represents census tracts where the
Medicaid utilization rate is below the state average and there is a sufficient supply of meaningful Medicaid
providers. Green represents census tracts where the utilization rate is above the state average regardless of the
supply of meaningful Medicaid providers.

23 Nasseh K, Eisenberg Y, Vujicic M. Geographic access to dental care varies in Missouri and Wisconsin. J Pub Health Dent.

2017;77(3):197-206.

North Carolina DHHS Report – ADA Health Policy Institute                                                             14
Limitations

This analysis is limited to claims data. We were unable to ascertain whether dentists, regardless of whether they
met the meaningful provider definition, had open chair time during which they could have accommodated
additional Medicaid enrollees. Additionally, we could only attribute Medicaid spending to office locations. We
could not account for services rendered by mobile units or other types of community-based practices. Finally,
we were unable to measure other barriers to care experienced by Medicaid enrollees. We hope to address
some of these limitations in future research.

Results

Based on 2015 data, 90 percent of Medicaid/CHIP-insured children in North Carolina reside within 15 minutes of
a Medicaid/CHIP-participating dentist (Table 1). 24 Dental care utilization among Medicaid-enrolled children in
North Carolina is higher than the national utilization rate among Medicaid/CHIP-enrolled children. In much of the
central part of the state, dental care use among Medicaid-enrolled children is above the state average (Figure
1). Among Medicaid-enrolled adults in North Carolina, dental care utilization is at 18.7 percent, below the
national average for publicly insured adults (23.2 percent). 25 Utilization among adults is very low in the
mountain-west portion of the state and along the eastern Atlantic coast (Figure 2).

      Table 1: Distribution of Population According to Population per Dentist Ratio and 15-Minute Travel Time

       Medicaid or CHIP-Insured Children per Medicaid or
                                                                                     Population per Dentist
                   CHIP-Participating Dentist

      5,000                                 23%

      No Medicaid dentist within 15-                                No dentist within 15-minute travel
                                           10%                                                             6%
      minute travel time                                            time
     Source: ADA Health Policy Institute. Geographic Access to Dental Care: North Carolina. May 2017 Infographic. Available from:
     https://www.ada.org/~/media/ADA/Science%20and%20Research/HPI/AccesstoDentalCare-StateFacts/North-Carolina-Access-To-
     Dental-Care.pdf. Accessed June 18, 2020.

For children and adults, meaningful providers are clustered in the major metropolitan areas (Charlotte, Raleigh-
Durham, Winston-Salem and Wilmington). There are fewer meaningful provider locations in the mountain-west
region, south-central region, and in the eastern Atlantic coast (Figures 3 and 4). About one-fifth of Medicaid-

24American Dental Association. Geographic Access to Dental Care: North Carolina. Health Policy Institute Infographic. May
2017. Available from: https://www.ada.org/~/media/ADA/Science%20and%20Research/HPI/AccesstoDentalCare-
StateFacts/North-Carolina-Access-To-Dental-Care.pdf. Accessed June 18, 2020.
25 Medical Expenditure Panel Survey. MEPS HC-201: 2017 Full Year Consolidated Data File. 2019. Available from:
https://www.meps.ahrq.gov/mepsweb/data_stats/download_data_files_detail.jsp?cboPufNumber=HC-201. Accessed June
18, 2020.

North Carolina DHHS Report – ADA Health Policy Institute                                                                       15
enrolled children and one-fifth of Medicaid-enrolled adults live in areas where the enrollee-to-meaningful provider ratio within a 15-minute travel time is less than 500 to 1 (i.e., there is a sufficient supply of Medicaid providers). About one in ten Medicaid-enrolled children and one in ten Medicaid-enrolled adults live in areas where there are no meaningful Medicaid providers at all practicing within a 15-minute travel time (Tables 2 and 3). There are several areas of North Carolina where there are no dentists participating in the Medicaid program within a 15-minute travel time of enrollees (Figures 5 and 6). Some of these areas may not have any dentists at all. Several studies have shown that travelling to a dentist’s office can present major challenges for families, particularly low-income families. 26,27 In fact, inconvenient office location and trouble finding a dentist are listed as significant reasons cited by low-income North Carolinians for not visiting the dentist more often. 28 In terms of utilization versus meaningful Medicaid provider supply by census tract (mapped in Figures 7 and 8), 57.4 percent of Medicaid-enrolled children reside in areas where utilization is above the state average (58.9 percent) while 10.6 percent live in census tracts where utilization is below the state average and there is an insufficient supply of meaningful dental providers (Table 4). Adult dental care use is above the state average (18.7 percent) in the central part of the state and the I-95 corridor. About 54.2 percent of Medicaid-enrolled adults reside in areas where utilization is above the state average while 11.2 percent of Medicaid-enrolled adults live in census tracts where utilization is below the state average and there is an insufficient supply of meaningful adult dental providers (Table 5). The percentage of meaningful dental providers drops off significantly in areas where Medicaid dental care utilization among children is below the state average and there is an insufficient supply of Medicaid dental providers. In areas where Medicaid dental care utilization is below the state average and there is an insufficient supply of Medicaid dental providers for children, only 13.7 percent of dentists are meaningful Medicaid providers (Table 6). The case is similar for Medicaid-enrolled adults. In areas where Medicaid dental care utilization is below the state average and there is an insufficient supply of Medicaid dental providers, only 3.5 percent of dentists are meaningful Medicaid providers (Table 7). 26 Dodd V, Logan H, Brown C, Calderon A, Catalanotto F. Perception of oral health, preventive care, and care-seeking behaviors among rural adolescents. J Sch Health. 2014;84(12): 802-809. 27Kelly S, Binkley C, Neace W, Gale B. Barriers to care-seeking for children’s oral health among low-income caregivers. Am J Public Health. 2005;95(8): 1345-1351. 28 Health Policy Institute. Oral health and well-being in North Carolina. Infographic. 2015. Available from: https://www.ada.org/en/science-research/health-policy-institute/oral-health-and-well-being/North-Carolina-facts. Accessed June 23, 2020. North Carolina DHHS Report – ADA Health Policy Institute 16
Figure 1: Dental Care Utilization among Medicaid-Enrolled Children by Census Tract, 2018

   Source: ADA Health Policy Institute analysis of child Medicaid utilization and enrollment data from the North Carolina Medicaid
   program for CY2018. Notes: Census tracts with fewer than 100 Medicaid-enrolled children were not included.

             Figure 2: Dental Care Utilization among Medicaid-Enrolled Adults by Census Tract, 2018

   Source: ADA Health Policy Institute analysis of adult Medicaid utilization and enrollment data from the North Carolina Medicaid
   program for CY2018. Notes: Census tracts with fewer than 100 Medicaid-enrolled adults were not included.

North Carolina DHHS Report – ADA Health Policy Institute                                                                        17
Figure 2: Meaningful Pediatric Medicaid Dental Office Locations, 2018
Source: ADA Health Policy Institute analysis of provider data from the North Carolina Medicaid Program for CY2018. Notes: Pediatric
means any dental provider that treats Medicaid-enrolled children. Meaningful providers are defined as those who were reimbursed at
least $10,000 for Medicaid dental services or treated at least 100 unique Medicaid enrollees during CY2018.
Figure 4: Meaningful Adult Medicaid Dental Office Locations, 2018
Source: ADA Health Policy Institute analysis of provider data from the North Carolina Medicaid Program for CY2018. Note: Meaningful
providers are defined as those who were reimbursed at least $10,000 for Medicaid dental services or treated at least 100 unique
Medicaid enrollees during CY2018.
North Carolina DHHS Report – ADA Health Policy Institute 18Figure 5: Medicaid-Enrolled Children per Meaningful Child Medicaid Providers within a 15-Minute Travel Time,
2018
Source: ADA Health Policy Institute analysis of child Medicaid utilization, enrollment and provider data from the North Carolina
Medicaid Program for CY2018. Note: Meaningful providers are defined as those who were reimbursed at least $10,000 for Medicaid
dental services or treated at least 100 unique Medicaid enrollees during CY2018.
Figure 6: Medicaid-Enrolled Adults per Meaningful Adult Medicaid Providers within a 15-Minute Travel Time,
2018
Source: ADA Health Policy Institute analysis of adult Medicaid utilization, enrollment and provider data from the North Carolina
Medicaid Program for CY2018. Note: Meaningful providers are defined as those who were reimbursed at least $10,000 for Medicaid
dental services or treated at least 100 unique Medicaid enrollees during CY2018
North Carolina DHHS Report – ADA Health Policy Institute 19Figure 7: Supply and Demand for Medicaid Dental Services for Children by Census Tract, 2018
Source: ADA Health Policy Institute analysis of provider data from the North Carolina Medicaid Program for CY2018. Notes: Census
tracts with fewer than 100 Medicaid-enrolled children were not included. Meaningful providers are defined as those who were
reimbursed at least $10,000 for Medicaid dental services or treated at least 100 unique Medicaid enrollees during CY2018
Figure 8: Supply and Demand for Medicaid Dental Services for Adults by Census Tract, 2018
Source: ADA Health Policy Institute analysis of provider data from the North Carolina Medicaid Program for CY2018. Notes: Census
tracts with fewer than 100 Medicaid-enrolled children were not included. Meaningful providers are defined as those who were
reimbursed at least $10,000 for Medicaid dental services or treated at least 100 unique Medicaid enrollees during CY2018
North Carolina DHHS Report – ADA Health Policy Institute 20Table 2: Percent of Medicaid-Enrolled Children Residing within a 15-Minute Travel Time to a Meaningful Child
Medicaid Provider, by Enrollee-to-Meaningful Provider Ratio, 2018
Enrollee-to-Meaningful Provider Ratio Percent
2000:1 12.3%
No Meaningful Medicaid Office 9.5%
Source: ADA Health Policy Institute analysis of child Medicaid utilization, enrollment and provider data from the North Carolina
Medicaid Program for CY2018 Notes: Percentages may not add up to 100% due to rounding. Meaningful providers are defined as
those who were reimbursed at least $10,000 for Medicaid dental services or treated at least 100 unique Medicaid enrollees during
CY2018.
Table 3: Percent of Medicaid-Enrolled Adults Residing within a 15-Minute Travel Time to a Meaningful Medicaid
Adult Provider, by Enrollee-to-Meaningful Provider Ratio, 2018
Enrollee-to-Meaningful Provider Ratio Percent
2000:1 10.6%
No Meaningful Medicaid Office 12.2%
Source: ADA Health Policy Institute analysis of child Medicaid utilization, enrollment and provider data from the North Carolina
Medicaid Program for CY2018 Notes: Percentages may not add up to 100% due to rounding. Meaningful providers are defined as
those who were reimbursed at least $10,000 for Medicaid dental services or treated at least 100 unique Medicaid enrollees during
CY2018.
Table 4: Percent of Medicaid-Enrolled Children Residing In Areas of Different Dental Demand and Meaningful
Provider Supply, 2018
Demand and Supply for Dental Services Percent
Less than 100 Medicaid Enrollees (Gray Areas) 0.2%
Above Average Dental Care Utilization (Green Areas) 57.4%
Children
Utilization Below the State Average, Sufficient Provider Supply
31.8%
(Purple Areas)
Utilization Below the State Average, Insufficient Provider Supply
10.6%
(Red Areas)
Source: ADA Health Policy Institute analysis of child Medicaid utilization, enrollment and provider data from the North Carolina
Medicaid Program for calendar year 2018. Notes: Meaningful providers are defined as those who were reimbursed at least $10,000
for Medicaid dental services or treated at least 100 unique Medicaid enrollees during CY2018
North Carolina DHHS Report – ADA Health Policy Institute 21Table 5: Percent of Medicaid-Enrolled Adults Residing In Areas of Different Dental Demand and Meaningful
Provider Supply, 2018
Demand and Supply for Dental Services Percent
Less than 100 Medicaid Enrollees (Gray Areas) 1.0%
Above Average Dental Care Utilization (Green Areas) 54.2%
Adults
Utilization Below the State Average, Sufficient Provider Supply
33.6%
(Purple Areas)
Utilization Below the State Average, Insufficient Provider Supply
11.2%
(Red Areas)
Source: ADA Health Policy Institute analysis of child Medicaid utilization, enrollment and provider data from the North Carolina
Medicaid Program for CY2018. Notes: Meaningful providers are defined as those who were reimbursed at least $10,000 for Medicaid
dental services or treated at least 100 unique Medicaid enrollees during CY2018.
Table 6: Distribution of Child Dental Providers by Regions with Different Levels of Demand and Supply for
Medicaid Dental Services
Non-
Meaningful
Demand and Supply for Meaningful Non-Medicaid Total
Medicaid
Dental Services Medicaid Dentists Dentists
Dentists
Dentists
Less than 100 Medicaid 13 (3.9%) 330 (100%)
18 (5.5%) 299 (90.6%)
Enrollees (Gray Areas)
Above Average Dental Care 981 (24.2%) 670 (16.5%) 2401 (59.3%) 4052 (100%)
Utilization (Green Areas)
Children
Utilization Below the State
Average, Sufficient Provider 796 (21.6%) 534 (14.5%) 2361 (64.0%) 3691 (100%)
Supply (Purple Areas)
Utilization Below the State
Average, Insufficient 32 (13.7%) 39 (16.7%) 162 (69.5%) 233 (100%)
Provider Supply (Red
Areas)
Source: ADA Health Policy Institute analysis of child Medicaid utilization, enrollment and provider data from the North Carolina Medicaid
Program for CY2018. Notes: Row percentages in parentheses. A dentist is considered a meaningful Medicaid provider if they were
reimbursed at least $10,000 for Medicaid dental services or treated at least 100 unique Medicaid enrollees during CY2018. Non-
meaningful Medicaid dentists are listed in the North Carolina dentist directory but do not meet the threshold of a meaningful provider.
The number of non-Medicaid dentists are generated by subtracting the total number of dentists in a census tract from the 2019 ADA
office database by the total number of Medicaid providers (meaningful and non-meaningful) from the North Carolina Medicaid provider
directory. Because dentists may practice in multiple census tracts, the "Total Dentists" column contains some double counting of
dentists.
North Carolina DHHS Report – ADA Health Policy Institute 22Table 7: Distribution of Adult Dental Providers by Regions with Different Levels of Demand and Supply for
Medicaid Dental Services
Non-
Meaningful
Demand and Supply for Meaningful Non-Medicaid Total
Medicaid
Dental Services Medicaid Dentists Dentists
Dentists
Dentists
Less than 100 Medicaid 38 (6.2%) 546 (89.5%) 610 (100%)
26 (4.3%)
Enrollees (Gray Areas)
Above Average Dental Care 697 (17.6%) 931 (23.5%) 2333 (58.9%) 3961 (100%)
Utilization (Green Areas)
Adults
Utilization Below the State
Average, Sufficient Provider 360 (10.7%) 588 (17.5%) 2414 (71.8%) 3362 (100%)
Supply (Purple Areas)
Utilization Below the State
Average, Insufficient 13 (3.5%) 54 (14.5%) 306 (82.0%) 373 (100%)
Provider Supply (Red
Areas)
Source: ADA Health Policy Institute analysis of child Medicaid utilization, enrollment and provider data from the North Carolina
Medicaid Program for CY2018. Notes: Row percentages in parentheses. A dentist is considered a meaningful Medicaid provider if
they were reimbursed at least $10,000 for Medicaid dental services or treated at least 100 unique Medicaid enrollees during CY2018.
Non-meaningful Medicaid dentists are listed in the North Carolina dentist directory but do not meet the threshold of a meaningful
provider. The number of Non-Medicaid dentists are generated by subtracting the total number of dentists in a census tract from the
2019 ADA office database by the total number of Medicaid providers (meaningful and non-meaningful) from the North Carolina
Medicaid provider directory. Because dentists may practice in multiple census tracts, the "Total Dentists" column contains some double
counting of dentists.
North Carolina DHHS Report – ADA Health Policy Institute 23Assessing Appointment Availability for Medicaid Enrollees To further analyze dental care accessibility in North Carolina, HPI conducted an audit of North Carolina dental offices to determine how patient dental insurance type, age, race/ethnicity, and dental practice geographic location determined whether patients could successfully secure dental appointments. These results provide insight as to what obstacles Medicaid patients may face when trying to secure an appointment with a North Carolina dentist. Data and Methods Mystery Shopper Survey Methodology To analyze access to dental care among North Carolina Medicaid enrollees, we conducted a mystery shopper survey with the University of Chicago Survey Lab (SL). SL performed an audit of all dental offices in North Carolina where at least one general practitioner dentist or pediatric dentist was enrolled with the North Carolina Medicaid program. SL developed the survey script in partnership with HPI, tested the survey, screened the survey with a sample of dental offices, completed the full audit, and provided a list limited to the survey criteria. To determine which offices to call, we obtained the most updated list of Medicaid-participating dental providers from the North Carolina Department of Health and Human Services on March 16, 2020. The list contained 2,915 participating dentist-office pairs in North Carolina. HPI limited this list by excluding every dentist-office pair that did not involve a general practitioner or pediatric dentist. We then deleted duplicate dental office addresses. The analysis was done at the office level, so we were comfortable with some offices having multiple dental providers that could see Medicaid-enrolled pediatric patients. We then checked every address and telephone number via an internet search to ensure that (a) the office was still in business, (b) the office provided preventive and diagnostic services, rather than specialty services such as orthodontia or oral surgery only, and (c) that the address and telephone number appeared to be correct. After these exclusions, 1,138 dental offices remained on the list to be contacted for the mystery shopper survey. A total of 2,276 cases were identified for audit, one for Medicaid and one for Delta Dental insurance for each office. The full audit was completed by a diverse team of four callers, hired by SL, to play roles for a range of simulated patients along pre-selected age, race/ethnicity and gender dimensions. The callers collectively portrayed female, white, Hispanic and African American vocal features across an age range of 30-40 years. Callers asked to schedule a dental appointment for their child or for themselves and recorded whether an appointment was secured, the wait time for the appointment, reasons an appointment was not secured (if those reasons were provided by office staff), and whether a referral was given if an appointment was not available at the office contacted. Each caller was assigned an even distribution of cases by dental benefit type (Medicaid or private insurance) and portrayed patient age (child or adult) to control for any effect personal or demographic North Carolina DHHS Report – ADA Health Policy Institute 24
traits might have on his or her ability to obtain an appointment. The simulated patient calls for all cases were
made between July 2019 and September 2019.

Completed Cases

A case was “complete” when the caller was able to reach office staff to either schedule an appointment or be
told that no appointment was available. “No successful contact” indicates the number of cases for which calls
were attempted but office staff was never reached. “Ineligible” indicates cases for which someone was reached,
but general dental care was not offered at the office location on file, or the case was a duplicate in our list. Once
the audit was complete, SL reviewed the data for consistency and missing information, and the refined data was
sent to HPI for further analysis.

                                      Table 1: Mystery Shopper Survey Case Results

                 Final Status                                    Number             Percentage

                 Complete                                        2,040              89.6%

                 No Successful Contact                           174                7.6%

                 Ineligible                                      62                 2.7%

                 Total                                           2,276              100%

                         Table 2: Mystery Shopper Survey Cases Completed by Race/Ethnicity

                                                             Adult          Child               Total

                                    African American       220 (44.4%)    276 (55.7%)       496 (25.3%)

                                              Hispanic     72 (39.6%)     110 (60.4%)        182 (9.3%)

                                                 White     568 (44.2%)    718 (55.8%)       1,286 (65.5%)

Callers completed two cases (one for Medicaid and one for Delta Dental PPO) for 982 of the 1,138 dental
offices contacted. (For the other 156 dental offices, either no cases were completed or only one case was
completed.) Analyses included only the cases from these 982 offices. Dental offices in this analysis were
classified by categories of dental care utilization and supply of meaningful dental providers at the census tract
level as described in the previous section. Dentists were considered meaningful Medicaid providers if they were
reimbursed at least $10,000 for Medicaid dental services or treated at least 100 unique Medicaid enrollees
during calendar year 2018. Utilization was measured by North Carolina’s average adult and child utilization rate
for 2018 (58.9 percent for children, 18.7 percent for adults). Further, each completed case was placed into one

North Carolina DHHS Report – ADA Health Policy Institute                                                         25
of the classifications outlined in the previous section in terms of availability of Medicaid providers and dental
care utilization.
Table 3: Completed Cases by Availability of Meaningful Medicaid Providers and Utilization Rate for Dental Care
Services Classification Based on Analysis in Previous Section
Adult Child Total
262 287
Green (above average utilization, sufficient supply of providers) 549 (55.9%)
(47.7%) (52.3%)
148 237
Purple (below average utilization, sufficient supply of providers) 385 (39.2%)
(38.4%) (61.6%)
Red (below average utilization, low supply of providers) 12 (30.8%) 27 (69.2%) 39 (4.0%)
Grey (too few Medicaid enrollees to map) 8 (88.9%) 1 (11.1%) 9 (0.9%)
Notes: Low supply of meaningful Medicaid providers indicated there was no Medicaid office within a 15-minute travel time or where
the ratio of Medicaid-enrolled children to meaningful Medicaid dentists was over 2000 to 1. Sufficient supply of meaningful Medicaid
dentists indicated there was a Medicaid office within a 15-minute travel time and the ratio of Medicaid-enrolled children to meaningful
Medicaid dentists was below 2000 to 1.
Dental offices were further classified by rural-urban commuting area codes (RUCA). 29 RUCA codes classify U.S.
census tracts using measures of population density, urbanization, and daily commuting. We have grouped them
into four categories to identify urban areas, large city/town, small rural town, and isolated rural town so that we
can look at the type of area in which callers from our study were better able to schedule appointments, for
example. Urban areas are more densely populated which could mean more competition in terms of being able
to make an appointment.
Table 4: Number of Offices by RUCA Classification
Adult Child Total
Isolated Small Town 12 (42.9%) 16 (57.1%) 28 (2.9%)
Large Rural City/Town 84 (52.2%) 77 (47.8%) 161 (16.4%)
Small Rural Town 20 (35.7%) 36 (64.3%) 56 (5.7%)
314
Urban 423 (57.4%) 737 (75.1%)
(42.6%)
Notes: We defined "large rural city/town" to include RUCA codes 4.0, 5.0, and 6.0. (The majority
are 4.0.) 4.0 - Micropolitan area core: primary flow within an urban cluster of 10,000 to 49,999 (large
UC). Lumberton, Asheboro, Beaufort are examples of 4.0. 5.0 - Micropolitan high commuting:
primary flow 30% or more to a large UC. Henderson, Wilkesboro, Pinehurst are examples of 5.0.
6.0 - Micropolitan low commuting: primary flow 10% to 30% to a large UC. Snow Hill, Robbins,
Biscoe are examples of 6.0.
29 Economic Research Service, United States Department of Agriculture. Documentation: 2010 Rural-Urban Commuting
Area (RUCA) Codes. Available from: https://www.ers.usda.gov/data-products/rural-urban-commuting-area-
codes/documentation/. Accessed October 15, 2019.
North Carolina DHHS Report – ADA Health Policy Institute 26You can also read