AN ANALYSIS OF SARS-COV-2 VIRAL LOAD BY PATIENT AGE
←
→
Page content transcription
If your browser does not render page correctly, please read the page content below
An analysis of SARS-CoV-2 viral load by patient age Terry C. Jones1,2, Barbara Mühlemann1,3, Talitha Veith1,3, Marta Zuchowski4, Jörg Hofmann4, Angela Stein4, Anke Edelmann4, Victor Max Corman1,3, Christian Drosten1,3 Affiliations: 1: Institute of Virology, Charité-Universitätsmedizin Berlin, corporate member of Freie Universität Berlin, Humboldt-Universität zu Berlin, and Berlin Institute of Health, 10117 Berlin, Germany 2: Center for Pathogen Evolution, Department of Zoology, University of Cambridge, Downing St., Cambridge, CB2 3EJ, U.K. 3: German Centre for Infection Research (DZIF), partner site Charité, 10117 Berlin, Germany 4: Labor Berlin - Charité Vivantes GmbH, Sylter Straße 2, 13353 Berlin, Germany Address for correspondence: Professor Christian Drosten Charité - Universitätsmedizin Berlin Campus Charité Mitte Chariteplatz 1 D-10117 Berlin Germany E-Mail: christian.drosten@charite.de Abstract Data on viral load, as estimated by real-time RT-PCR threshold cycle values from 3,712 COVID-19 patients were analysed to examine the relationship between patient age and SARS-CoV-2 viral load. Analysis of variance of viral loads in patients of different age categories found no significant difference between any pair of age categories including children. In particular, these data indicate that viral loads in the very young do not differ significantly from those of adults. Based on these results, we have to caution against an unlimited re-opening of schools and kindergartens in the present situation. Children may be as infectious as adults. Introduction The present measures to curb the spread of SARS-CoV-2 by non-pharmaceutical interventions are beginning to show effects in many countries. Along with the gradual lifting of measures of physical distancing, there is a growing discussion regarding the contribution of school- and kindergarten closures to the reduction of transmission rate (1) and to the expected rebound upon reopening. Studies to determine the contribution of children as sources of infection are complicated by the fact that non-pharmaceutical interventions including school- and
kindergarten closures were in place before observational trials could begin. A household study
in China and observations in a limited number of contact investigations in Germany suggest that
children are infected by SARS-CoV-2 at a rate that may not be different from that of adults (2,
3) . However, the extent to which children can act as sources of infection remains unclear. A
challenge when trying to address this question by epidemiological observation is posed by the
present situation of physical distancing. Because kindergartens and schools are closed, it
becomes less likely that children become index cases in households. During the early phase of
the SARS-CoV-2 epidemic in many European countries, the seeding of cases by adult-aged
travelers who visited early epidemic foci was an additional reason why children were
under-represented in age-related incidence (4). It is therefore unlikely that epidemiological
investigations undertaken under the present conditions can identify the actual risk of acquisition
of infection from children by subjects of any age group.
An alternative way to achieve a correlate of infectivity is to directly analyze the virus
concentration in the respiratory tract. We have previously shown that viral loads under a
concentration of ca. 106 copies per mL of sputum or per entire throat swab are unlikely to yield
) . We also found that virus could not be isolated from
infectious virus growth in cell culture (5
respiratory samples after the first week of symptoms, which is highly concordant with
transmission analyses based on actual transmission pairs, suggesting that infectivity ends by
the end of the first week of symptoms (6). To enable an estimate of infectivity in children, we
analyzed viral loads observed during routine testing at a large laboratory testing centre in Berlin
(Charité Institute of Virology and Labor Berlin). Charité Institute of Virology was the first
laboratory qualified to test for SARS-CoV-2 in Germany and until early February 2020 was the
only SARS-CoV-2 testing facility in Berlin, a city of ca. 3.8 million inhabitants. Labor Berlin is a
large medical laboratory services provider in Berlin, owned by the senate of Berlin and serving
Charité as well as other large hospitals in Berlin and beyond. Labor Berlin serves public testing
centres that mainly see adult outpatients. It also tests out- and inpatients from several hospitals,
and serves practitioners and public health agencies submitting samples taken during
household-based contact tracing.
Results
From January to 26th April, 2020, virology laboratories at Charité and Labor Berlin screened
59,831 patients for COVID-19 infection, 3,712 (6.2%) with a positive real-time RT-PCR result.
We divided patients according to two categorizations to investigate whether there is a
relationship between patient age and viral load. The first categorization is based on ten-year
brackets, ages 1-10, 11-20, 21-30, 31-40, 41-50, 51-60, 61-70, 71-80, 81-90, and 91-100. The
second categorization is based on broad social strata: kindergarten (ages 0-6), grade school
(ages 7-11), high school (ages 12-19), university (ages 20-25), adult (26-45 years), and mature
(age over 45). Patient counts in each age group, and number and percentage of PCR positive
patients are shown in Table 1. A comparison of age stratification in tested cases versus the
Berlin population is shown in Figure A1. Of note, whereas younger age groups have lower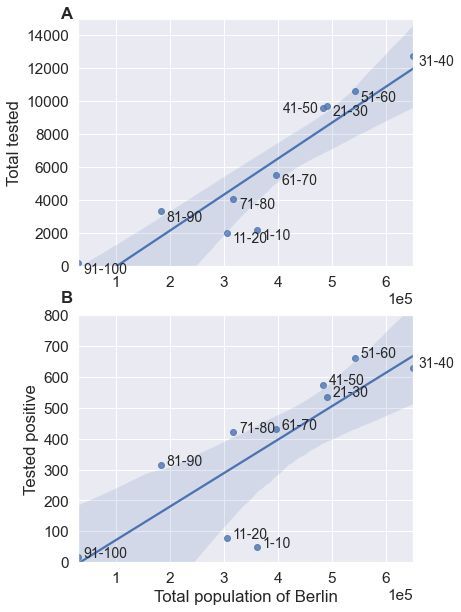
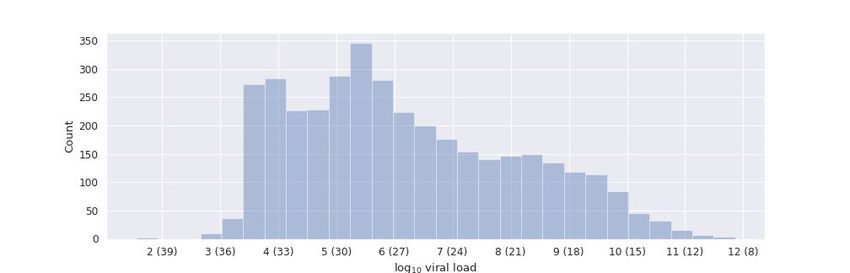
detection rates (Table 1), this does not imply an age-based estimate of infection prevalence because of mostly symptoms-directed testing. Due to the small sample sizes in the pediatric age groups, we examined diagnostic indications for 47 cases (1-11 years of age) for whom this information was available. Fifteen cases had indications pointing toward underlying disease or hospitalization. Average viral loads in these cases were lower than in children tested in outpatient departments, practices, or households (Figure A2). This corresponds to the observation that hospitalization occurs after some days of symptoms, a time when viral loads in throat swabs are beginning to decline (5). Viral load The distribution of observed viral loads in a total of 3,712 cases are shown in Figure 1. The viral loads are not normally distributed but are skewed towards a mean (logarithm base 10) value of 5.19 (i.e., 105.19 viral copies) per sample, with a median of 4.80, corresponding to threshold cycle (Ct) values of 30.01 and 31.23, respectively. The sharp drop on the left side of the distribution is due to the assay sensitivity limit. The viral load projection derived in our study is semi-quantitative, and projects viral load per mL of sputum or per entire swab sample, while only a fraction of the volume of both types of sample can actually reach the test tube. Also, quantification is based on a standard preparation tested once in multiple diluted replicates to generate a standard curve and derive a formula upon which Ct values are transformed into viral loads. This approach does not reflect inter-run variability or the variability between different RT-PCR setups and chemistries. However, these variabilities apply to all age groups and do not affect the interpretation of data for the purpose of the present study. Analysis of variation in viral load between age groups Viral loads are plotted according to categorization in Figure 2 with per-group descriptive statistics shown in Table 2. Two key prior conditions for an analysis of variance are a) that the dependent variable is approximately normally distributed within each category and b) that the variance within each category is approximately equal. A Shapiro test for normal distribution in the first categorization (C1) has a value of 0.96 (p value 2.71-31), and in the second categorization (C2) a value of 0.96 (p value 8.56-32) (Table A1), strongly indicating that the log10 viral load numbers in both categories are not normally distributed, as is clear from Figures A3 and A4. Regarding equality of variance, Levene’s statistic (7) (using median values) in categorization C1 has value 1.80 (p value 0.063) while in categorization C2, the same statistic has value 2.30 (p value 0.042) (Table A2). Thus in C2 there is evidence that the viral load variance between the categories cannot be considered approximately equal. Given these results, we used the non-parametric Kruskal-Wallis H test (8) , since it does not have pre-conditions of normality or equality of variance. The Kruskal-Wallis H statistic had value 22.39 (p value 0.008) for C1 and 14.97 (p value 0.011) for C2 (Table A3). Although the significant Kruskal-Wallis test indicates at least one significant pairwise difference exists between subgroups in both categorizations, due care must be exercised in the post hoc interpretation due to the influence of highly skewed distributions.
We performed pairwise post hoc analyses on both categorizations using three methods: the Tukey honestly significant difference (HSD) test (9) (Table A4), Bonferroni-adjusted pairwise T-test (10) (Table A5), and Dunn’s test (Table A6) (11). For categorization C1, none of the three post hoc methods indicated a significant difference between any pair of the ten subgroups. For categorization C2 the situation was identical, apart from Dunn’s test indicating a difference (p value 0.045) between the very youngest (kindergarten) and very oldest (Mature) subgroups. Thus the overwhelming conclusion from the three post hoc testing methods is that no significant differences in viral load exists between any subgroups in either categorization. Discussion Because of difficulties in conducting observational trials to investigate the infectivity of children as opposed to other age groups with SARS-CoV-2 infection, in this short study we attempt the provision of a direct measure of virus concentration from which one can extrapolate to infectivity. Whereas the attack rate in children seems to correspond to that in adults (2) , it is obvious that children are under-represented in clinical studies and less frequently diagnosed due to mild or absent symptoms. For instance, a recent systematic review identified only 1,065 pediatric SARS-CoV-2 cases in the medical literature as of April 2020 (12) . An estimate based on the number of symptomatic admissions in a specialist pediatric hospital assumes that thousands of pediatric cases were missed during the early phase of the Wuhan outbreak, at a time at which only ca. 10,0000 adult patients were registered (13) . Because they are mostly asymptomatic, children may not be presented at testing centers even if they belong to households with a confirmed index case. There are many other factors that complicate the determination of infection rates in, and transmission rates from children. For instance, the age profile during the early phase of the outbreak in many European countries makes it difficult to derive transmission rates from household contact studies. Early transmission clusters were started by travellers of adult age, making children less likely to be index cases in households (4) . Another circumstance making children less likely to carry the virus into households is that kindergartens and schools were closed early in the outbreak in Germany. These combined effects will cause children to be more likely to receive rather than spread infections in households for purely circumstantial reasons. This observation may be misunderstood as an indication of children being less infectious. The determination of viral loads seems to provide an interesting means to achieve an indirect but robust estimate of infectivity in the present epidemiological circumstances. The correlation of RNA-based viral load in the respiratory tract with infectivity, as measured in cell culture, has been established (5 , 14) . In our study, the virus detection rate increased steadily with age of patients tested. As testing was predominantly directed by symptoms, this suggests that children with respiratory symptoms and fever are less likely than adults to suffer from acute SARS-CoV-2 infection. Many other respiratory viruses cause symptomatic disease in children, but less so in adults where endemic respiratory viruses often present as mild upper respiratory tract infection without fever. Our
results should clearly not be taken as an indicator of age-specific prevalence in Germany. Rather, the low rate of SARS-CoV-2 detection in the tested children suggests that symptoms are not a good predictor of infection. At the same time, the absence of symptoms does not imply absence of virus excretion. In a study of people living in the Italian village of Vó, in which ca. 80% of the population were tested by RT-PCR twice within two weeks, about half the population were found to be asymptomatically infected, showing no symptoms over the observation period of two weeks, while viral loads were equivalent in symptomatic and asymptomatic patients (15). It is a limitation that we have not generally discriminated the studied patients into sub-cohorts based on symptomatic status, underlying diseases, or other indications for diagnostic test application. At least for the children in the present study, we can say that hospitalized children with underlying disease were not found to have higher viral loads than children without known underlying disease tested in outpatient departments, practices, or households. The latter would represent children attending schools and kindergartens. The viral loads observed in the present study, combined with earlier findings of similar attack rate between children and adults (2 ) , suggest that transmission potential in schools and kindergartens should be evaluated using the same assumptions of infectivity as for adults. There are reasons to argue against the notion of adult-like infectivity in children, such as the fact that asymptomatic children do not spread the virus by coughing, and have smaller exhaled air volume than adults. However, there are other arguments that speak in favour of transmission, such as the greater physical activity and closer social engagement of children. We recommend collecting and evaluating more viral load data from testing laboratories to achieve more robust statistical assessments and independent confirmation of the present results. Based on the absence of any statistical evidence for a different viral load profile in children found in the present study, we have to caution against an unlimited re-opening of schools and kindergartens in the present situation, with a widely susceptible population and the necessity to keep transmission rates low via non-pharmaceutical interventions. Children may be as infectious as adults. Acknowledgements Work at Charité virology is funded by European Commission via project ReCoVer, the German Ministry of Research and Education via Deutsches Zentrum für Infektionsforschung, and the German Ministry of Health via the Konsiliarlabor für Coronaviren.
Categorization C1 Categorization C2
Group Count Positive % Positive Group Count Positive % Positive
1-10 2,181 49 2.25 KG 1,759 37 2.10
11-20 1,991 78 3.92 GS 623 16 2.57
21-30 9,710 536 5.52 HS 1,790 74 4.13
31-40 12,737 630 4.95 Uni 4,587 267 5.82
41-50 9,572 575 6.01 Adult 23,665 1,247 5.27
51-60 10,586 662 6.25 Mature 27,407 2,071 7.56
61-70 5,529 431 7.80
71-80 4,064 420 10.33
81-90 3,302 314 9.51
91-100 159 17 10.69
Table 1: Categorization breakdown and positive PCR counts and percentages. The ‘Count’
column in each categorization gives the total number of patients tested. ‘Positive’ indicates a
total number of positive RT-PCR results for the subgroup. KG: kindergarten; GS: grade school;
HS: high school; Uni: University.
A) Category C1 N Mean SD SE 95% Conf. Interval
1 49 4.637858 1.826493 0.260928 4.121141 5.154576
2 78 4.798684 1.790027 0.202681 4.398859 5.198509
3 536 5.261825 1.93962 0.083779 5.097465 5.426185
4 630 5.213623 2.020657 0.080505 5.055708 5.371538
5 575 4.985018 1.87101 0.078027 4.831953 5.138083
6 662 5.258317 1.905385 0.074055 5.11306 5.403575
7 431 5.278967 1.872932 0.090216 5.101938 5.455996
8 420 5.174407 1.78352 0.087027 5.003631 5.345183
9 314 5.344452 1.899481 0.107194 5.134016 5.55488710 17 5.609229 2.047993 0.496711 4.605712 6.612745 B) Category C2 N Mean SD SE 95% Conf. Interval Adult 1247 5.15923 1.970687 0.055806 5.049806 5.268655 GS 16 5.364652 2.214843 0.553711 4.243786 6.485517 HS 74 4.783514 1.776356 0.206497 4.376017 5.191012 KG 37 4.371295 1.601139 0.263226 3.848256 4.894334 Mature 2071 5.229369 1.867447 0.041035 5.148921 5.309818 Uni 267 5.283627 1.946236 0.119108 5.049738 5.517517 Table 2: Statistics describing the viral load distributions in C1 and C2. The mean, standard deviation (SD), standard error (SE), 95% Confidence Interval (95% Conf.), and the interval are shown for the base-10 logarithm of viral load for A) categorization C1 (by age class), and B) categorization C2 (by schooling/social). KG: kindergarten; GS: grade school; HS: high school; Uni: University. Figure 1: Histogram of viral loads: The plot shows the frequency distribution of 3,712 values of patient SARS-CoV-2 (logarithm base 10) viral load, estimated from real-time RT-PCR Ct values. The RT-PCR cycle corresponding to the logarithmic viral load is given in parentheses. The sharp drop on the left side of the distribution is due to RT-PCR sensitivity and the limit on cycles.
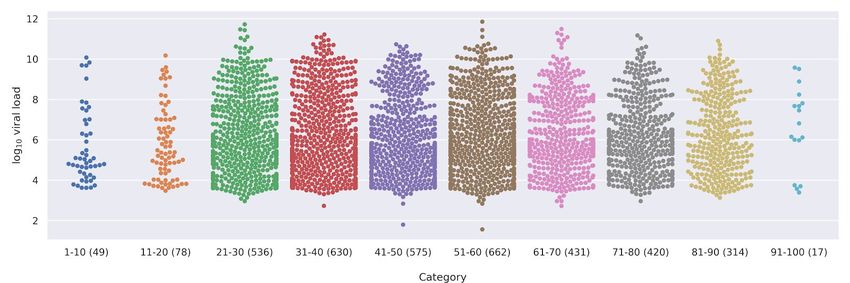
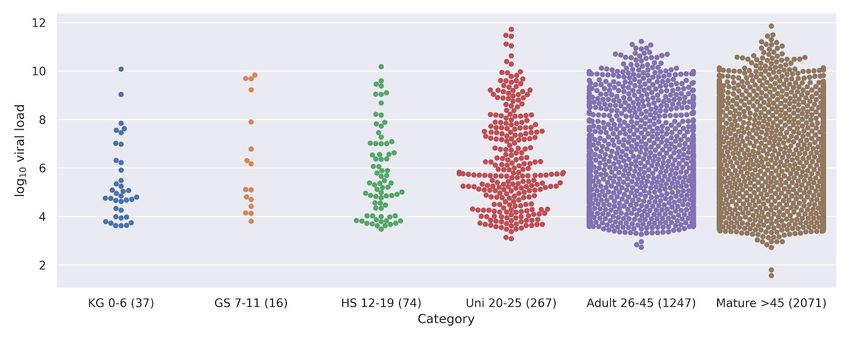
A B Figure 2: Viral load by patient category. A: categorization by 10-year age strata (C1): Patients were divided into categories based on age. The base 10 logarithm of viral load is estimated from the real-time PCR Ct value. Category counts are given in parentheses in the x-axis labels. B: Categorization by schooling/social (C2): Patients were divided into categories based schooling level, estimated on the basis of age. X-axis labels show the category (KG: kindergarten; GS: grade school; HS: high school; Uni: University), the age range in years, then the category count in parentheses. Methods Due to testing of some but not all positive cases by two RT-PCR targets, 3,712 of 59,831 (6.2%) patients had 5,285 positive results overall. In cases with more than one result, we selected the PCR result with the lowest Ct value. Results based on Light Cycler 480 PCR, as opposed to Roche 8800 or 6800, were chosen preferentially when results from more than one PCR system per patient was available (the latter systems were introduced in the laboratory during the observation period).
The following Python (version 3.8) software packages were used in the analysis and production
of images: Scipy (version 1.4.1) (16) , pandas (version 1.0.3) (17), researchpy (version
08/28/2018) (https://researchpy.readthedocs.io/en/latest/), statsmodels (version 0.11.1) (18),
matplotlib (version 3.2.1) (19), numpy (1.18.3) (20), and seaborn (version 0.10.1) (21).
Viral load is estimated from Ct value based on the empirical formula log10(8 * 1014 * e-0.745 * Ct).
The formula is derived from testing a standard curve.
References
1. N. M. Ferguson, D. Laydon, G. Nedjati-Gilani, N. Imai, K. Ainslie, M. Baguelin, S. Bhatia, A.
Boonyasiri, Z. Cucunubá, G. Cuomo-Dannenburg, A. Dighe, I. Dorigatti, H. Fu, K.
Gaythorpe, W. Green, A. Hamlet, W. Hinsley, L. C. Okell, S. van Elsland, H. Thompson, R.
Verity, E. Volz, H. Wang, Y. Wang, P. G. T. Walker, C. Walters, P. Winskill, C. Whittaker, C.
A. Donnelly, S. Riley, A. C. Ghani, Report 9: Impact of non-pharmaceutical interventions
(NPIs) to reduce COVID-19 mortality and healthcare demand (2020), (available at
https://www.imperial.ac.uk/media/imperial-college/medicine/sph/ide/gida-fellowships/Imperi
al-College-COVID19-NPI-modelling-16-03-2020.pdf).
2. Q. Bi, Y. Wu, S. Mei, C. Ye, X. Zou, Z. Zhang, X. Liu, L. Wei, S. A. Truelove, T. Zhang, W.
Gao, C. Cheng, X. Tang, X. Wu, Y. Wu, B. Sun, S. Huang, Y. Sun, J. Zhang, T. Ma, J.
Lessler, T. Feng, Epidemiology and transmission of COVID-19 in 391 cases and 1286 of
their close contacts in Shenzhen, China: a retrospective cohort study. The Lancet Infectious
Diseases (2020), , doi:10.1016/s1473-3099(20)30287-5.
3. M. M. Böhmer, U. Buchholz, V. M. Corman, M. Hoch, K. Katz, D. V. Marosevic, S. Böhm, T.
Woudenberg, N. Ackermann, R. Konrad, U. Eberle, B. Treis, A. Dangel, K. Bengs, V.
Fingerle, A. Berger, S. Hörmansdorfer, S. Ippisch, B. Wicklein, A. Grahl, K. Pörtner, N.
Muller, N. Zeitlmann, T. Sonia Boender, W. Cai, A. Reich, M. an der Heiden, U. Rexroth, O.
Hamouda, J. Schneider, T. Veith, B. Mühlemann, R. Wölfel, M. Antwerpen, M. Walter, U.
Protzer, B. Liebl, W. Haas, A. Sing, C. Drosten, A. Zapf, Outbreak of COVID-19 in Germany
Resulting from a Single Travel-Associated Primary Case. SSRN Electronic Journal, ,
doi:10.2139/ssrn.3551335.
4. D. F. Gudbjartsson, A. Helgason, H. Jonsson, O. T. Magnusson, P. Melsted, G. L.
Norddahl, J. Saemundsdottir, A. Sigurdsson, P. Sulem, A. B. Agustsdottir, B. Eiriksdottir, R.
Fridriksdottir, E. E. Gardarsdottir, G. Georgsson, O. S. Gretarsdottir, K. R. Gudmundsson,
T. R. Gunnarsdottir, A. Gylfason, H. Holm, B. O. Jensson, A. Jonasdottir, F. Jonsson, K. S.
Josefsdottir, T. Kristjansson, D. N. Magnusdottir, L. le Roux, G. Sigmundsdottir, G.
Sveinbjornsson, K. E. Sveinsdottir, M. Sveinsdottir, E. A. Thorarensen, B. Thorbjornsson, A.
Löve, G. Masson, I. Jonsdottir, A. D. Möller, T. Gudnason, K. G. Kristinsson, U.
Thorsteinsdottir, K. Stefansson, Spread of SARS-CoV-2 in the Icelandic Population. N.
Engl. J. Med. (2020), doi:10.1056/NEJMoa2006100.
5. R. Wölfel, V. M. Corman, W. Guggemos, M. Seilmaier, S. Zange, M. A. Müller, D.Niemeyer, T. C. Jones, P. Vollmar, C. Rothe, M. Hoelscher, T. Bleicker, S. Brünink, J.
Schneider, R. Ehmann, K. Zwirglmaier, C. Drosten, C. Wendtner, Virological assessment of
hospitalized patients with COVID-2019. Nature (2020), doi:10.1038/s41586-020-2196-x.
6. X. He, E. H. Y. Lau, P. Wu, X. Deng, J. Wang, X. Hao, Y. C. Lau, J. Y. Wong, Y. Guan, X.
Tan, X. Mo, Y. Chen, B. Liao, W. Chen, F. Hu, Q. Zhang, M. Zhong, Y. Wu, L. Zhao, F.
Zhang, B. J. Cowling, F. Li, G. M. Leung, Temporal dynamics in viral shedding and
transmissibility of COVID-19. Nat. Med. (2020), doi:10.1038/s41591-020-0869-5.
7. C. R. Rao, I. Olkin, S. G. Ghurye, W. Hoeffding, W. G. Madow, H. B. Mann, Contributions to
Probability and Statistics. Essays in Honor of Harold Hotelling. Revue de l’Institut
International de Statistique / Review of the International Statistical Institute. 29 (1961), p.
83.
8. W. H. Kruskal, W. Allen Wallis, Use of Ranks in One-Criterion Variance Analysis. Journal of
the American Statistical Association. 47 (1952), pp. 583–621.
9. J. W. Tukey, Comparing Individual Means in the Analysis of Variance. Biometrics. 5 (1949),
p. 99.
10. O. J. Dunn, Estimation of the Means of Dependent Variables. The Annals of Mathematical
Statistics. 29 (1958), pp. 1095–1111.
11. O. J. Dunn, Multiple Comparisons Using Rank Sums. Technometrics. 6 (1964), pp.
241–252.
12. R. Castagnoli, M. Votto, A. Licari, I. Brambilla, R. Bruno, S. Perlini, F. Rovida, F. Baldanti,
G. L. Marseglia, Severe Acute Respiratory Syndrome Coronavirus 2 (SARS-CoV-2)
Infection in Children and Adolescents: A Systematic Review. JAMA Pediatr. (2020),
doi:10.1001/jamapediatrics.2020.1467.
13. Z. Du, C. Nugent, B. J. Cowling, L. A. Meyers, Hundreds of severe pediatric COVID-19
infections in Wuhan prior to the lockdown, , doi:10.1101/2020.03.16.20037176.
14. N. C. Institute, National Cancer Institute, Skilled Nursing Facility with Medicare Certification
in Anticipation of Covered Skilled Care. Definitions (2020), , doi:10.32388/tgnx82.
15. E. Lavezzo, E. Franchin, C. Ciavarella, G. Cuomo-Dannenburg, L. Barzon, C. Del Vecchio,
L. Rossi, R. Manganelli, A. Loregian, N. Navarin, D. Abate, M. Sciro, S. Merigliano, E.
Decanale, M. C. Vanuzzo, F. Saluzzo, F. Onelia, M. Pacenti, S. Parisi, G. Carretta, D.
Donato, L. Flor, S. Cocchio, G. Masi, A. Sperduti, L. Cattarino, R. Salvador, K. A. M.
Gaythorpe, A. R. Brazzale, S. Toppo, M. Trevisan, V. Baldo, C. A. Donnelly, N. M.
Ferguson, I. Dorigatti, A. Crisanti, Imperial College London COVID-19 Response Team,
Suppression of COVID-19 outbreak in the municipality of Vo, Italy, ,
doi:10.1101/2020.04.17.20053157.
16. P. Virtanen, R. Gommers, T. E. Oliphant, M. Haberland, T. Reddy, D. Cournapeau, E.
Burovski, P. Peterson, W. Weckesser, J. Bright, S. J. van der Walt, M. Brett, J. Wilson, K. J.
Millman, N. Mayorov, A. R. J. Nelson, E. Jones, R. Kern, E. Larson, C. J. Carey, İ. Polat, Y.
Feng, E. W. Moore, J. VanderPlas, D. Laxalde, J. Perktold, R. Cimrman, I. Henriksen, E. A.Quintero, C. R. Harris, A. M. Archibald, A. H. Ribeiro, F. Pedregosa, P. van Mulbregt, SciPy
1.0 Contributors, SciPy 1.0: fundamental algorithms for scientific computing in Python. Nat.
Methods. 17, 261–272 (2020).
17. W. McKinney, Data Structures for Statistical Computing in Python. Proceedings of the 9th
Python in Science Conference (2010), , doi:10.25080/majora-92bf1922-00a.
18. S. Seabold, J. Perktold, Statsmodels: Econometric and Statistical Modeling with Python.
Proceedings of the 9th Python in Science Conference (2010), ,
doi:10.25080/majora-92bf1922-011.
19. J. D. Hunter, Matplotlib: A 2D Graphics Environment. Computing in Science & Engineering.
9 (2007), pp. 90–95.
20. T. Oliphant, Guide to NumPy: 2nd Edition (CreateSpace, 2015).
21. M. Waskom, O. Botvinnik, P. Hobson, J. B. Cole, Y. Halchenko, S. Hoyer, A. Miles, T.
Augspurger, T. Yarkoni, T. Megies, L. P. Coelho, D. Wehner, cynddl, E. Ziegler, diego, Y.
V. Zaytsev, T. Hoppe, S. Seabold, P. Cloud, M. Koskinen, K. Meyer, A. Qalieh, D. Allan,
seaborn: v0.5.0 (November 2014) (2014), doi:10.5281/zenodo.12710.Appendix
Categorization Statistic p value Result
C1 0.959 2.713e-31 significant, not normally distributed
C2 0.957 8.563e-32 significant, not normally distributed
Table A1: Shapiro test for normal distribution.
Categorization Statistic p value Result
C1 1.800 0.063 Not significant, equal variance
C2 2.302 0.042 Significant, unequal variance
Table A2: Levene’s test for equality of variance.
Categorization Statistic p value Result
C1 22.390 0.008 significant, a differing pair may exist
C2 14.969 0.010 significant, a differing pair may exist
Table A3: Kruskal-Wallis H test.
Categorization Group 1 Group 2 Mean diff p-adjusted lower upper reject
C1 1 2 0.1608 0.9 -0.9385 1.2601 FALSE
1 3 0.624 0.4633 -0.2761 1.524 FALSE
1 4 0.5758 0.5617 -0.3186 1.4702 FALSE
1 5 0.3472 0.9 -0.5503 1.2446 FALSE
1 6 0.6205 0.4598 -0.2724 1.5133 FALSE
1 7 0.6411 0.4379 -0.2681 1.5503 FALSE
1 8 0.5365 0.6675 -0.3738 1.4469 FALSE
1 9 0.7066 0.3171 -0.2197 1.6329 FALSE
1 10 0.9714 0.7008 -0.7261 2.6689 FALSE2 3 0.4631 0.5812 -0.2677 1.194 FALSE 2 4 0.4149 0.6989 -0.3089 1.1388 FALSE 2 5 0.1863 0.9 -0.5413 0.914 FALSE 2 6 0.4596 0.5755 -0.2623 1.1816 FALSE 2 7 0.4803 0.5549 -0.2618 1.2223 FALSE 2 8 0.3757 0.8309 -0.3678 1.1193 FALSE 2 9 0.5458 0.4159 -0.2172 1.3087 FALSE 2 10 0.8105 0.8371 -0.8036 2.4247 FALSE 3 4 -0.0482 0.9 -0.4026 0.3062 FALSE 3 5 -0.2768 0.314 -0.6389 0.0853 FALSE 3 6 -0.0035 0.9 -0.3539 0.3469 FALSE 3 7 0.0171 0.9 -0.373 0.4073 FALSE 3 8 -0.0874 0.9 -0.4804 0.3056 FALSE 3 9 0.0826 0.9 -0.3459 0.5112 FALSE 3 10 0.3474 0.9 -1.1382 1.833 FALSE 4 5 -0.2286 0.5354 -0.5764 0.1192 FALSE 4 6 0.0447 0.9 -0.291 0.3803 FALSE 4 7 0.0653 0.9 -0.3116 0.4423 FALSE 4 8 -0.0392 0.9 -0.4191 0.3407 FALSE 4 9 0.1308 0.9 -0.2858 0.5474 FALSE 4 10 0.3956 0.9 -1.0866 1.8778 FALSE 5 6 0.2733 0.2597 -0.0705 0.6171 FALSE 5 7 0.2939 0.313 -0.0903 0.6782 FALSE 5 8 0.1894 0.8622 -0.1977 0.5765 FALSE 5 9 0.3594 0.1781 -0.0637 0.7826 FALSE 5 10 0.6242 0.9 -0.8599 2.1083 FALSE 6 7 0.0206 0.9 -0.3526 0.3939 FALSE 6 8 -0.0839 0.9 -0.4601 0.2923 FALSE 6 9 0.0861 0.9 -0.3271 0.4994 FALSE 6 10 0.3509 0.9 -1.1304 1.8322 FALSE 7 8 -0.1046 0.9 -0.518 0.3089 FALSE 7 9 0.0655 0.9 -0.382 0.5129 FALSE
7 10 0.3303 0.9 -1.1609 1.8215 FALSE
8 9 0.17 0.9 -0.2799 0.6199 FALSE
8 10 0.4348 0.9 -1.0571 1.9268 FALSE
9 10 0.2648 0.9 -1.2369 1.7665 FALSE
C2 Adult GS 0.2054 0.9 -1.1618 1.5726 FALSE
Adult HS -0.3757 0.5574 -1.0259 0.2744 FALSE
Adult KG -0.7879 0.1304 -1.6944 0.1186 FALSE
Adult Mature 0.0701 0.9 -0.1246 0.2649 FALSE
Adult Uni 0.1244 0.9 -0.242 0.4908 FALSE
GS HS -0.5811 0.8701 -2.0793 0.917 FALSE
GS KG -0.9934 0.503 -2.6193 0.6325 FALSE
GS Mature -0.1353 0.9 -1.499 1.2285 FALSE
GS Uni -0.081 0.9 -1.4796 1.3176 FALSE
HS KG -0.4122 0.8885 -1.5063 0.6819 FALSE
HS Mature 0.4459 0.3561 -0.197 1.0887 FALSE
HS Uni 0.5001 0.3441 -0.2138 1.214 FALSE
KG Mature 0.8581 0.0728 -0.0432 1.7594 FALSE
KG Uni 0.9123 0.0701 -0.0409 1.8656 FALSE
Mature Uni 0.0543 0.9 -0.2991 0.4076 FALSE
Table A4: Tukey HSD post hoc analysis. No significant difference is found between any pair of
subgroups in either of the two categorizations. KG: kindergarten; GS: grade school; HS: high school;
Uni: University.
Categorization Critical value Result
C1 0.0011 No significant pairs
C2 0.0033 No significant pairs
Table A5: Bonferroni-adjusted pairwise post hoc T-tests. No significant difference is found
between any pair of subgroups in either of the two categorizations.1 2 3 4 5 6 7 8 9 10
1 -1 1 0.588 1 1 0.499 0.425 0.829 0.301 1
2 -1 1 1 1 1 1 1 0.738 1
3 -1 1 0.589 1 1 1 1 1
4 -1 1 1 1 1 1 1
5 -1 0.322 0.335 1 0.216 1
6 -1 1 1 1 1
7 -1 1 1 1
8 -1 1 1
9 -1 1
10 -1
Table A6a: Dunn’s post hoc test for categorization C1. No significant difference is found
between any pair of subgroups in either of the two categorizations.
Adult GS HS KG Mature Uni
Adult -1 1 0.996 0.128 0.847 1
GS -1 1 0.847 1 1
HS -1 1 0.455 0.549
KG -1 0.045 0.056
Mature -1 1
Uni -1
Table A6b: Dunn’s post hoc test for categorization C2. Just one inter-group comparison,
Kindergarten vs Mature has a p value (0.045) less that the traditional 0.05 significance
threshold. KG: kindergarten; GS: grade school; HS: high school; Uni: University.Figure A1: Positive age group counts versus population count. A) Total number of people tested for SARS-CoV-2 in each age group plotted against the total number of people in the corresponding age group in Berlin (acquired from Amt für Statistik Berlin-Brandenburg, https://www.statistik-berlin-brandenburg.de/, as of December 31, 2019). B) Number of people tested positive for SARS-CoV-2 plotted against the number of people in each age group in Berlin. Age categories 1-10 and 11-20 years have a relatively lower number of tested and positive cases. A linear regression is shown with the shaded area indicating the 95% confidence interval.
Figure A2: Differences in viral load in patients aged 1-11 years with and without a pre-existing condition. Wilcoxon rank-sum test indicates a significant difference between the two groups (p value 0.02).
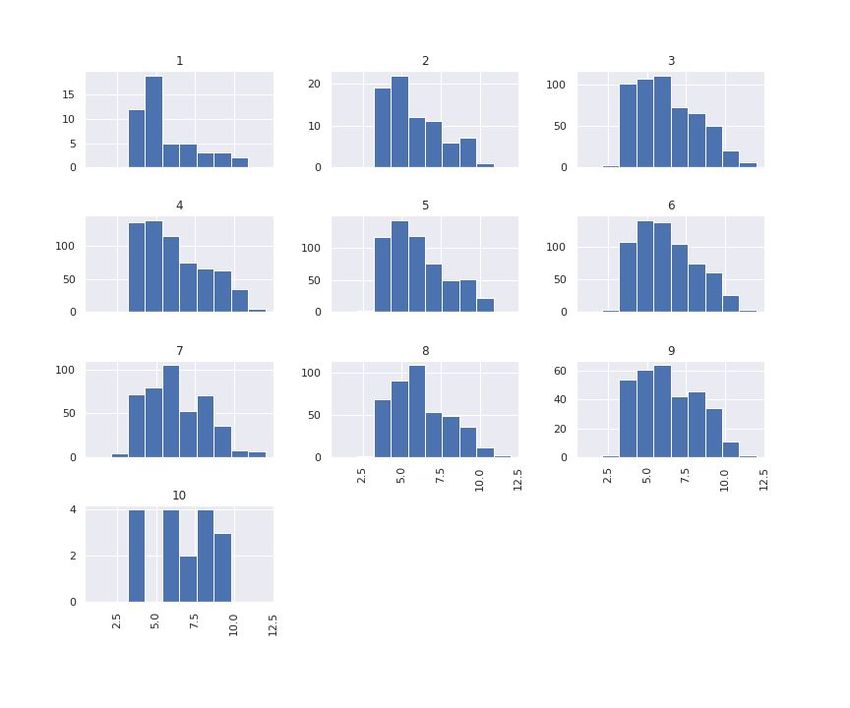
Figure A3: Per-group viral load histograms for categorization C1: The individual histograms for the ten groups of categorization C1 make it immediately clear that the underlying distribution of viral load for group 10 (91-100 years) is far from normal, and several other groups are clearly also not normally distributed. Note that the data above are also presented in Figure 2A, although there presented with viral load on the y-axis, with the distribution spreading horizontally in two directions, with added jitter for the spread visualization.
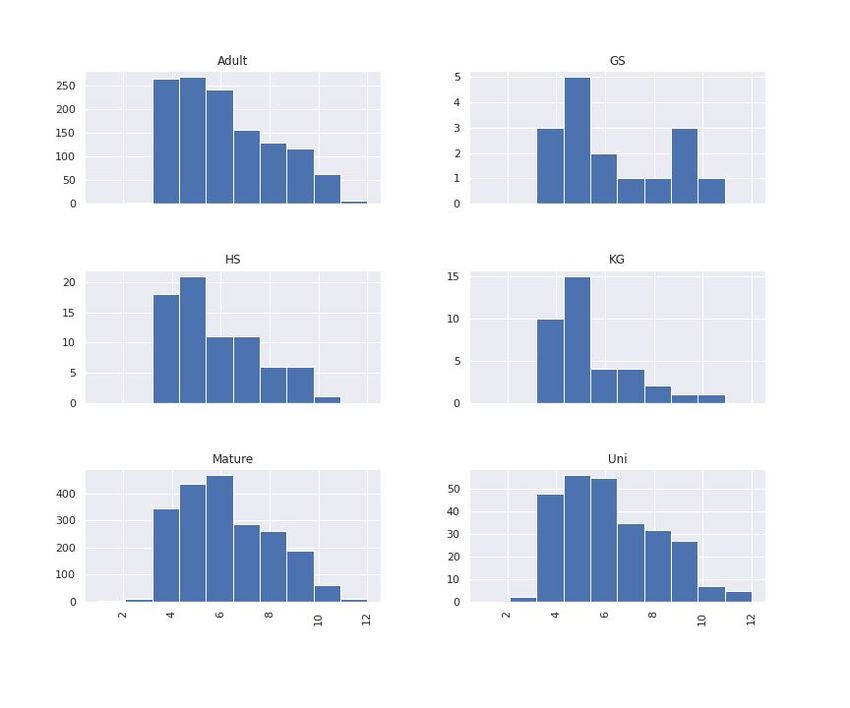
Figure A4: Per-group viral load histograms for categorization C2: The individual histograms for the six groups of categorization C2 make it immediately clear that the underlying distributions are not normal. Note that the data above are also presented in Figure 2B, although there presented with viral load on the y-axis, with the distribution spreading horizontally in two directions, with added jitter for the spread visualization.
You can also read